How to Increase Store Conversion Rate: The Complete Guide
Did you know the average retail store conversion rate sits between 20% and 40%, yet most store owners have no idea what theirs actually is — or how much money they leave on the table every single day?
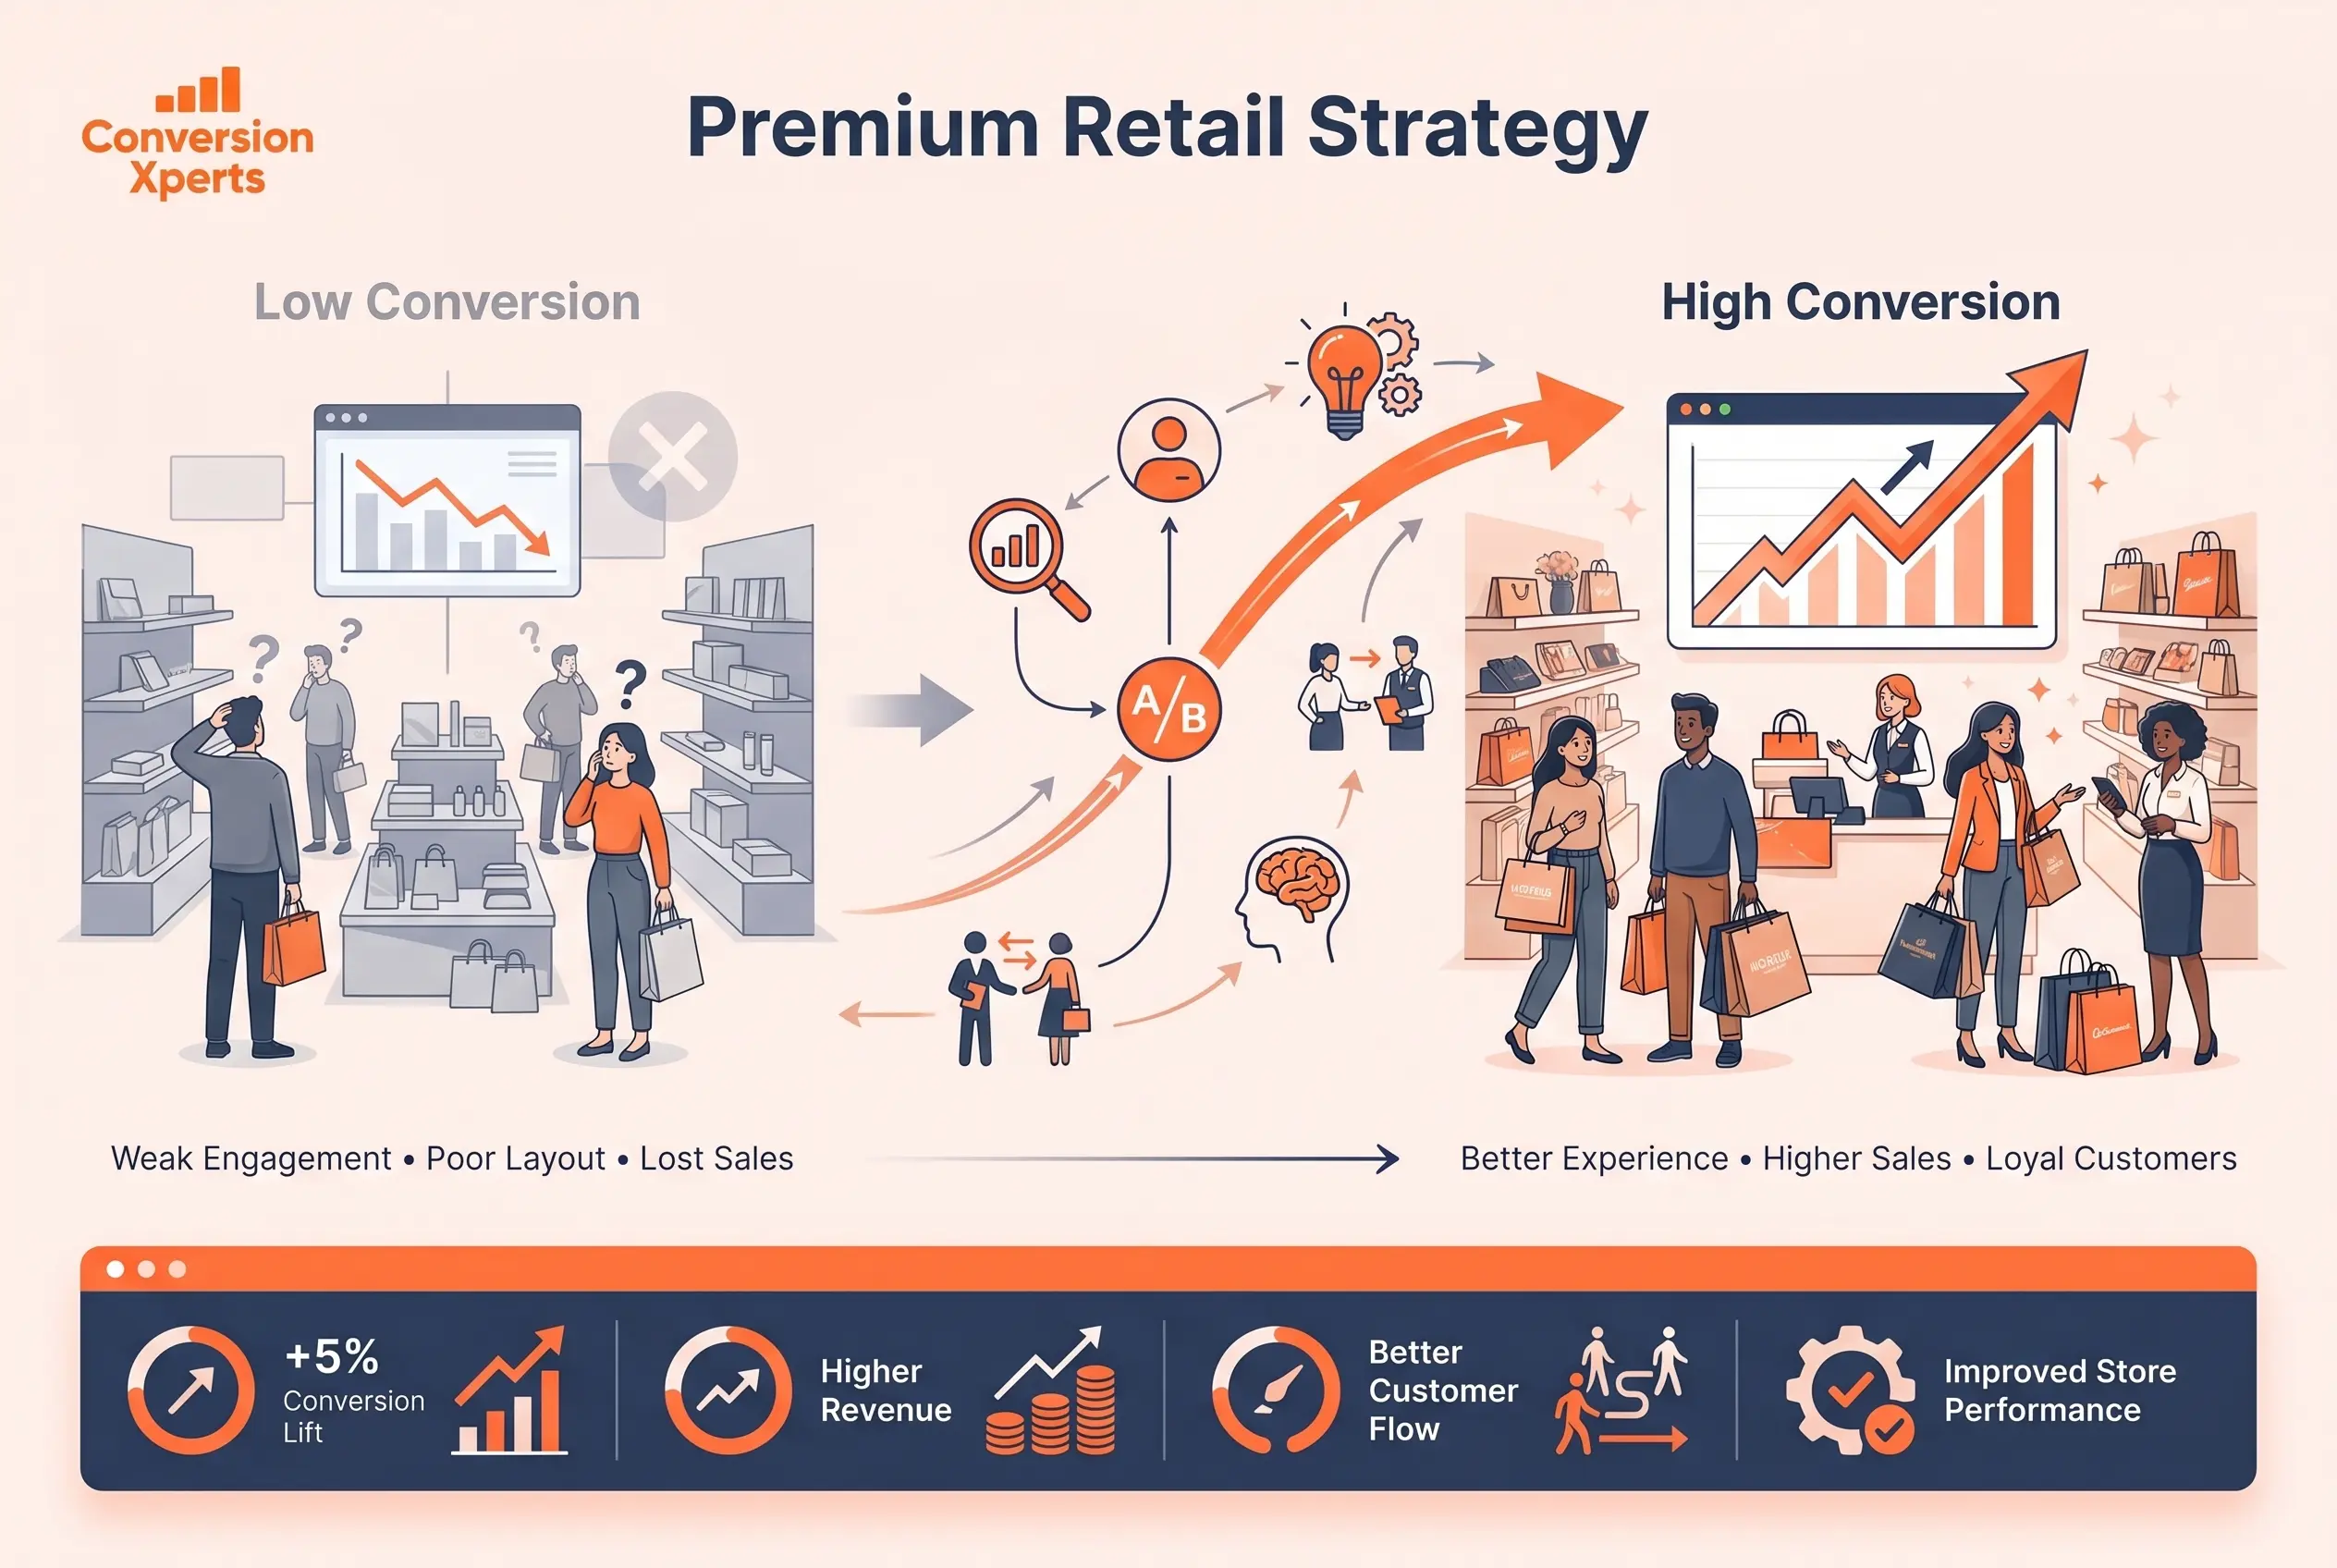
If you want to know how to increase your store conversion rate, you are in the right place. A difference of just 5 percentage points in your conversion rate can mean tens of thousands of dollars in additional annual revenue without a single extra dollar spent on advertising or foot traffic.
In this guide you will learn exactly what store conversion rate means, how to measure it accurately, the psychological and environmental factors that move the needle the most, and a complete tactical playbook you can start implementing this week. Whether you run a boutique fashion shop, a grocery outlet, a consumer electronics showroom, or a multi-location chain, every strategy here is grounded in retail science, real-world case studies, and current data.
Let us get into it.
What Is Retail Store Conversion Rate and Why It Matters
Store conversion rate is the percentage of people who enter your store and complete a purchase. It is calculated by dividing the number of transactions by the number of visitors and multiplying by 100.
This single metric is arguably the most powerful number in brick-and-mortar retail. Unlike foot traffic, which depends heavily on location, advertising spend, and seasonality, your conversion rate is almost entirely within your control. It reflects the quality of your store experience, your product assortment, your staff performance, and your pricing clarity.
The Revenue Multiplier Effect
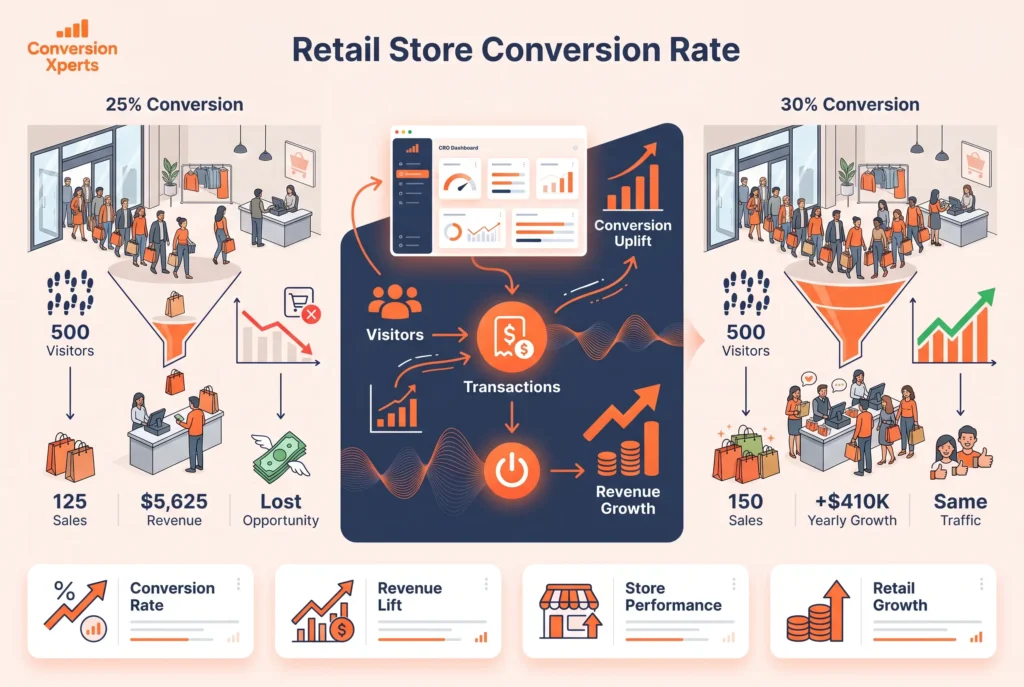
Consider this scenario. You have 500 visitors per day and a 25% conversion rate, which means 125 transactions. Your average basket size is $45. That is $5,625 in daily revenue.
Now raise your conversion rate by just 5 percentage points to 30%. With the same 500 visitors, you now generate 150 transactions. At the same $45 average basket, that is $6,750 per day. That is $1,125 more every single day, or roughly $410,000 more per year, from the same foot traffic.
This is why learning how to increase store conversion rate is one of the highest-return activities available to any retailer.
Why Most Retailers Neglect Conversion Rate
A 2023 report by the National Retail Federation found that fewer than 30% of independent retailers actively track store conversion rate on a weekly basis. Most focus on total sales or year-over-year revenue, which are lagging indicators. Conversion rate is a leading indicator. It tells you what is happening in your store right now, before it shows up in your P&L.
How to Calculate and Benchmark Your Store Conversion Rate
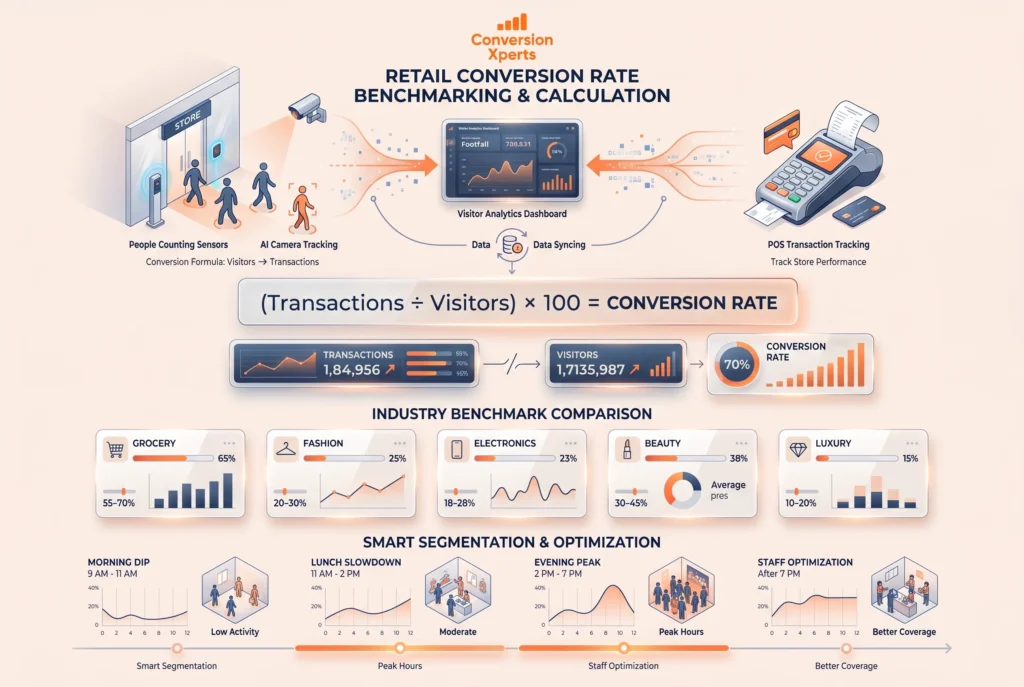
Store conversion rate is calculated using this formula: (Number of Transactions / Number of Store Visitors) x 100.
Before you can improve your retail store conversion rate, you need to know what it is today and what a realistic target looks like for your specific retail category.
Setting Up Accurate People Counting
The most common mistake retailers make when measuring conversion rate is using inaccurate visitor counts. Door counters range from basic infrared sensors (roughly 85% accuracy) to advanced 3D stereoscopic cameras with AI filtering (accuracy above 97%). If you are using a basic sensor near the entrance, you are likely counting staff arrivals, repeat trips to the bathroom, and people who browse the window but never enter.
Best practice is to install a thermal or 3D overhead sensor above the entrance door, exclude staff using a secondary counter or badge-in system, and set your counting window to match your POS transaction window so the comparison is apples to apples.
Retail Store Conversion Rate Benchmarks by Category
The right benchmark depends heavily on your retail vertical. Comparing a grocery store to a jewelry boutique would be misleading because purchase frequency and browse time differ dramatically.
Retail Category | Average Conversion Rate | Top Quartile |
Grocery and Convenience | 55% to 70% | 75%+ |
Apparel and Fashion | 20% to 30% | 35%+ |
Consumer Electronics | 18% to 28% | 33%+ |
Home Furnishings | 15% to 25% | 30%+ |
Specialty (Books, Hobbies) | 25% to 40% | 48%+ |
Jewelry and Luxury | 10% to 20% | 25%+ |
Health and Beauty | 30% to 45% | 52%+ |
Sporting Goods | 22% to 32% | 38%+ |
Source: RetailNext Benchmarking Report 2024 and Sensormatic Solutions Industry Data 2023.
Time-Based Segmentation
Your conversion rate will not be flat throughout the day or week. Retailers who break conversion data into hourly segments almost always discover conversion drops during lunch hours (staff on break), weekday mornings (browsers not buyers), and the first hour of opening (before buyers arrive). This segmentation tells you exactly when to schedule your best staff, run time-limited promotions, and adjust your floor coverage.
How to Increase Conversion Rate in Retail Through Store Design and Layout
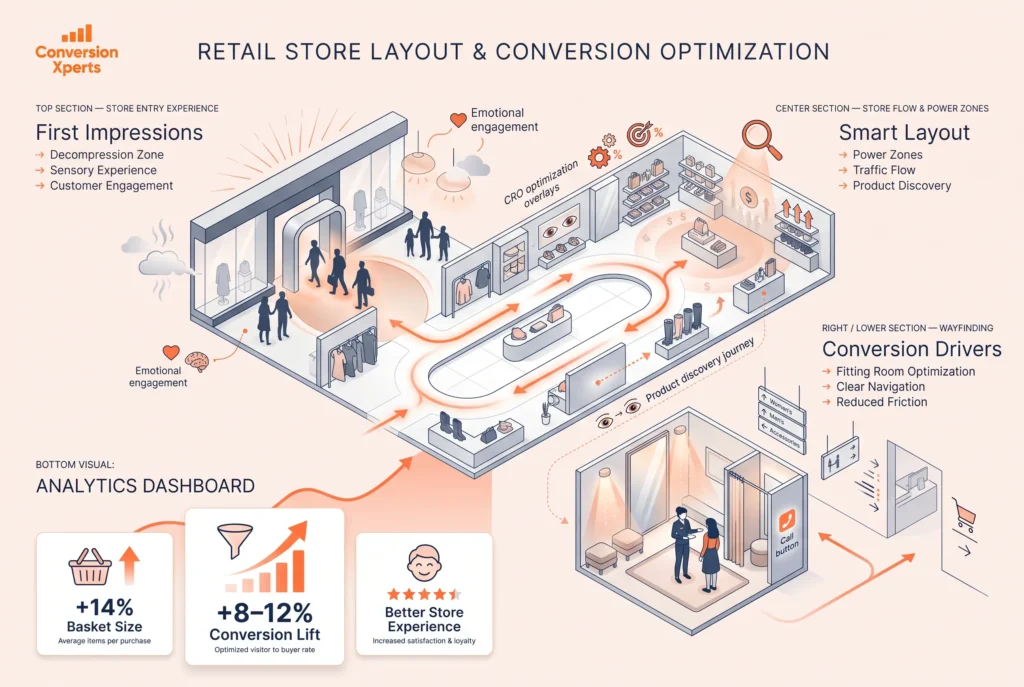
Store design is the single highest-leverage factor in retail conversion rate improvement. A well-designed store guides customers through a journey that maximizes both purchase probability and basket size.
The Decompression Zone and First Impressions
Research from retail consultant and author Paco Underhill, published in his landmark work “Why We Buy” and supported by subsequent eye-tracking studies, confirms that the first 10 to 15 feet of a store (known as the decompression zone) are almost universally ignored by shoppers. They are still adjusting to the new environment. Placing sale signage, key products, or loyalty sign-up materials in this zone is a waste of prime real estate.
The most effective use of the decompression zone is sensory engagement. A coffee scent in a bookstore, a warm color palette in a fashion boutique, or upbeat music calibrated to your target demographic immediately shifts the customer’s emotional state toward openness and engagement. A 2022 study published in the Journal of Retailing found that ambient scent alone increased average transaction size by 14% in tested retail environments.
Power Zones and Traffic Flow
The right side of the store is statistically the most valuable real estate in any retail layout. Studies consistently show that 90% of customers turn right upon entering a store. Placing your highest-margin, highest-conversion products in the right-side power zone captures buyers at the moment of peak receptivity.
Loop or racetrack layouts, popularized by IKEA but applicable at any scale, are proven to increase the number of product categories a customer encounters. The more categories a customer touches, the higher the probability of conversion and upsell. Specialty retailers who redesigned from grid to loop layouts have reported conversion rate improvements of 8% to 12% in controlled before-and-after studies tracked by ShopperTrak.
Fitting Rooms as Conversion Engines
For apparel and fashion retailers, the fitting room is the single highest-conversion touchpoint in the store. According to a 2023 study by Retail Dive, customers who use a fitting room convert at a rate 5x higher than those who do not. Yet most retailers treat fitting rooms as a necessary inconvenience rather than an active sales asset.
Tactics that measurably improve fitting room conversion include attendant-assisted entry (staff take items in, note sizes, offer to pull alternatives), integrated lighting that flatters (warm white at 3000K rather than harsh cool overhead), two-way hooks for keep and return piles, and a direct call button to request additional sizes without leaving.
Signage and Wayfinding
Unclear wayfinding reduces conversion by increasing cognitive friction. When a customer cannot find what they are looking for within 60 seconds, the probability of a conversion-killing decision (give up and leave) rises sharply. Internal research shared by Simon-Kucher and Partners in their 2024 retail pricing study found that poor wayfinding was cited by 34% of shoppers as a reason for not completing a planned purchase.
Effective retail signage uses a three-tier hierarchy: department identifiers visible from the entrance (hanging or overhead signs), category markers at aisle level, and product-level price and feature callouts on the shelf. Every tier should use consistent typography, colors, and language so customers learn the system instinctively.
Staff Training and Customer Experience Tactics That Drive Conversions
Your retail staff is your most powerful and most variable conversion lever. The difference between a well-trained associate and an untrained one can translate to a 15 to 20 percentage point gap in personal conversion rate.
The Science of the Greeting
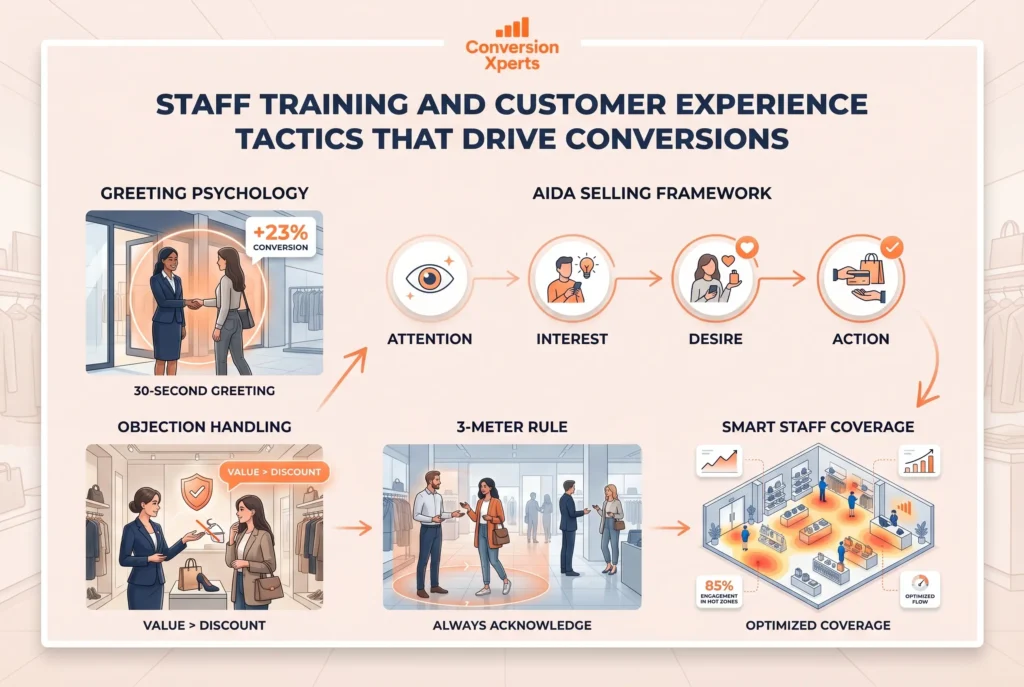
Not all greetings are equal. A 2021 study from the Customer Experience Professionals Association found that an immediate greeting within 30 seconds of entry increased conversion probability by 23% compared to no greeting. However, the type of greeting matters enormously.
Generic greetings like “Can I help you?” trigger an automatic defensive response: “No thanks, just looking.” This phrase effectively ends the interaction before it starts. High-converting staff use observation-based openers instead: “I love that jacket you are wearing. We just got a new collection that would pair beautifully with it.” These context-specific approaches feel like the beginning of a conversation rather than a sales attempt, and they keep the door open.
The AIDA Selling Framework for Retail
The AIDA model (Attention, Interest, Desire, Action) remains one of the most effective structured selling frameworks for in-store associates. Training staff to move customers through each stage consciously is far more effective than hoping for a natural sale.
Attention is captured with the opening. Interest is built through product education, demonstration, or storytelling about the brand behind the product. Desire is created by connecting product features to personal benefits specific to that customer. Action is closed with a direct invitation: “Shall I ring that up for you?” or “Can I set that aside while you finish looking?”
Retailers who implement formal AIDA training programs typically see conversion rate improvements of 10% to 18% within 90 days, according to training firm Impact Group’s 2023 client benchmarking data.
Handling Objections to Conversion
The most common conversion killers in retail are price objections, indecision, and the “I need to think about it” delay. Staff who are trained to handle these with empathy rather than pressure dramatically improve close rates.
For price objections, value reframing works better than discounting. Instead of immediately offering a discount, the associate acknowledges the concern, then recaps the value: “I completely understand. The reason this piece is priced at $X is because of [specific benefit]. A lot of customers who were initially hesitant have told me it was worth every penny.” This approach preserves margin while addressing the real concern, which is usually uncertainty about value rather than absolute budget.
Proactive Floor Coverage and the 3-Meter Rule
The 3-meter rule is simple: any customer who comes within 3 meters of a staff member gets acknowledged, even if they are busy with another customer. A simple nod, a “I will be right with you,” or a pointed direction eliminates the invisible abandonment that drives shoppers out of the store without buying.
Scheduling floor coverage to match conversion data is equally important. If your people-counting data shows that Saturdays from 2 PM to 5 PM are your highest-traffic window, but your lowest-conversion window, you have a staffing problem, not a product problem.
Pricing, Promotions, and Merchandising Strategies to Lift Retail Store Conversion
Price, presentation, and promotional architecture are the three pillars of merchandising-driven conversion improvement. Getting any one of them wrong can suppress your retail store conversion rate even when every other element is working.
Psychological Pricing That Drives Decisions
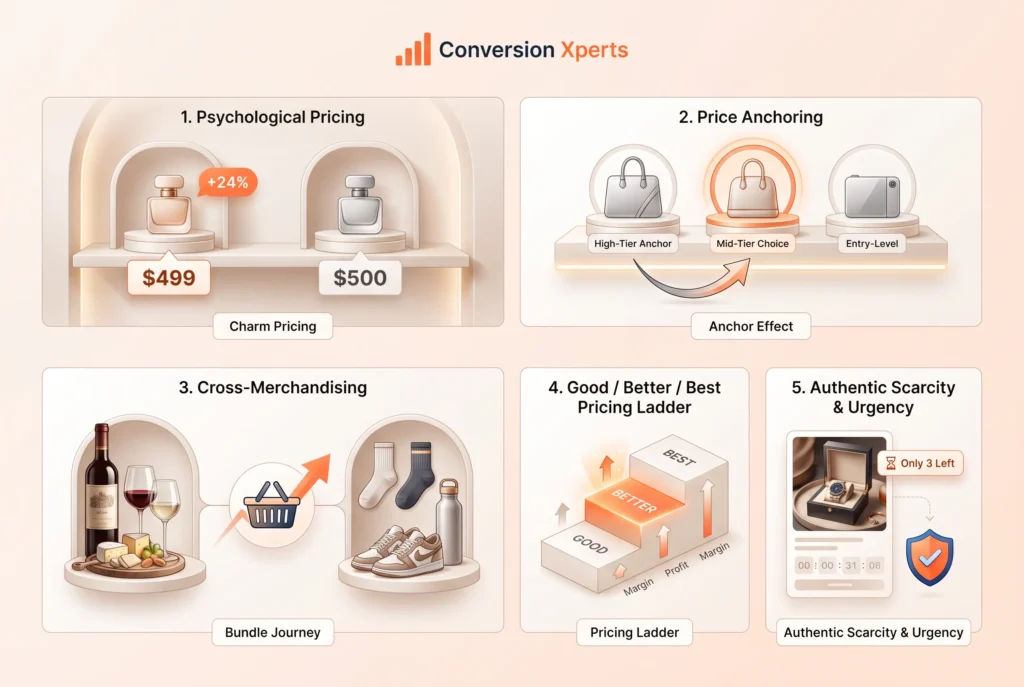
Charm pricing (ending prices in .99 or .95) has been validated in retail for decades. A landmark study by MIT and the University of Chicago found that prices ending in .99 outperformed identical round prices by an average of 24% in tested retail environments. However, this effect is context-dependent. In luxury retail, round numbers signal quality and exclusivity, so $500 outperforms $499.99 in a high-end jewelry context.
Anchoring is equally powerful. Placing a premium product ($300) next to your target product ($150) makes the target product feel like a bargain, even if neither price changed. This is why high-converting retailers always have a “hero” product at a premium price point displayed in close proximity to their core assortment.
Bundling and Cross-Merchandising
Cross-merchandising, placing complementary products together rather than by category, directly increases both conversion and average transaction value. A wine retailer who places wine openers, glasses, and cheese boards in the wine aisle converts browser visits to multi-item purchases. A sporting goods retailer who places socks, insoles, and water bottles near the shoe section turns a single shoe purchase into a full kit transaction.
According to a 2024 report by Deloitte’s retail practice, cross-merchandising initiatives in specialty retail drove an average 19% increase in units per transaction without requiring any additional foot traffic.
Promotion Architecture: The Good, Better, Best Model
A clearly defined good-better-best product ladder across price points ensures that every customer entering your store has an appropriate entry point. Without it, budget-conscious customers who cannot see an affordable option leave without buying, even when a lower-priced alternative exists somewhere in the store.
Practical implementation means ensuring that every product category has at least three visible price points, that the best (premium) option is prominently featured for anchoring purposes, and that signage explicitly calls out the value proposition at each tier.
Price Tier | Role in Conversion | Typical Margin Profile |
Good (entry) | Capture price-sensitive buyers | Low to mid margin |
Better (core) | Volume driver, highest conversion | Mid to high margin |
Best (premium) | Anchor and upgrade target | Highest margin |
Urgency and Scarcity Without Manipulation
Urgency and scarcity are proven conversion accelerators, but only when they are authentic. Countdown clocks on genuinely limited promotions, visible low-stock indicators on popular items, and honest communication about seasonal availability all create legitimate urgency that moves buyers who would otherwise delay.
Manufactured or false scarcity, on the other hand, has the opposite effect on repeat customers. A 2022 survey by Edelman Trust Barometer found that 81% of consumers said they need to be able to trust a brand to buy from them. Retailers caught misrepresenting scarcity see measurable drops in repeat conversion rates.
Technology and Data Tools That Help You Improve Conversion Rate in Retail
Modern retail technology has democratized the kind of conversion analytics that used to require enterprise-level investment. Even small independent retailers can now access real-time behavioral data that was impossible to gather a decade ago.
People Counting and Heat Mapping
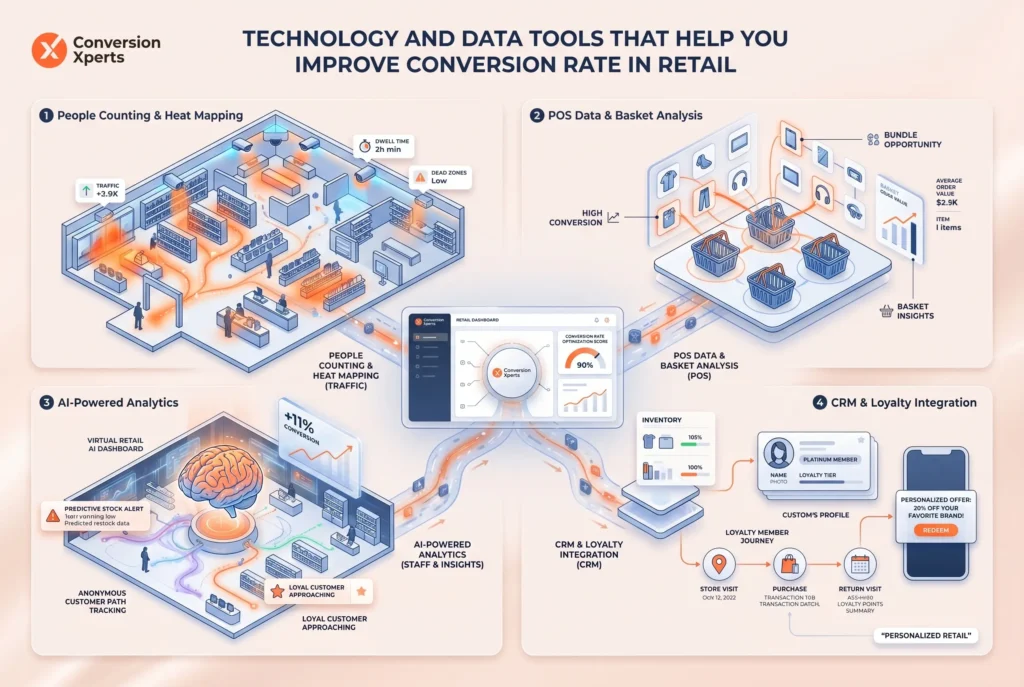
People-counting technology is the foundation of conversion rate measurement. Entry-level options like Dor (a battery-powered door sensor with a monthly subscription) give small retailers their first accurate traffic data for under $50 per month. Mid-tier options like Density and RetailNext add heat mapping, dwell time analysis, and zone-level traffic data that reveal exactly where customers go, where they stop, and where they abandon.
Heat mapping in particular is a conversion game-changer. It frequently reveals counter-intuitive insights: that a popular display is actually causing flow blockage and pushing customers toward the exit, or that a high-margin section is invisible to most shoppers because it sits in a natural dead zone.
POS Data and Basket Analysis
Your POS system already contains an enormous amount of conversion intelligence that most retailers never extract. Item-level analysis of transactions reveals which products appear in high-conversion baskets, which products are almost always purchased alone (and are therefore candidates for cross-merchandising), and which products have high add-to-basket but low purchase completion rates (which often signals a pricing or presentation problem at the shelf).
Modern POS platforms like Lightspeed, Square for Retail, and Shopify POS all offer built-in basket analysis tools. Dedicate time weekly to reviewing these reports, not just total sales.
AI-Powered Customer Analytics
A growing number of retail analytics platforms now incorporate computer vision and machine learning to provide real-time conversion insights. Platforms like Standard AI, Aifi, and RetailNext’s latest generation tools can track customer journeys anonymously through a store, identify abandonment patterns at a section level, and alert staff in real time when conversion-critical areas are understaffed.
According to a 2024 McKinsey report on retail technology adoption, retailers who implemented AI-driven analytics tools saw an average 11% improvement in store conversion rate within the first 12 months of implementation.
CRM and Loyalty Program Integration
A well-structured loyalty program does more than reward repeat purchases. It provides the customer identification data needed to link visits to transactions, which makes true conversion rate measurement possible at an individual customer level. It also enables personalized outreach that drives return visits and provides conversion data by customer segment.
Retailers who can identify that loyalty members convert at 42% while first-time visitors convert at 19% can build targeted interventions: a welcome offer for first-time buyers, a “we miss you” promotion for lapsing members, or a personalized recommendation engine based on purchase history.
Omnichannel Integration: Connecting Online and Offline to Boost Store Conversion
The boundary between online browsing and in-store buying has all but disappeared for modern consumers. Retailers who treat their physical store as an isolated channel are leaving significant conversion opportunity on the table.
BOPIS and Click-and-Collect Conversion Effects
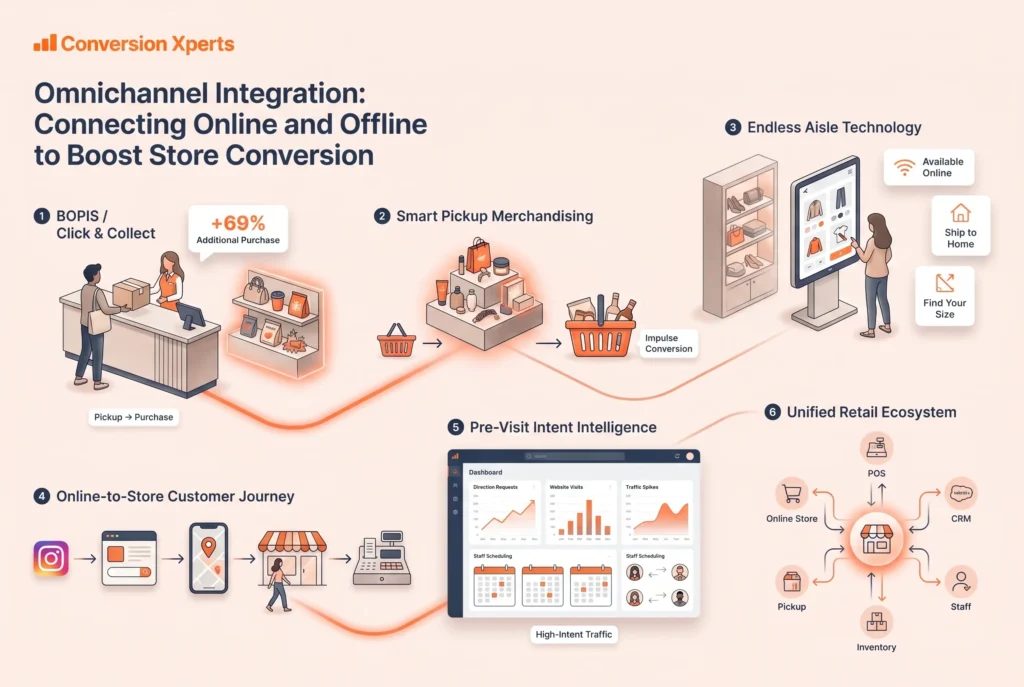
Buy Online, Pick Up In Store (BOPIS) is not just a fulfillment option. It is a conversion multiplier for the physical store. A 2023 study by the International Council of Shopping Centers found that 69% of consumers who pick up an online order in-store make an additional purchase during that visit. This means that every BOPIS transaction is a high-probability conversion event that you can amplify through smart merchandising near your pickup counter.
Retailers who place impulse-friendly, frequently replenished items (seasonal items, snacks, accessories, small home goods) at the BOPIS pickup area convert up to 40% of pickup visits into incremental purchase transactions.
Digital Signage and Endless Aisle
Inventory constraints suppress conversion. When a customer wants a product in a specific size, color, or configuration that you do not have in stock, you lose that conversion unless you have a pathway to fulfill it. Digital signage that provides access to your online inventory, competitor-scanning QR codes that show customers what else you carry, and tablet-based endless aisle kiosks all prevent the “they did not have my size” conversion loss.
Endless aisle technology has shown particularly strong results in footwear, apparel, and home furnishings, where size and color variants are critical purchase criteria. Retailers implementing kiosk-based endless aisle solutions have reported recovering 12% to 18% of previously lost conversion from stock-outs, according to JDA Software’s 2023 omnichannel retail report.
Pre-Visit Intent Data
Customers who engage with your brand online before visiting your store have measurably higher conversion rates when they arrive. They have already done research, already formed intent, and often already decided to buy. Retailers who understand pre-visit behavior through tools like Google Analytics (tracking store page visits, hours lookups, and direction requests), social media engagement data, and email open tracking can predict high-intent visit windows and ensure those sessions receive optimal floor coverage and proactive staff engagement.
A retail location that sees a spike in Google Business Profile direction requests on Saturday morning, for example, should schedule its most conversion-focused staff for Saturday morning opening, not the least experienced team member.
Measuring Progress: KPIs and Metrics Every Retailer Must Track
Improving your retail store conversion rate is an ongoing process, not a one-time project. Setting up the right measurement infrastructure ensures you can track progress, attribute improvements to specific initiatives, and course-correct quickly when tactics underperform.
Primary KPIs for Conversion Rate Improvement
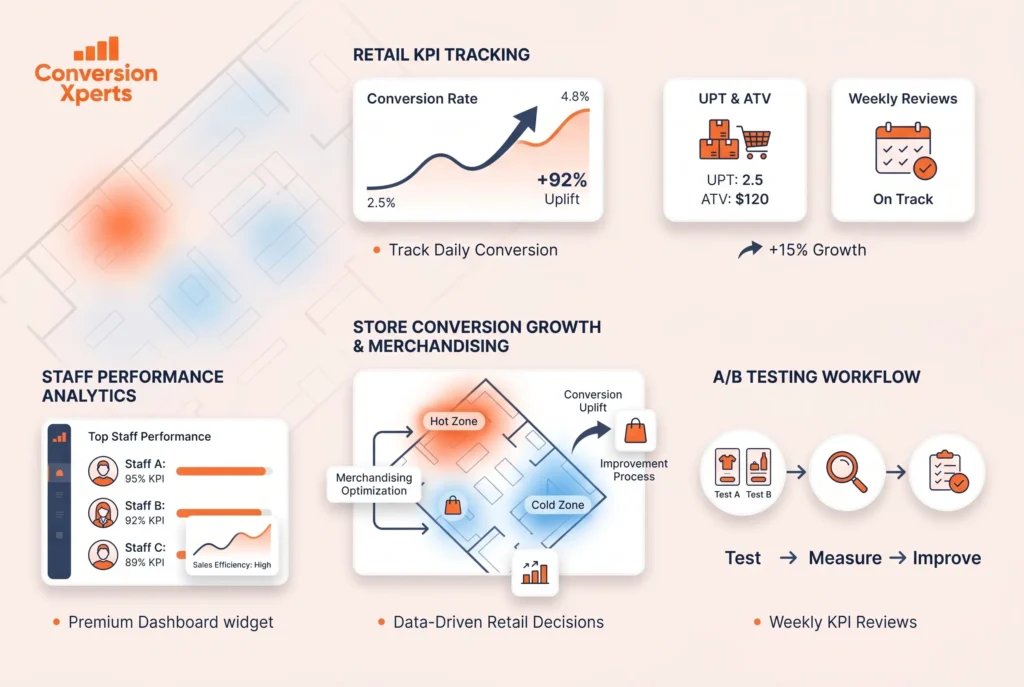
The core metric is your overall store conversion rate, tracked daily, weekly, and monthly. But conversion rate alone tells only part of the story. You also need to track units per transaction (UPT), which measures how effectively your merchandising and staff are driving multi-item purchases, and average transaction value (ATV), which measures whether your cross-sell and upsell initiatives are working.
These three metrics together give a complete picture of your store’s selling health. A retailer with a rising conversion rate but falling ATV may be capturing more buyers but losing on basket size, which could indicate overly aggressive discounting is driving conversion at the expense of margin.
Conversion Rate by Staff Member
This is a metric that many retailers avoid because it feels uncomfortable, but it is one of the most actionable data points available. When you combine POS transaction data with staff login records, you can calculate the conversion rate for each associate during their floor shifts. The spread between your top-performing associate and your average associate is almost always substantial, and it represents a training and coaching opportunity, not a performance management threat.
Retailers who share individual conversion data transparently, celebrate top performers, and use peer coaching between high and average performers consistently see floor-wide conversion improvements of 6% to 10% within 60 days.
A/B Testing Store Layout and Merchandising Changes
Every layout change, signage update, or promotion should be treated as a testable hypothesis. The most rigorous approach is to make a single change at a time, measure conversion rate for two to four weeks following the change against the same period in the prior year (to control for seasonality), and record the result before making the next change.
This discipline prevents the common retail mistake of making five simultaneous changes, seeing a conversion improvement, and having no idea which change drove the result, making it impossible to replicate or scale.
Weekly Conversion Review Process
Establish a weekly conversion review cadence. This review should cover conversion rate versus prior week and prior year, the highest and lowest converting days and time windows, any unusual traffic patterns that warrant investigation, and one specific action item to test in the coming week.
This process does not need to take more than 30 minutes. But the consistency of doing it every week, without exception, is what separates retailers who continuously improve from those who plateau