The Complete Guide (2026): Sales Pipeline Metrics
A staggering number of sales teams operate with almost no visibility into why deals actually fall apart. Research from Salesforce found that most sales reps believe they have a healthy pipeline right up until the moment forecasted deals quietly disappear at the end of the quarter. The gap between feeling confident and actually knowing what is happening inside your pipeline almost always comes down to one thing, which is whether you are tracking the right sales pipeline metrics in the first place.
Most sales leaders track revenue and little else. That is a mistake. Revenue is a lagging indicator, meaning it tells you what already happened, not what is about to happen. Sales pipeline metrics, when tracked properly, give you a leading view of your business, showing you exactly where deals are getting stuck, which reps need coaching, and whether your forecast can actually be trusted before the quarter ends rather than after.
This guide walks through every metric that matters, why each one matters, how to calculate it, and how to use it to actually fix problems in your sales process rather than just observe them.
By the end of this guide you will understand which sales pipeline metrics to track for your specific business, how to build a simple dashboard that surfaces problems early, common mistakes that quietly distort pipeline data, and a practical framework for turning raw numbers into real coaching conversations with your sales team.
What Are Sales Pipeline Metrics
Sales pipeline metrics are the specific numbers sales teams track to understand the health, velocity, and predictability of their sales process, from the moment a lead enters the pipeline all the way through to a closed deal.
Unlike a simple sales report that shows total revenue for the month, pipeline metrics look at the entire journey a deal takes. They answer questions like how many deals are currently in each stage, how long deals typically sit in each stage before moving forward, what percentage of deals actually close, and how much revenue is realistically expected to close this quarter based on historical patterns rather than optimistic guessing.
Think of your pipeline as a physical assembly line. A factory manager does not just check how many finished products came out the end of the line each day. They check how many units are sitting at each station, how long each station takes, and where bottlenecks are forming. Sales pipeline metrics do exactly the same thing for your revenue engine.
Why Pipeline Metrics Differ From Sales Reports
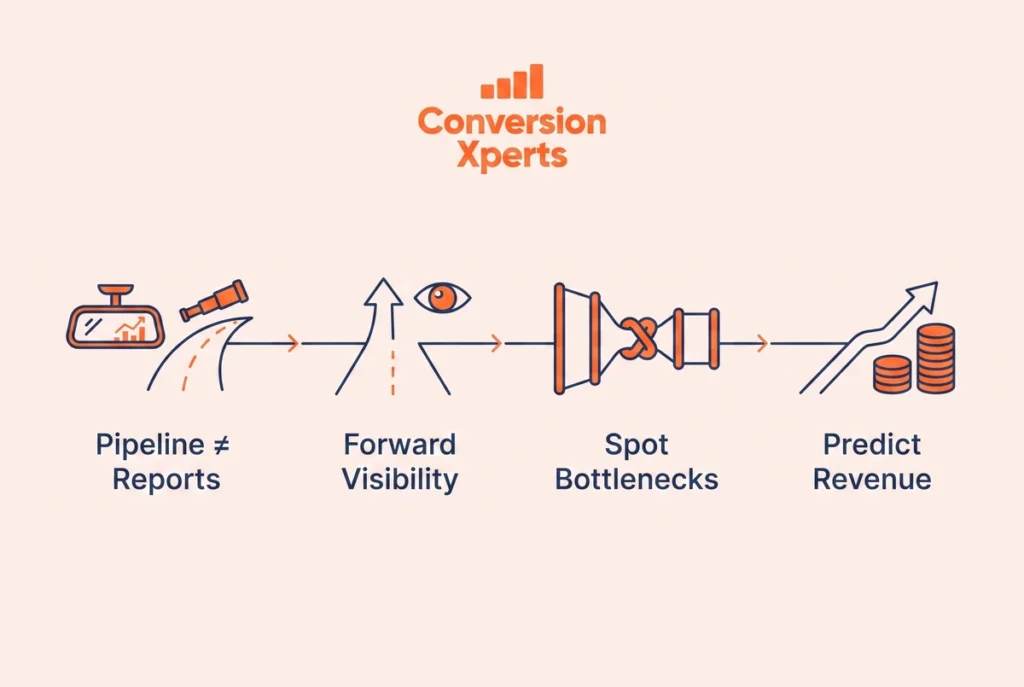
A sales report is typically backward looking. It tells you what closed last month or last quarter. Pipeline metrics are largely forward looking. They tell you what is likely to close next month, which deals are at risk, and where your process is leaking potential revenue before it ever shows up in a report at all.
This distinction matters enormously for planning. A sales leader relying only on closed revenue reports is essentially driving while looking exclusively in the rearview mirror. A sales leader who tracks pipeline metrics properly can see the road ahead and adjust course while there is still time to actually change the outcome.
Why Sales Pipeline Metrics Matter More In 2026

Buyer behavior has changed significantly over the past few years, and sales cycles in most B2B industries have grown longer, not shorter, according to research published by Gartner. Buyers now involve more stakeholders in a purchase decision, do more independent research before ever speaking to a salesperson, and expect a far more personalized experience once they do engage.
This shift means the old approach of simply pushing volume through the top of the funnel and hoping enough deals close no longer works reliably. Sales teams that win consistently in 2026 are the ones who understand precisely where their pipeline is strong and where it is weak, and who use that understanding to have specific, targeted coaching conversations rather than generic motivational ones.
There is also a growing connection between pipeline data and forecasting accuracy that boards and investors now scrutinize closely. A sales leader who can explain exactly why a forecast is reliable, backed by historical conversion rates and stage by stage velocity data, earns far more trust from leadership than one who simply reports a gut feeling number each month.
Finally, the rise of AI powered sales tools has made pipeline metrics more accessible and more powerful than ever. Modern customer relationship management platforms can now flag stalled deals automatically, predict which opportunities are most likely to close, and surface coaching opportunities without a manager having to manually dig through spreadsheets, which means there is genuinely no excuse left for flying blind.
The Core Sales Pipeline Metrics Every Team Should Track
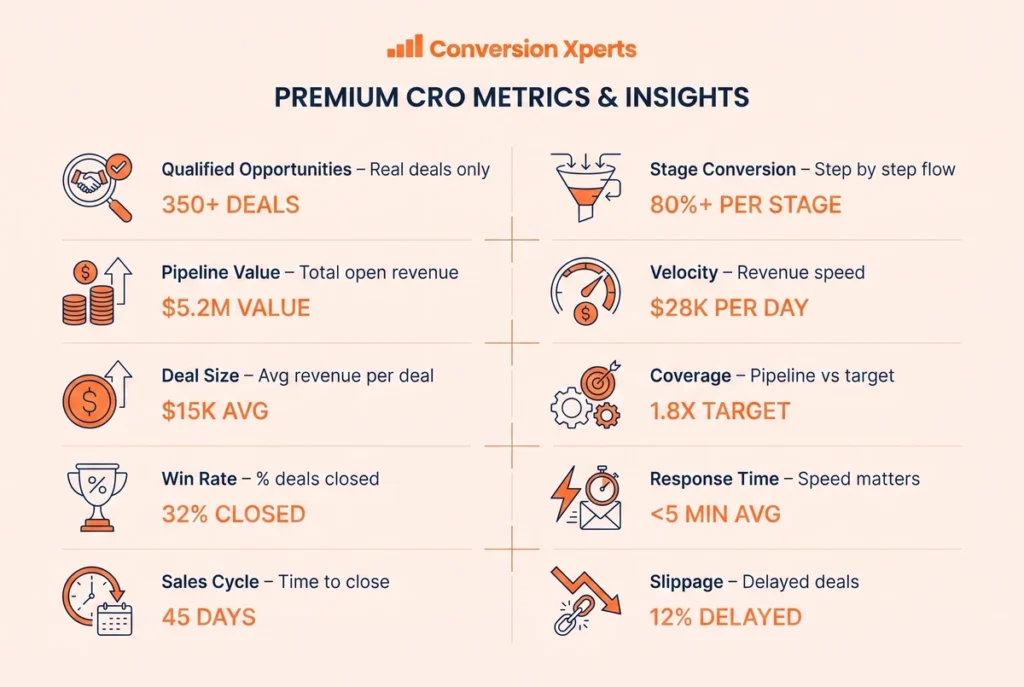
There are dozens of numbers a sales team could theoretically track, but a small handful actually drive meaningful decisions. Here is a breakdown of the metrics that matter most, organized by what question each one answers.
Number Of Qualified Opportunities
This metric simply counts how many deals in your pipeline meet your team’s definition of a qualified opportunity, meaning a lead that has a real budget, a genuine need, decision making authority involved, and a realistic timeline. This is the foundation everything else is built on, since a pipeline full of unqualified leads will produce misleading numbers no matter how carefully you calculate everything downstream.
Pipeline Value
Pipeline value is the total dollar amount of every open opportunity currently in your pipeline. This number alone can be misleading if viewed in isolation, since a pipeline can look impressively large while actually being full of deals that will never close, which is exactly why pipeline value should always be viewed alongside conversion rate rather than by itself.
Average Deal Size
Average deal size tells you the typical dollar value of a closed deal, calculated by dividing total closed revenue by the number of closed deals over a given period. Tracking how this number shifts over time can reveal whether your team is moving upmarket, downmarket, or attracting a different type of customer than before, which has major implications for how many deals you actually need in your pipeline to hit a revenue target.
Win Rate
Win rate is the percentage of qualified opportunities that eventually close as won deals, calculated by dividing the number of closed won deals by the total number of closed deals, both won and lost, over a specific period. This is one of the single most important sales pipeline metrics a team can track, because it directly reveals how effective your sales process actually is at converting genuine interest into revenue.
A win rate that is declining over time, even while pipeline volume stays steady, is often one of the earliest warning signs of a deeper problem, whether that is increased competition, a pricing issue, or a weakening in how reps are qualifying leads at the top of the funnel.
Sales Cycle Length
Sales cycle length measures the average number of days it takes a deal to move from first entering the pipeline to closing, whether won or lost. A lengthening sales cycle usually signals that buyers are facing more internal friction, more competing priorities, or more decision makers involved than before, and it directly affects how far in advance you need to be generating new pipeline to hit future revenue targets.
Stage Conversion Rate
Stage conversion rate looks at the percentage of deals that successfully move from one specific pipeline stage to the next, rather than looking at the pipeline as a single whole. Tracking this stage by stage is where the real diagnostic power of pipeline metrics lives, because it tells you precisely where deals are getting stuck rather than simply telling you that your overall win rate is lower than you would like.
For example, if 80 percent of deals move successfully from initial contact to a scheduled demo, but only 20 percent move from demo to proposal, you know exactly where to focus your coaching and process improvement efforts rather than guessing.
Average Deal Velocity
Deal velocity combines several of the metrics above into a single formula that estimates how much revenue is moving through your pipeline over a given time period. A commonly used formula is number of qualified opportunities multiplied by average deal size multiplied by win rate, divided by average sales cycle length in days. This single number is enormously useful for forecasting, since it essentially tells you your expected daily revenue output based on current pipeline health.
Pipeline Coverage Ratio
Pipeline coverage ratio compares the total value of your open pipeline against your revenue target for a given period, usually expressed as a multiple. Most B2B sales organizations aim for a coverage ratio somewhere between three times and four times their target, meaning if your quarterly revenue goal is 100 thousand dollars, a healthy pipeline should contain roughly 300 to 400 thousand dollars in open opportunities, since not every deal in the pipeline will actually close.
Lead Response Time
This metric tracks how quickly a sales rep follows up after a new lead enters the pipeline. Research from InsideSales found that the odds of qualifying a lead drop dramatically once response time stretches beyond the first few minutes after initial contact. Tracking this metric closely often reveals a surprisingly simple fix for a struggling pipeline, since slow follow up can quietly kill deals before a rep even realizes an opportunity existed.
Deal Slippage Rate
Deal slippage rate measures how often deals that were forecasted to close in a specific period instead push into a later period. A high slippage rate is one of the clearest signals that either your sales process has a structural problem or that reps are being overly optimistic when they log expected close dates, both of which are worth investigating separately.
How To Build A Sales Pipeline Metrics Dashboard
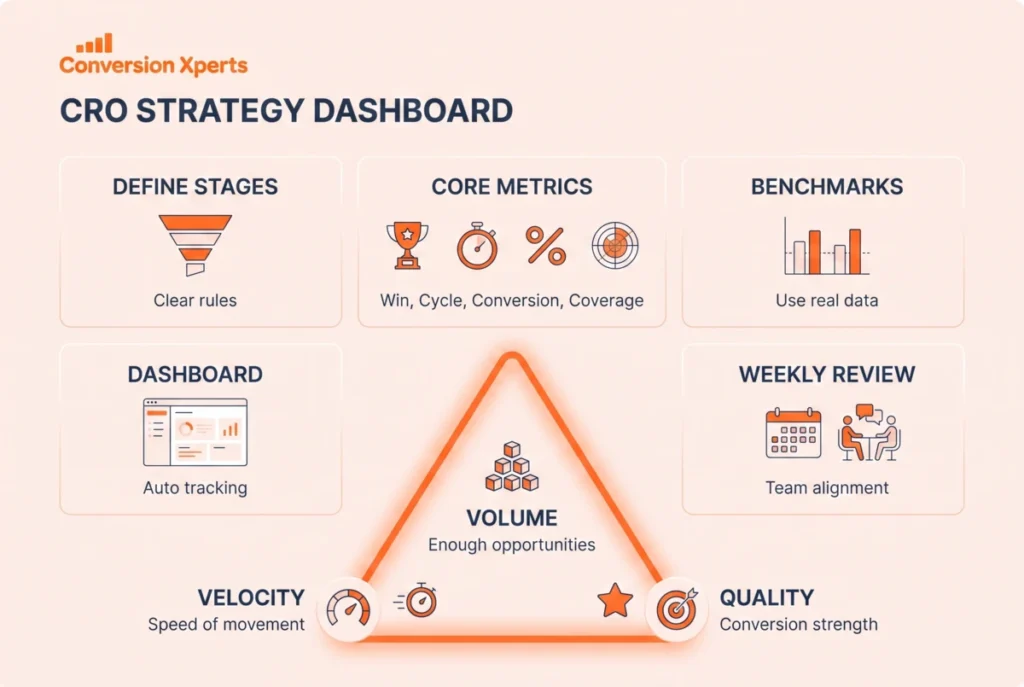
Tracking these numbers manually in a spreadsheet is possible for a very small team, but most organizations benefit enormously from building a proper dashboard inside their customer relationship management system. Here is a practical, step by step approach to building one.
First, define your pipeline stages clearly, ensuring every rep on the team agrees on what specifically qualifies a deal to move from one stage to the next. Vague or inconsistent stage definitions are one of the most common reasons pipeline metrics end up unreliable, since different reps will otherwise classify similar deals completely differently.
Second, choose your core metrics rather than trying to track everything at once. A useful starting set includes win rate, average sales cycle length, stage conversion rate, and pipeline coverage ratio, since these four alone will surface most major problems without overwhelming your team with numbers nobody actually looks at.
Third, set a realistic benchmark for each metric based on your own historical data rather than an industry average pulled from a blog post, since sales cycles and win rates vary enormously between industries and even between individual product lines within the same company.
Fourth, build a simple visual dashboard, whether inside your customer relationship management platform or a dedicated reporting tool, that surfaces these numbers automatically rather than requiring someone to calculate them by hand every week.
Fifth, review the dashboard on a consistent weekly cadence with your sales team, treating it as a coaching tool rather than a scorecard used to criticize individual reps, since a dashboard that feels punitive will quickly get ignored or, worse, gamed with inaccurate data entry.
The Pipeline Health Triangle Framework
Here is an original framework worth using whenever you review your own pipeline metrics. Picture three points forming a triangle, with each point representing a different dimension of pipeline health.
The first point is volume, meaning whether enough qualified opportunities are entering the pipeline in the first place. The second point is velocity, meaning how quickly those opportunities are moving through each stage toward a decision. The third point is quality, meaning what percentage of those opportunities actually convert into closed revenue rather than stalling or falling through.
A pipeline can look healthy on any single point of this triangle while still being fundamentally broken. A team with strong volume and strong velocity but weak quality is closing deals quickly but losing most of them, which usually points to a qualification problem at the top of the funnel. A team with strong quality but weak volume is winning most of the deals they pursue but simply is not generating enough opportunities to hit their revenue target. Reviewing all three points together, rather than any single metric in isolation, is what actually reveals the true state of a pipeline.
Best Tools For Tracking Sales Pipeline Metrics
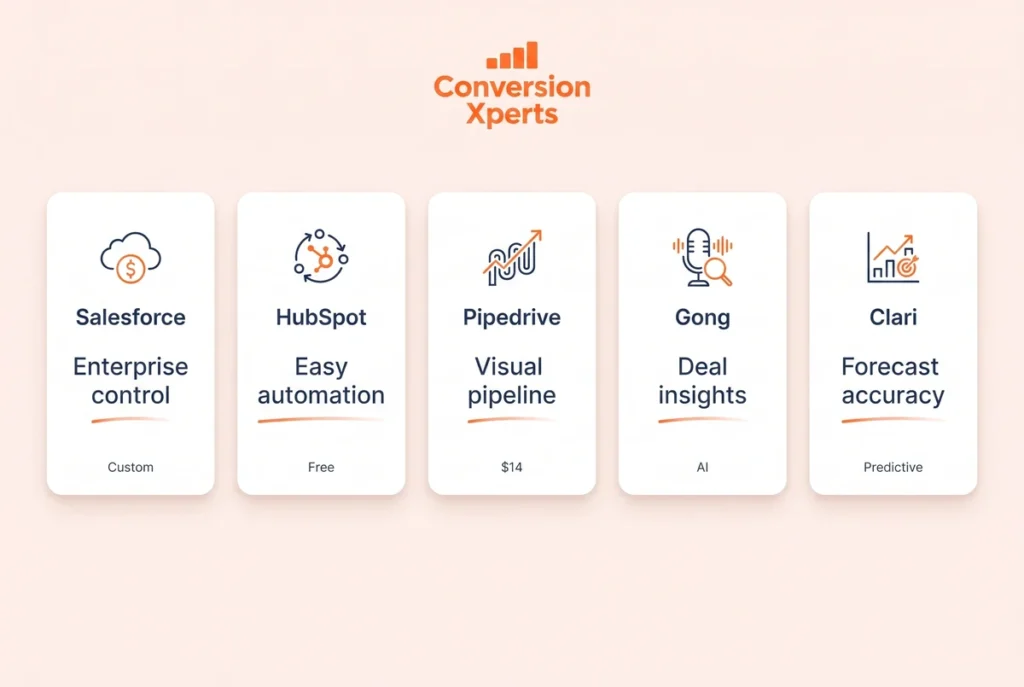
| Tool | Best For | Starting Price | Standout Feature |
| Salesforce | Full enterprise pipeline management | Custom pricing | Deep customization and forecasting |
| HubSpot Sales Hub | Small to mid size teams | Free plan available | Built in deal stage automation |
| Pipedrive | Visual pipeline tracking | 14 dollars per user monthly | Simple drag and drop deal board |
| Gong | Conversation and deal intelligence | Custom pricing | AI powered deal risk flags |
| Clari | Revenue forecasting | Custom pricing | Predictive pipeline analytics |
For a deeper comparison of pipeline tracking platforms, G2 maintains an updated ranking based on real user reviews worth checking before choosing a tool (https://www.g2.com/categories/sales-pipeline-management).
Common Sales Pipeline Metrics Mistakes To Avoid
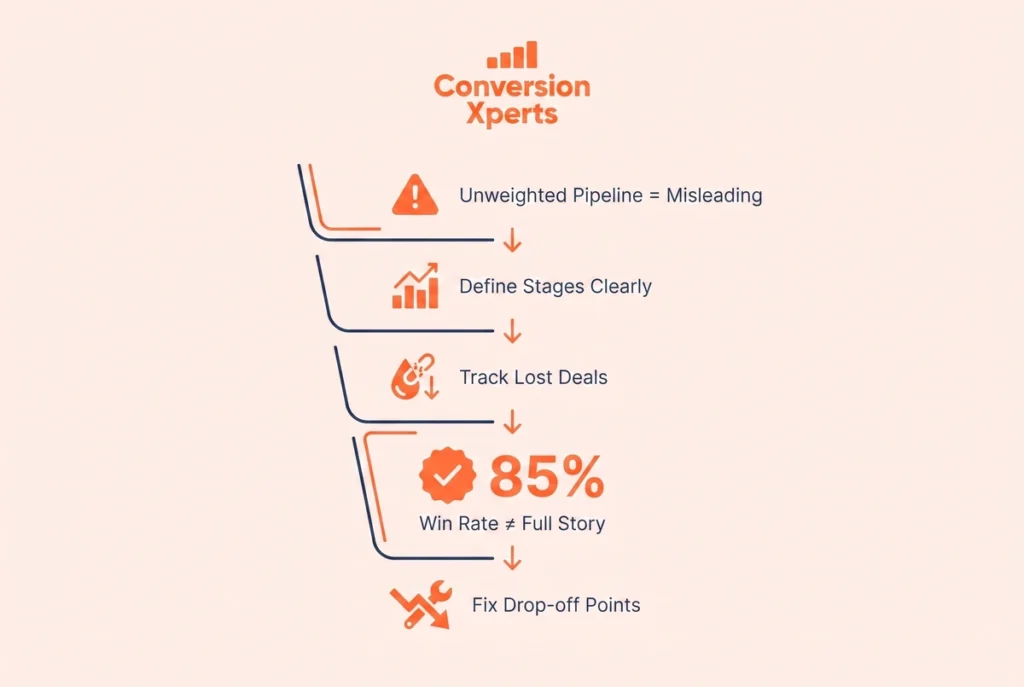
Even experienced sales leaders fall into these traps when tracking sales pipeline metrics, often without realizing the damage it is doing to forecasting accuracy and team performance.
Treating every open deal as equally likely to close is a common and costly mistake, since a deal sitting in early discovery is nowhere near as reliable a revenue signal as one sitting in final contract negotiation. Weighting pipeline value by stage, rather than counting every deal at full face value, produces a far more honest picture of expected revenue.
Allowing inconsistent stage definitions across reps is another frequent problem, where one rep marks a deal as qualified after a single email exchange while another rep waits until a full discovery call has happened, which quietly corrupts every downstream metric built on top of stage data.
Ignoring lost deal data is a mistake many teams make simply because it feels less urgent than tracking wins. Reviewing why deals were lost, and tagging the reason consistently, often reveals patterns that are just as valuable as studying wins, whether that is a recurring objection around pricing, a competitor winning repeatedly, or a specific stage where deals consistently stall before dying.
Focusing exclusively on win rate while ignoring sales cycle length can also mislead a team, since a high win rate paired with an extremely long sales cycle might actually produce less total revenue than a slightly lower win rate paired with a much faster cycle.
Real World Example: A mid sized software company we studied had a healthy looking win rate of 28 percent, which seemed reasonable for their industry. After breaking win rate down by pipeline stage, they discovered that deals were converting well from proposal to close, but an alarming number were dying silently between initial demo and proposal, often after weeks of apparent progress. After introducing a mandatory follow up call within 48 hours of every demo, their demo to proposal conversion rate rose from 34 percent to 52 percent within one quarter.
Sales Pipeline Metrics vs Sales Activity Metrics
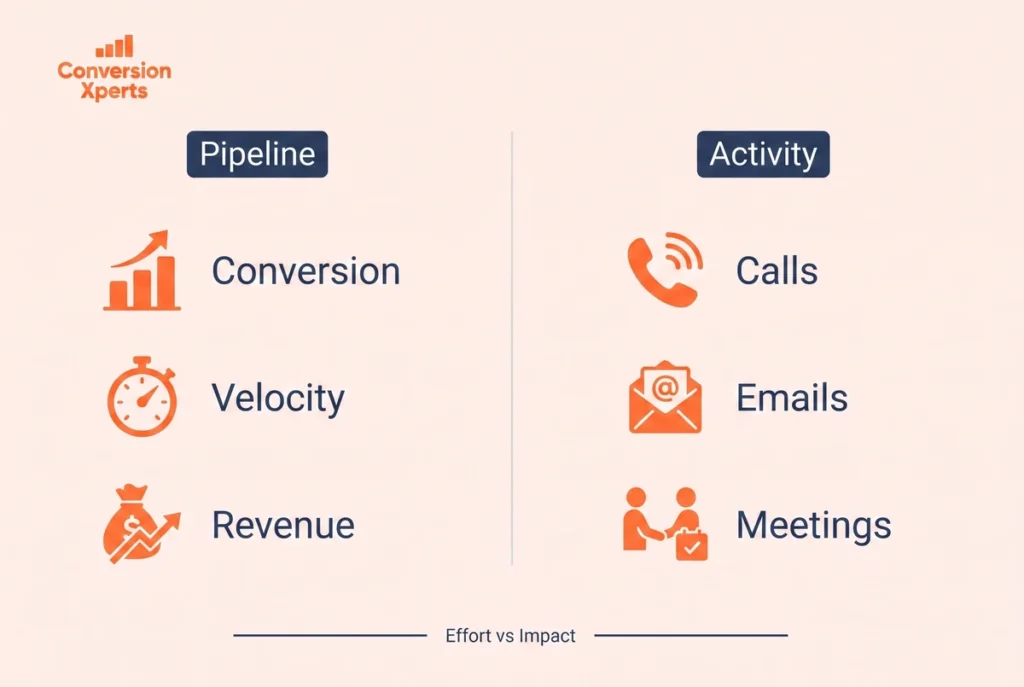
A question sales leaders often ask is whether they should focus on pipeline metrics or activity metrics, such as number of calls made or emails sent. The honest answer is that both matter, but they answer fundamentally different questions and should never be confused with one another.
Activity metrics tell you how hard a rep is working, measuring inputs like calls, emails, and meetings booked. Pipeline metrics tell you how effective that work actually is, measuring outputs like conversion rate and deal velocity. A rep can have outstanding activity numbers while still producing weak pipeline results if their conversations are not moving deals forward effectively, which is exactly why relying on activity metrics alone can give a false sense of confidence in a team’s performance.
The most effective sales leaders review both together, using activity metrics to understand effort and pipeline metrics to understand impact, since a gap between high activity and low pipeline results usually points directly to a skills or messaging problem worth coaching rather than an effort problem.
Expert Tips To Master Your Sales Pipeline Metrics
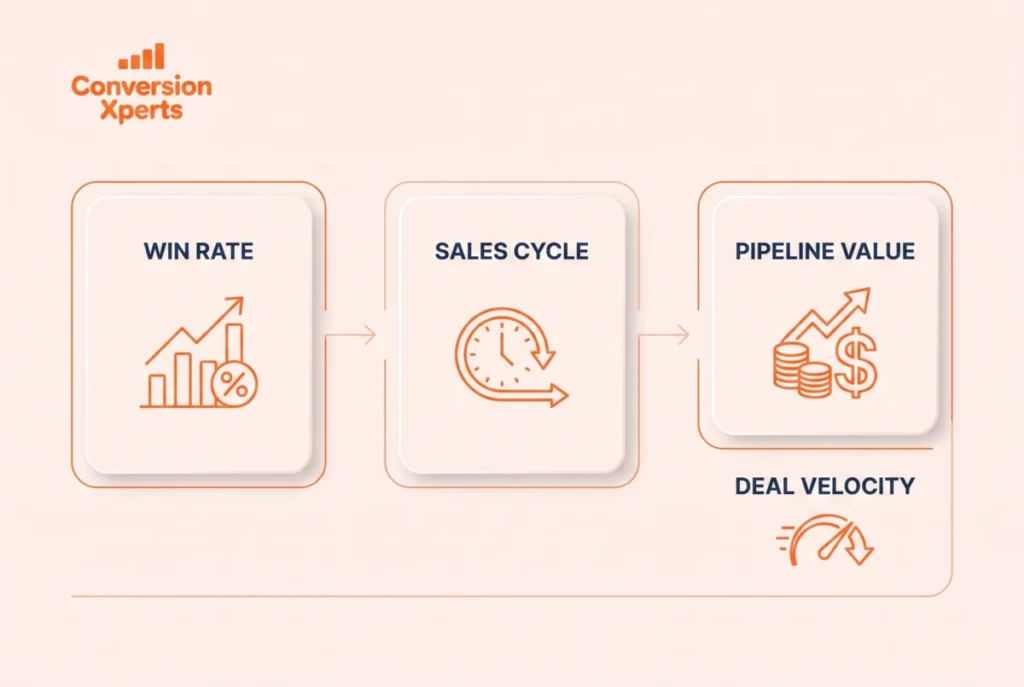
Review your pipeline metrics weekly rather than only at the end of the month or quarter, since problems caught early are far easier to fix than problems discovered only after a forecast has already been missed.
Segment your metrics by rep, by deal source, and by product line whenever possible, since averaging everything into a single company wide number often hides important patterns that only become visible once the data is broken apart.
Pay close attention to deals that have sat in the same stage far longer than your historical average, since these stalled deals are often the earliest warning sign of a problem that has not yet shown up in your overall win rate.
Build a habit of reviewing lost deals with the same rigor you apply to reviewing wins, since understanding why deals are lost is often the fastest path to improving future win rate.
Use pipeline coverage ratio as an early warning system for future quarters rather than only looking at it for the current one, since a thin pipeline for next quarter is a problem you want to catch months in advance, not weeks before the quarter begins.
Real World Example And Case Study
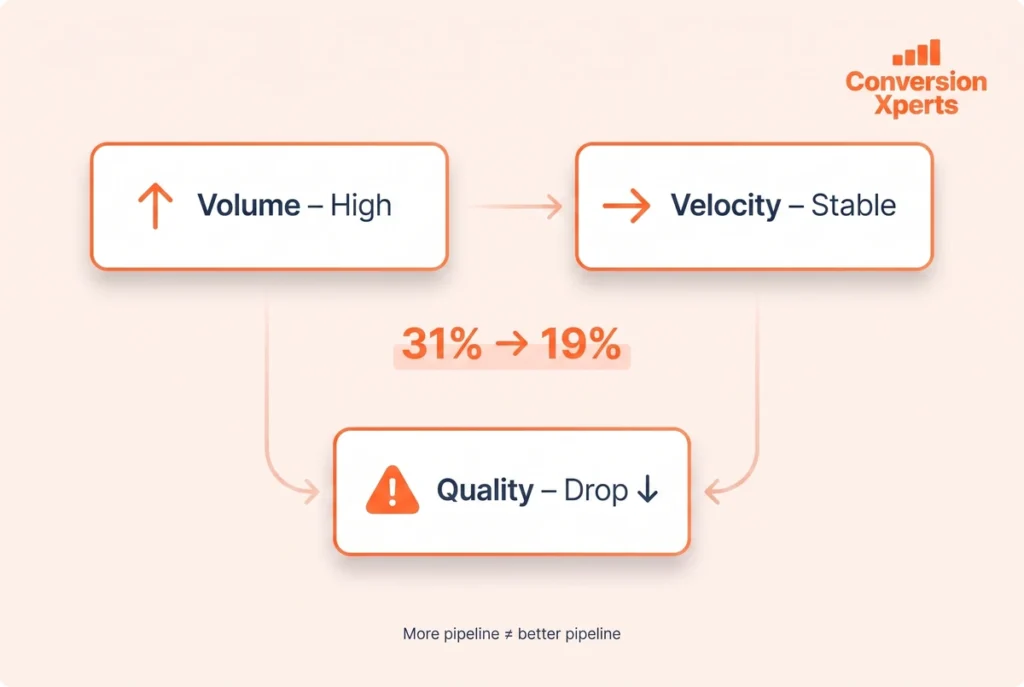
A B2B marketing agency applied the Pipeline Health Triangle Framework described earlier in this guide. Their volume point looked strong, with a steady flow of new qualified opportunities entering the pipeline each week. Their velocity point also looked reasonable, with deals moving through stages at a fairly consistent pace. However, when they examined their quality point closely, they discovered their win rate had quietly dropped from 31 percent to 19 percent over two quarters without anyone noticing, since total pipeline value had actually grown during the same period, masking the underlying problem.
After digging into stage conversion data specifically, they found the drop was concentrated almost entirely in deals sourced from one particular marketing channel, which was generating leads that looked qualified on paper but were consistently a poor fit for their actual service offering. After tightening qualification criteria for leads from that specific channel, their overall win rate recovered to 27 percent within two months, even though total pipeline volume decreased slightly during that same period.
This example illustrates a broader lesson that applies across nearly every business, which is that a growing pipeline is not automatically a healthy one, and only by breaking sales pipeline metrics apart by stage, source, and rep can the real story underneath the top line numbers actually be seen clearly.
How To Turn Pipeline Metrics Into Coaching Conversations
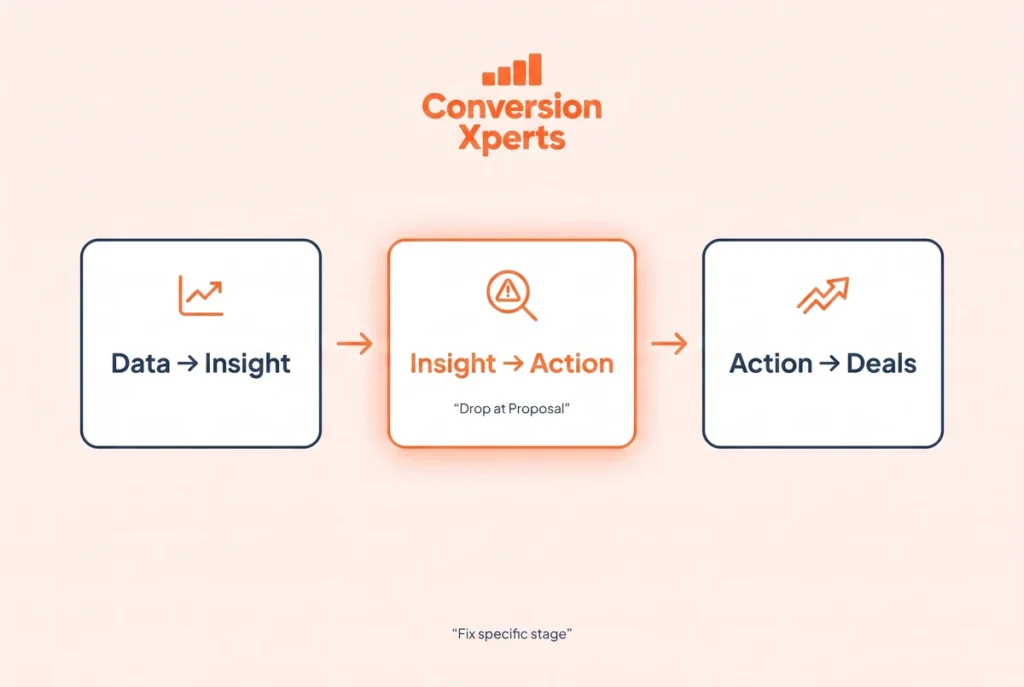
Collecting sales pipeline metrics is only valuable if those numbers actually change how a sales team operates day to day. The most effective sales leaders use pipeline data as the starting point for specific, targeted coaching conversations rather than generic team wide pep talks.
Instead of telling a rep their numbers need to improve, a manager reviewing stage conversion data might notice that a specific rep consistently loses deals between the proposal stage and the close stage, while performing well in every earlier stage. That specific insight allows for a focused coaching conversation around negotiation skills or handling final objections, rather than a vague conversation about working harder, which rarely produces meaningful improvement.
Similarly, a manager who notices sales cycle length creeping upward across the entire team might investigate whether a recent product change, pricing update, or competitive shift is introducing new friction into the buying process, allowing the whole team to address a structural issue together rather than each rep quietly struggling with it alone.
This is ultimately the real purpose of tracking sales pipeline metrics in the first place. The numbers themselves do not close deals. What closes deals is the specific, informed action a sales team takes once those numbers reveal exactly where the real problem is hiding.