Lead to Opportunity Conversion Rate: The Complete Guide to Formula, Benchmarks, and Proven Ways to Improve It
What Is Lead to Opportunity Conversion Rate
Lead to opportunity conversion rate is the percentage of leads that advance into an active sales opportunity within a defined period. It sits at the exact point where marketing hands a prospect over to sales, and it tells you whether the people your campaigns attract are actually worth pursuing.
A lead is anyone who has shown interest, such as filling out a form, requesting a demo, downloading a resource, or starting a free trial. An opportunity is a qualified prospect that a sales rep believes has a genuine chance of buying, usually because there is a confirmed budget, a clear need, an identified decision maker, and a realistic timeline. The gap between those two states is where most revenue teams lose visibility, and it is exactly why this metric matters so much.
Unlike a simple lead conversion rate, which can stretch all the way to a closed deal, lead to opportunity conversion rate isolates one specific transition. It answers a narrower and more useful question: out of everyone who raised their hand, how many were actually good enough to move forward.
Why Lead to Opportunity Conversion Rate Matters
This single number reveals more about the health of your revenue engine than almost any other metric in the funnel.
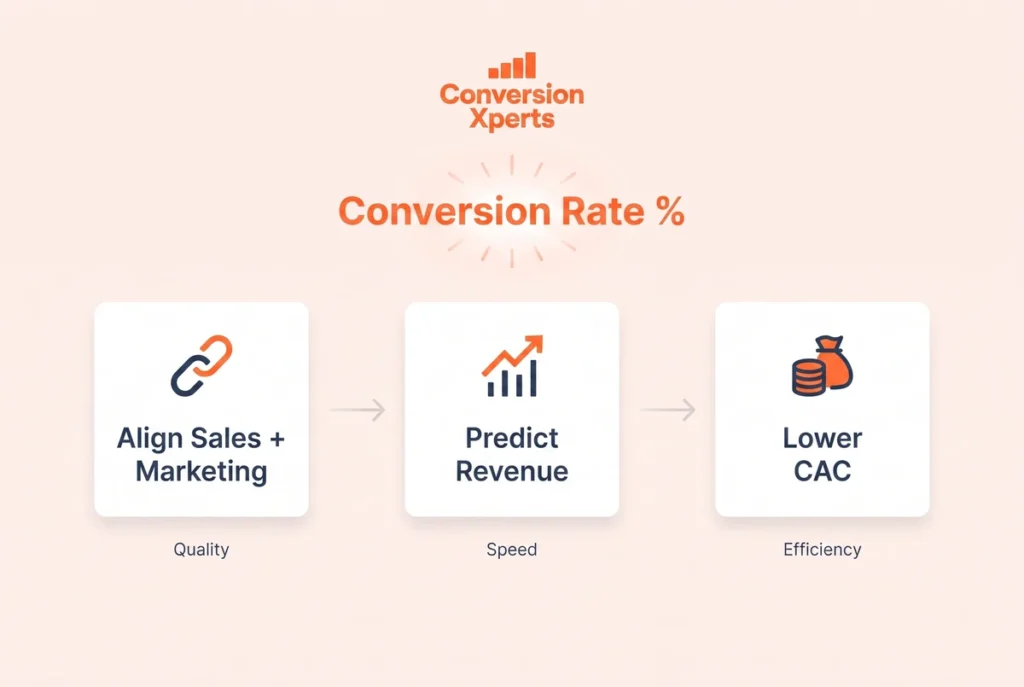
It shows whether marketing and sales are actually aligned. When marketing floods the pipeline with unqualified contacts, this rate drops even if total lead volume looks impressive on a dashboard. It also shows whether your sales team is following up quickly enough and asking the right qualifying questions, since slow response times and weak discovery calls both suppress the number.
It feeds directly into revenue forecasting. If you know your average lead to opportunity conversion rate and your average opportunity to close rate, you can calculate almost exactly how many leads marketing needs to generate to hit a pipeline target. Get this number wrong and every revenue projection built on top of it will be wrong too.
Finally, it exposes cost efficiency. A team that converts twelve percent of leads into opportunities is spending far less to fill the pipeline than a team converting six percent, even if both teams generate the same number of raw leads. Improving this rate by even a few points can lower customer acquisition cost meaningfully without spending another dollar on advertising.
Lead to Opportunity Conversion Rate Formula
The formula is straightforward.
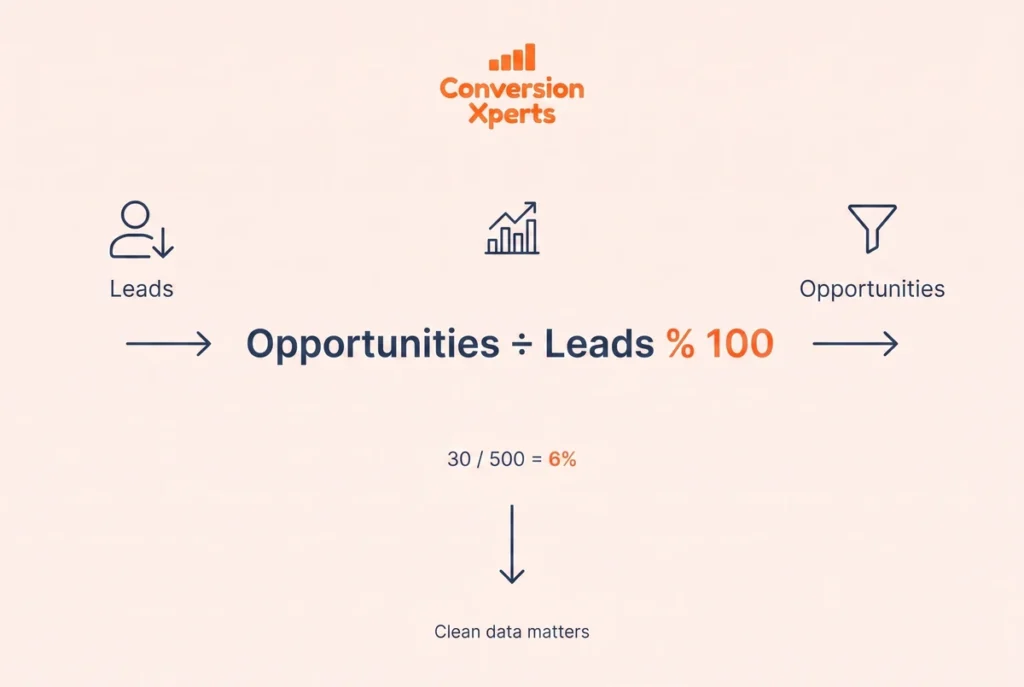
Lead to Opportunity Conversion Rate = (Number of Opportunities Created ÷ Total Number of Leads) x 100
For example, if your team generated five hundred leads in a quarter and thirty of those leads were converted into qualified opportunities, the calculation looks like this:
30 ÷ 500 = 0.06, multiplied by 100 equals a six percent lead to opportunity conversion rate.
The math itself is simple. The hard part, and the part most articles on this topic skip, is agreeing on what actually counts as a lead and what actually counts as an opportunity. If marketing counts a webinar registrant as a lead while sales only counts someone who replied to an email, you get two completely different realities living inside the same spreadsheet. Before you trust this number, make sure both teams are measuring the same thing.
It is also worth cleaning your denominator before you calculate anything. Bounced emails, spam form fills, and duplicate contacts inflate the total lead count and quietly drag your conversion rate down. A rate that looks like a performance problem is sometimes really a data quality problem in disguise.
Lead to Opportunity Conversion Rate Benchmarks for 2026
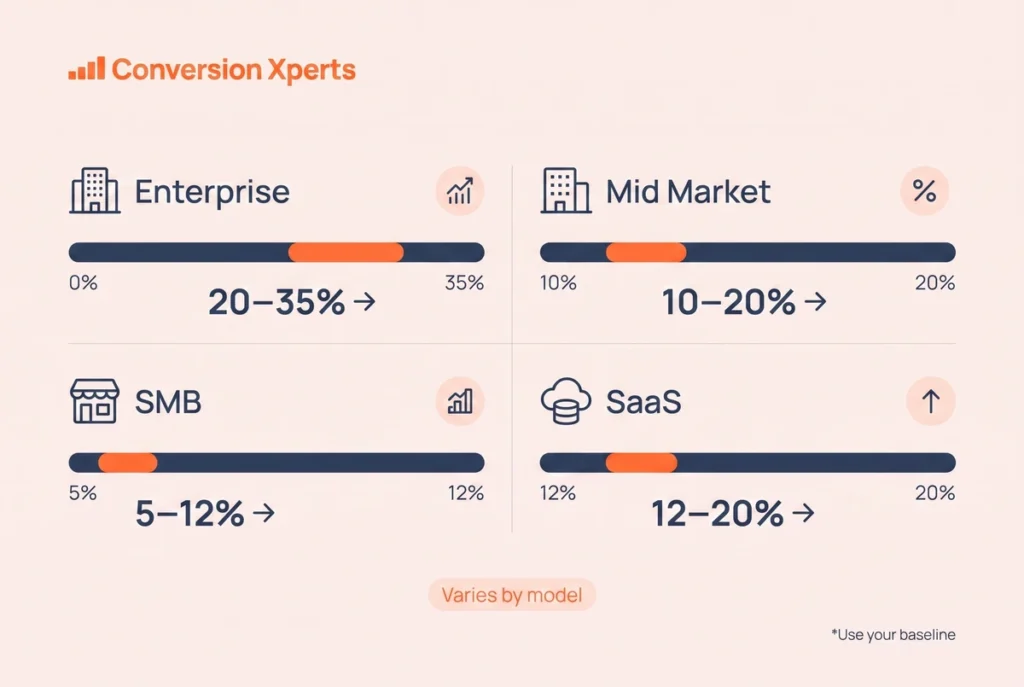
There is no single universal benchmark, because it depends heavily on deal size, sales cycle length, industry, and how strictly a company defines a qualified lead. That said, current data points to a general range worth using as a directional guide rather than a strict target.
| Segment | Typical Lead to Opportunity Conversion Rate |
Enterprise deals | 20 to 35 percent |
Mid market | 10 to 20 percent |
Small and mid sized business | 5 to 12 percent |
B2B SaaS overall | 12 to 20 percent |
Product led growth trial to opportunity | 25 to 35 percent |
Professional services | 20 to 30 percent |
Manufacturing | 8 to 15 percent |
Financial services | 15 to 25 percent |
Overall B2B blended average | 5 to 15 percent |
Several sources point out that the commonly repeated figure of twelve to thirteen percent traces back to an old industry report and should not be treated as gospel. Real world numbers vary widely by company. The more useful exercise is establishing your own historical baseline and tracking improvement over time rather than chasing an arbitrary industry figure that may not reflect your buyer, your deal size, or your sales motion.
One detail worth calling out that most guides overlook is cohort window length. Measuring a nine month enterprise sales cycle against a thirty day window will make your conversion rate look artificially low, and teams sometimes panic and change strategy based on numbers that simply have not had time to mature. Small business motions typically need a thirty to sixty day cohort window, mid market needs sixty to one hundred twenty days, and enterprise motions often need ninety to one hundred eighty days or longer before the rate stabilizes.
Factors That Influence Your Conversion Rate
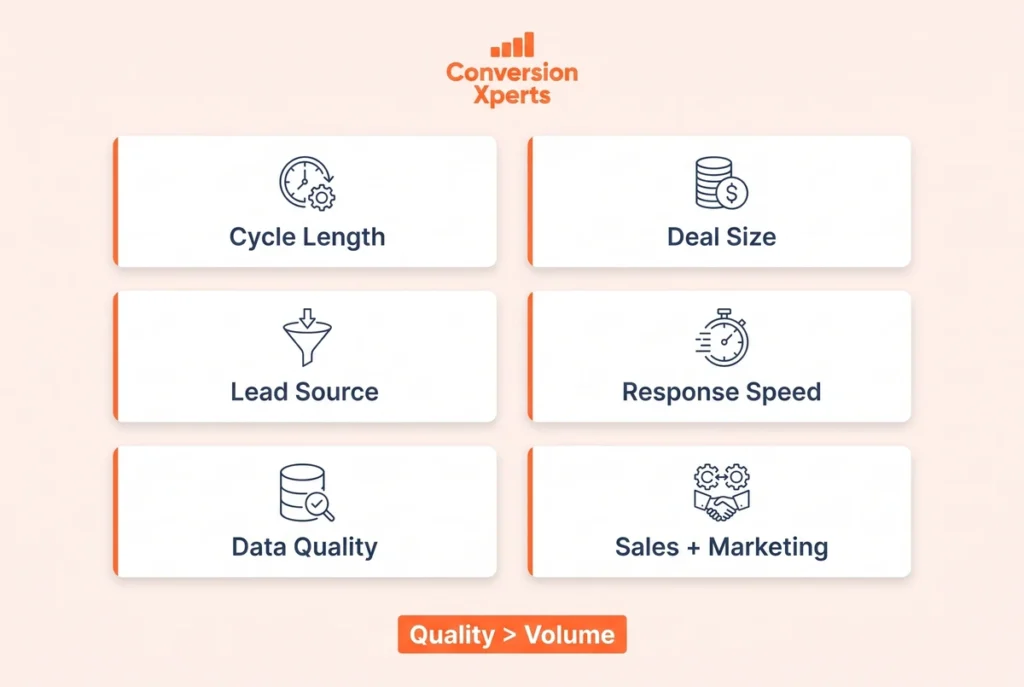
A handful of variables consistently move this number up or down.
Sales cycle length plays a major role. Longer cycles naturally produce lower conversion rates at any single point in time, simply because more of the pipeline is still in motion when you measure it.
Deal size and complexity matter too. Larger deals involve more stakeholders and more scrutiny before anyone is willing to call it a real opportunity, which naturally slows the rate at which leads qualify.
Lead source quality has an outsized effect. Inbound leads who found you through search or referral typically convert far better than cold outbound contacts, because intent already exists before the first conversation happens.
Response speed is one of the most controllable levers available. Leads contacted within the first hour are dramatically more likely to qualify than leads contacted a day later, and a large share of inbound leads never get contacted at all, which is one of the simplest and most fixable leaks in most funnels.
Data quality and firmographic accuracy quietly shape everything downstream. If your contact data is wrong, your sales team cannot reach the right person, and no amount of process improvement will fix a phone number that no longer works.
Alignment between marketing and sales on the definition of a qualified lead is the factor that ties everything together. Without a shared definition, the two teams are technically working from different funnels even though they think they share one.
How to Improve Lead to Opportunity Conversion Rate
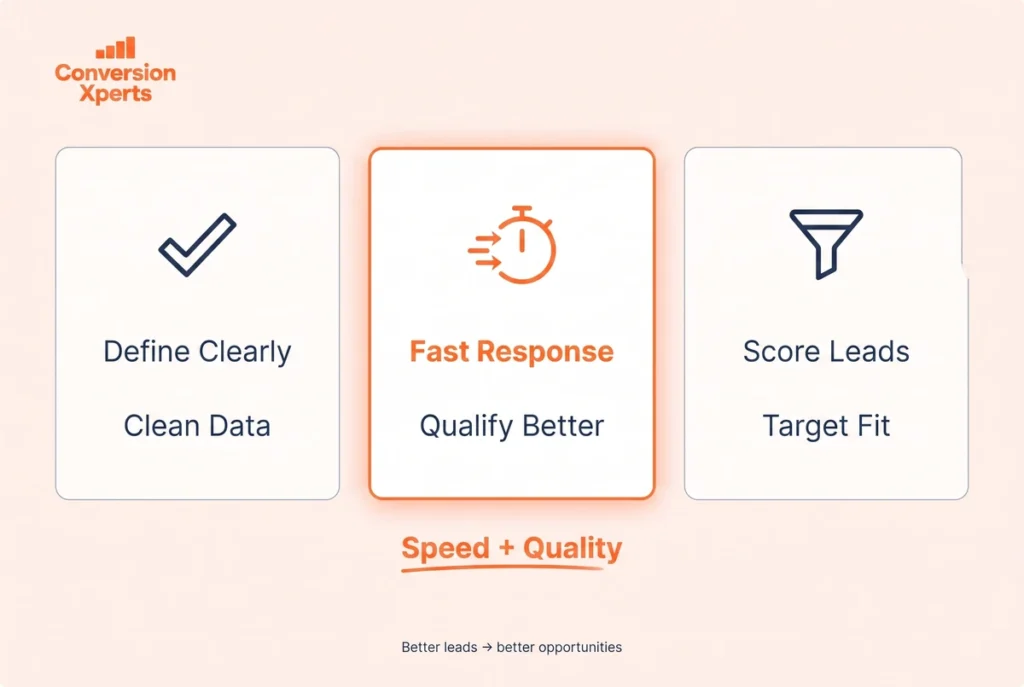
Write down a shared definition of a lead and an opportunity
Get marketing and sales leadership in a room and agree, in writing, on what qualifies as a lead, a marketing qualified lead, and an opportunity. Revisit that definition quarterly. Teams that skip this step consistently end up in finger pointing cycles where marketing insists the leads were good and sales insists they were not, with no shared vocabulary to resolve the disagreement.
Clean your lead data before you measure anything
Remove bounced emails, spam submissions, and duplicate records from your total lead count. A dirty denominator makes a healthy funnel look broken and can send teams chasing the wrong fix entirely.
Shorten response time to minutes, not days
Route new leads instantly and set a service level agreement for first contact, ideally within the first hour. Speed to lead is one of the highest leverage, lowest cost improvements available, and the data consistently shows faster follow up produces dramatically higher qualification rates.
Use a structured qualification framework
Frameworks like BANT, which stands for Budget, Authority, Need, and Timeline, work well for fast, high volume, lower value deals. MEDDIC, which stands for Metrics, Economic Buyer, Decision Criteria, Decision Process, Identify Pain, and Champion, works better for complex enterprise deals with multiple stakeholders. Many high performing teams run both, using a lightweight framework for the first call and a deeper one once a lead shows real promise. A structured framework prevents reps from converting leads too early just to hit activity targets, which inflates the pipeline with deals that were never really qualified.
Build a lead scoring model
Score leads based on firmographic fit and behavioral signals such as pages visited, content downloaded, or product usage during a trial. This helps sales prioritize the contacts most likely to convert instead of treating every lead the same way.
Improve targeting and ideal customer profile fit
A wider net brings in more raw leads but usually lowers the conversion rate, because many of those contacts were never a fit in the first place. Narrowing campaigns toward your ideal customer profile often produces fewer total leads but a meaningfully higher percentage that turn into real opportunities.
Strengthen the handoff between marketing and sales
Standardize what information travels with a lead when it moves to sales, including source, engagement history, and any context gathered during nurturing. A poor handoff forces reps to repeat discovery questions the prospect already answered, which damages trust and slows qualification.
Require a reason for every disqualification
When a rep decides a lead is not a fit, ask them to document why. This creates a feedback loop that helps marketing understand which campaigns and channels produce genuinely qualified leads versus ones that only look good on a volume report.
Nurture leads that are not ready yet instead of discarding them
Not every lead is ready to become an opportunity the first time you speak with them. A structured nurture sequence keeps the relationship warm and can bring a meaningful share of those contacts back into the pipeline once timing improves.
Common Mistakes That Distort This Metric
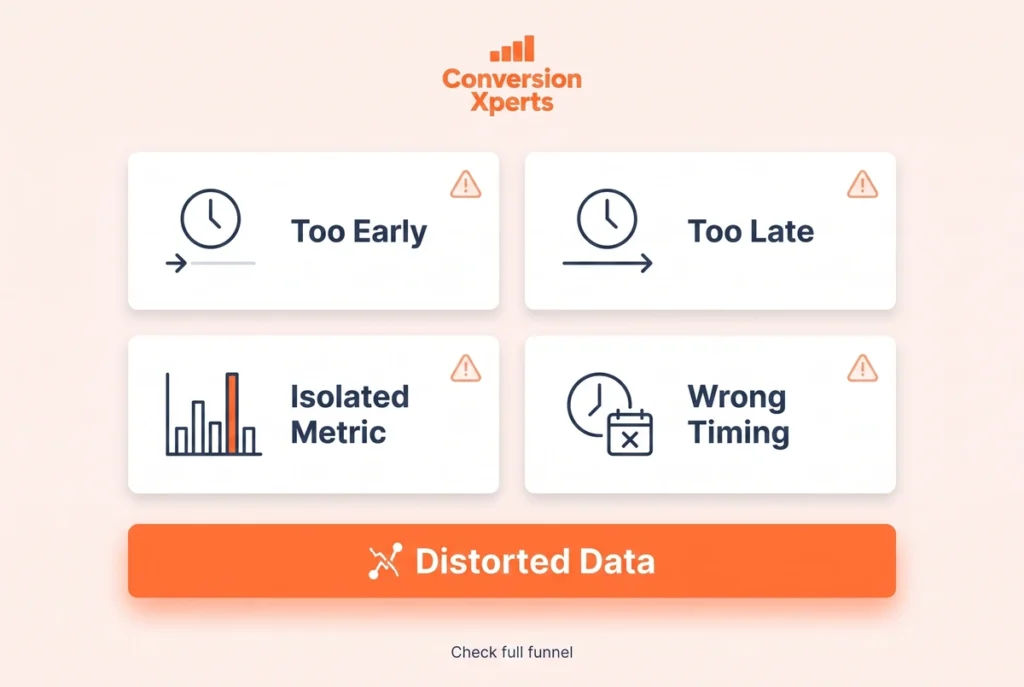
A few habits quietly corrupt the accuracy of lead to opportunity conversion rate.
Converting leads too early to hit activity quotas is one of the most common. Reps sometimes flip a lead to opportunity status before qualification is actually complete, which inflates the pipeline with deals that were never real and eventually collapses forecast accuracy.
Converting leads too late is the opposite problem. Overly strict qualification criteria or a slow handoff between marketing and sales can cause genuinely good leads to sit untouched while a faster competitor closes the deal first.
Measuring the metric in isolation is another trap. A high lead to opportunity conversion rate paired with a low win rate further down the funnel usually means the bottleneck simply moved, not that it disappeared. Always look at this number alongside win rate and sales cycle length, not on its own.
Ignoring cohort timing is a subtle but common error. Judging a long enterprise cycle against a short measurement window produces a number that looks far worse than reality and can trigger unnecessary strategy changes.
Related Metrics Worth Tracking Alongside This One
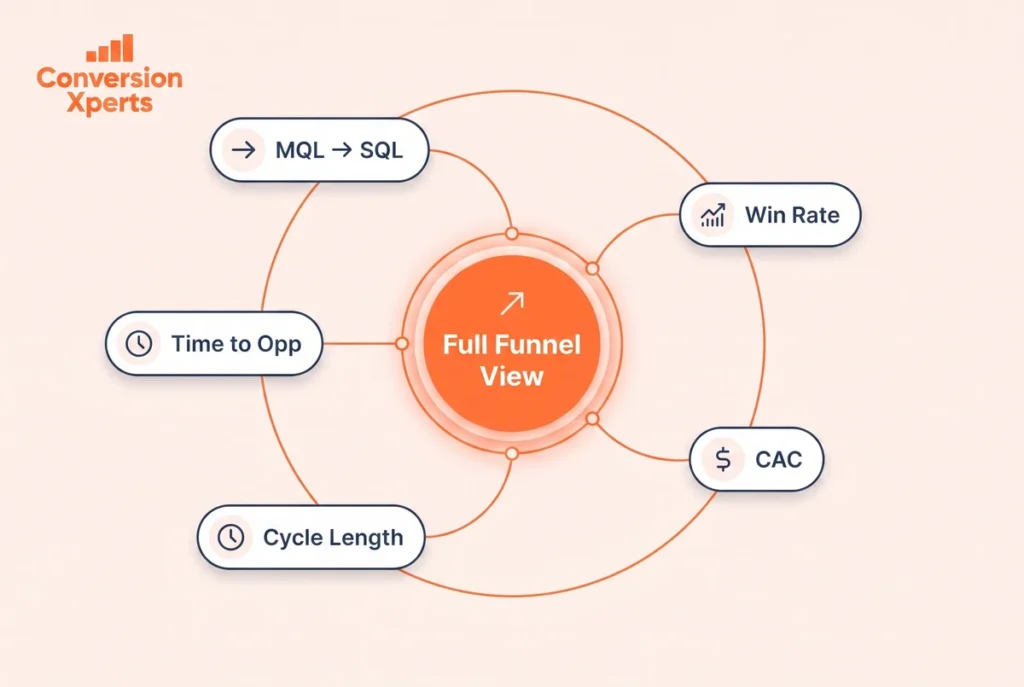
Lead to opportunity conversion rate tells a fuller story when it sits next to a few companion metrics.
MQL to SQL conversion rate shows how well marketing qualified leads hold up once sales engages with them directly. Opportunity to close or win rate shows how many of your qualified opportunities actually turn into revenue. Average sales cycle length shows how long it takes an opportunity to move from creation to close. Customer acquisition cost shows what it actually costs to generate each new customer once you account for the entire funnel, not just the top of it. Time to opportunity, meaning the median number of days between a lead entering your system and becoming an opportunity, reveals how quickly your process actually moves.
Tracking these together, rather than any single number in isolation, gives revenue leaders a genuinely accurate picture of pipeline health.