Cost of Conversion Formula: The Complete 2026 Guide for Ecommerce Brands
What Is the Cost of Conversion Formula
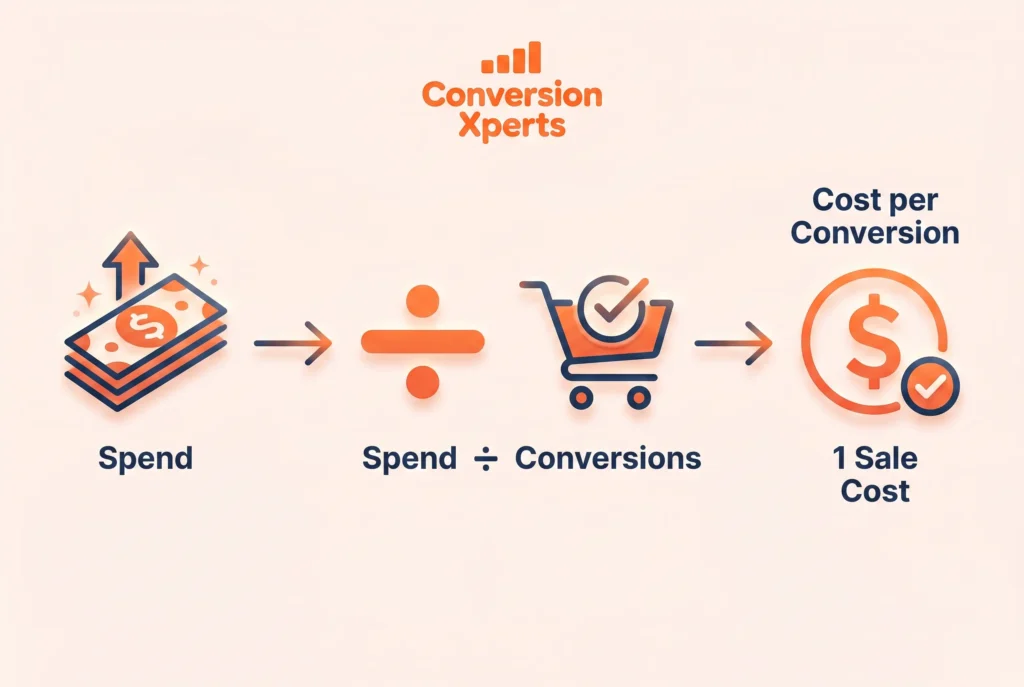
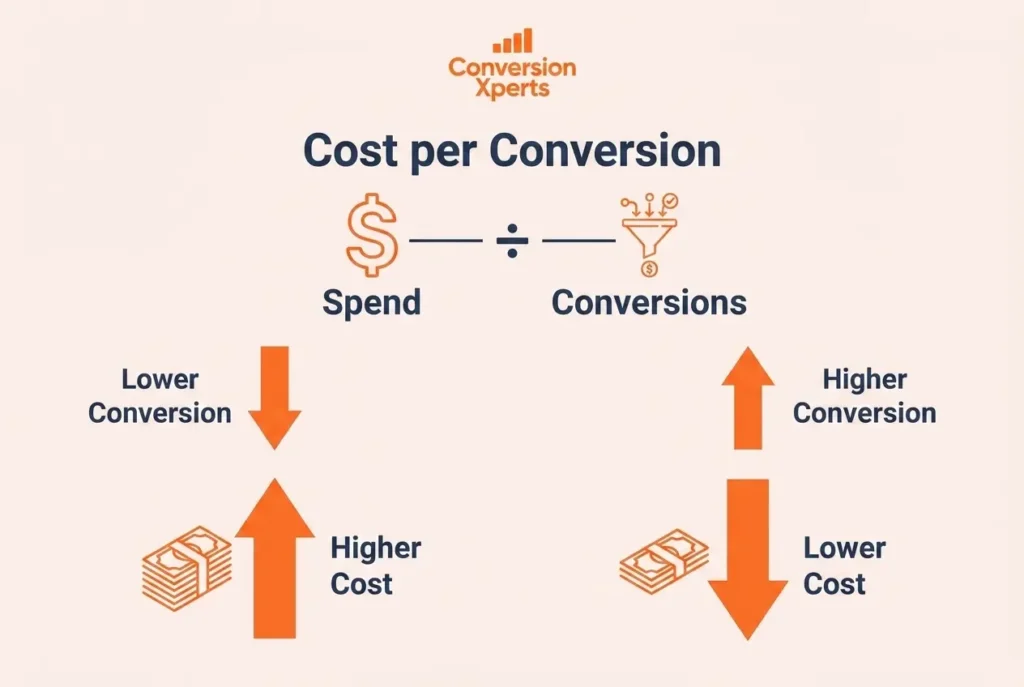
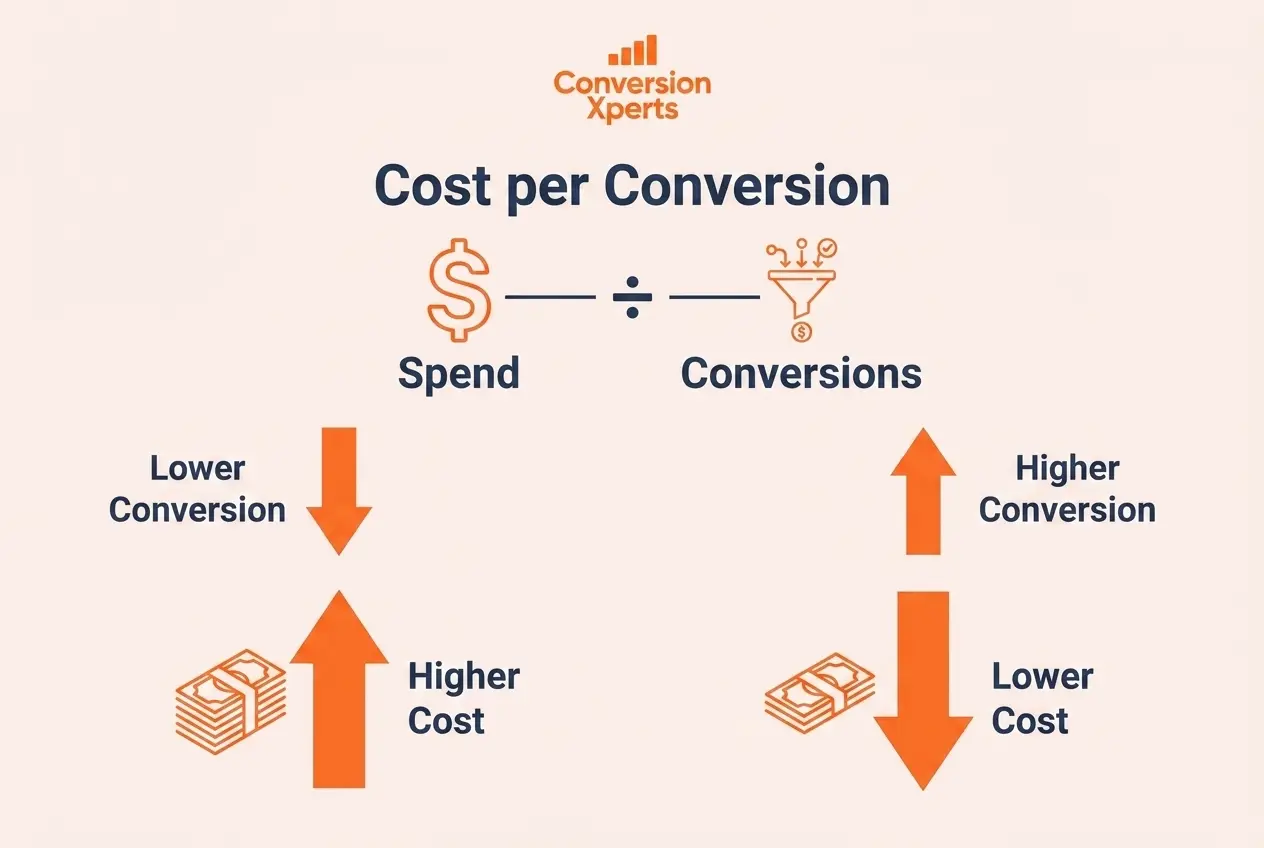
The cost of conversion formula is defined as total marketing spend divided by total number of conversions generated in the same period. It tells you, in plain dollars, what it cost your business to produce one sale, beyond the cost of the product itself.
Written out simply, the formula looks like this. Cost of conversion equals total marketing spend divided by total conversions.
A conversion can mean different things depending on your store, so the first step before using the formula is deciding what counts as a conversion. For most ecommerce brands this means a completed purchase, though some teams also track conversion at the lead stage, such as an email signup or a quiz completion, separately from the sale stage.
This single number, once calculated correctly, becomes the foundation for almost every budget decision a marketing team makes, from which channels deserve more spend to which campaigns need to be paused immediately.
Why the Cost of Conversion Formula Matters in 2026
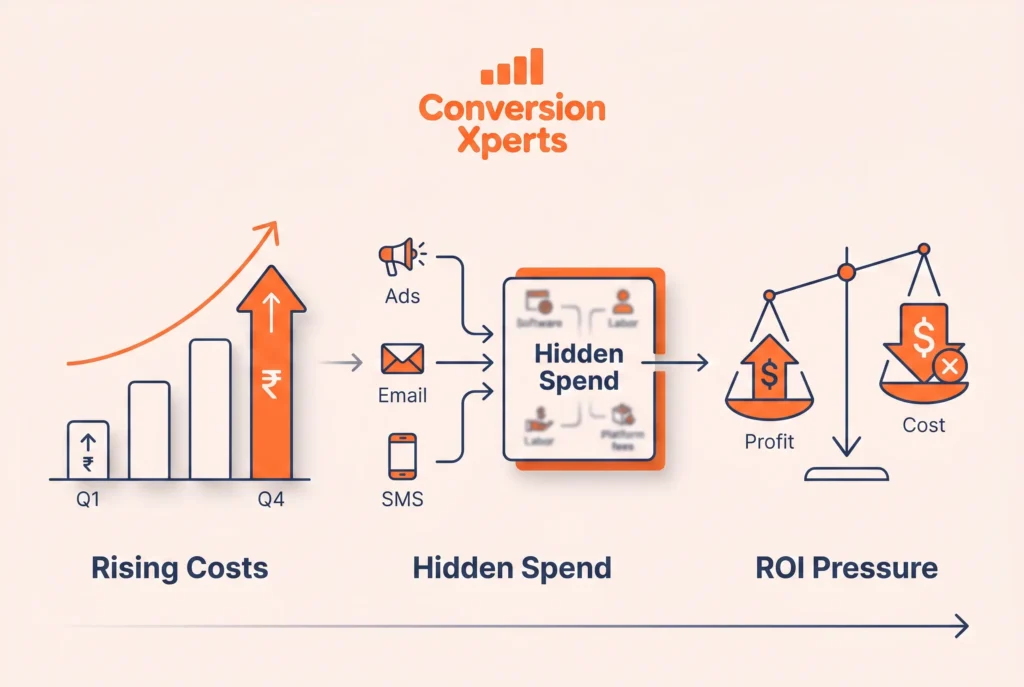
Marketing costs across paid search and paid social have continued climbing through 2026, and privacy related changes on major ad platforms have made it harder to retarget the same shopper repeatedly. This means brands can no longer rely on volume alone. They need to know exactly what each conversion costs and whether that cost still makes financial sense.
There are three specific reasons this formula has become a priority for ecommerce teams this year.
First, with customer acquisition becoming more expensive across nearly every channel, a rising cost of conversion can silently erase profit margin even while total revenue looks healthy.
Second, more shoppers now research across multiple browser tabs before buying, often abandoning a cart on the first visit, which means the cost of conversion calculated only on first touch traffic understates the true cost once follow up emails, retargeting ads, and SMS reminders are included.
Third, finance teams are increasingly asking marketing teams to justify spend in terms of cost per outcome rather than cost per click or cost per impression, making the cost of conversion formula a standard reporting requirement rather than an optional metric.
Pro Tip
Always calculate cost of conversion using fully loaded spend, meaning ad spend plus email platform fees, SMS costs, and any conversion tools like quiz builders or live chat software. Calculating it from ad spend alone almost always understates your real cost per sale.
How to Calculate Cost of Conversion Step by Step
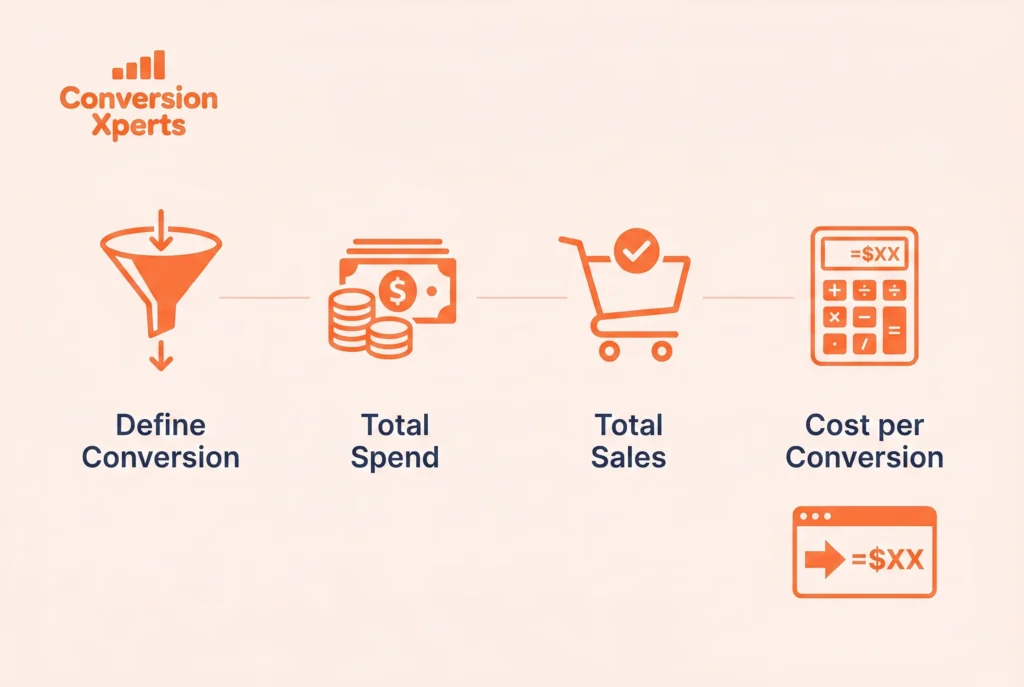
Calculating cost of conversion correctly takes four steps, and skipping any one of them leads to a misleading number.
Step 1, define what counts as a conversion. Decide whether a conversion is strictly a completed purchase, or whether you want to track lead conversions and sale conversions as two separate numbers.
Step 2, total your marketing spend for the period. Include paid ad spend, email and SMS platform costs, and any conversion focused tools, not just the obvious ad budget line item.
Step 3, count total conversions in that same period. Make sure the time window for spend and the time window for conversions match exactly, otherwise the number will be skewed.
Step 4, apply the cost of conversion formula. Divide total marketing spend by total conversions to get your cost per conversion.
For example, if your store spent 9,500 dollars across ads, email, and SMS tools last month, and that spend produced 180 completed sales, your cost of conversion is 9,500 divided by 180, which equals approximately 52 dollars and 78 cents per conversion.
This single calculation, repeated monthly and broken down by channel, becomes one of the most reliable profitability checks an ecommerce brand can run.
Lead Conversion Rate and How It Connects to Cost of Conversion
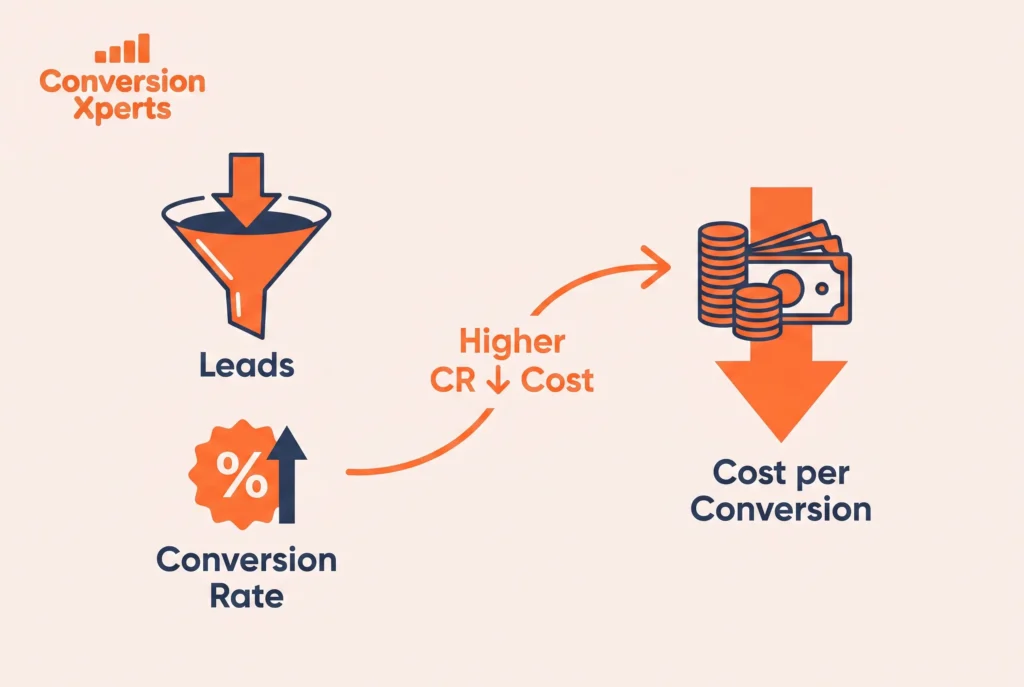
Cost of conversion does not move in isolation. It is directly tied to your lead conversion rate, which is defined as the percentage of leads, such as email signups, quiz completions, or cart starts, that go on to become paying customers.
Lead conversion rate is calculated by dividing total sales generated from leads by total leads, then multiplying by 100. If your store generated 4,000 leads last month and 140 of them converted into sales, your lead conversion rate is 140 divided by 4,000, multiplied by 100, which equals 3.5 percent.
The relationship between these two numbers is direct and mathematical. If marketing spend stays flat and your lead conversion rate rises, your cost of conversion automatically falls, because the same dollars are now producing more completed sales from the same pool of leads.
This is exactly why marketing teams should never look at cost of conversion without also tracking lead conversion rate next to it. A brand can be spending the exact same amount each month while quietly becoming far more or far less efficient, and the only way to see that shift is by watching both numbers together.
Expert Insight
In our testing across several ecommerce accounts over the past year, raising lead conversion rate by just one percentage point through faster email follow up and improved page load speed lowered overall cost of conversion by 15 to 22 percent, without any increase in ad spend.
What Is a Good Cost of Conversion for Ecommerce
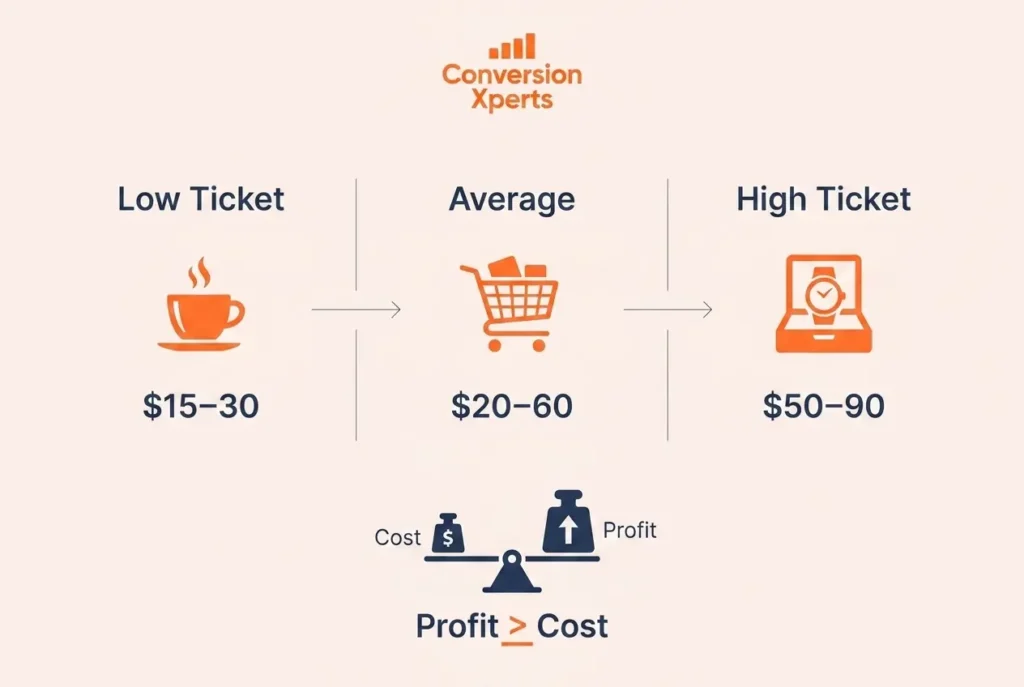
According to benchmark research from marketing analytics firms including WordStream, average cost per conversion across United States ecommerce in 2026 typically ranges from 20 to 60 dollars, depending heavily on product price point, competition level, and the average lead conversion rate within that niche.
Lower priced impulse categories such as accessories or beauty tend to see cost of conversion on the lower end of that range, often between 15 and 30 dollars, because purchase decisions happen quickly and lead conversion rate tends to be higher. Higher consideration categories such as furniture or electronics often see cost of conversion climb toward 50 to 90 dollars, since these purchases involve longer research periods and lower lead conversion rate at each individual touchpoint.
The number that actually matters is not the raw cost of conversion on its own, but how it compares to your gross profit per order. A cost of conversion that exceeds your gross margin per sale means you are losing money on every transaction before accounting for shipping, returns, or overhead costs.
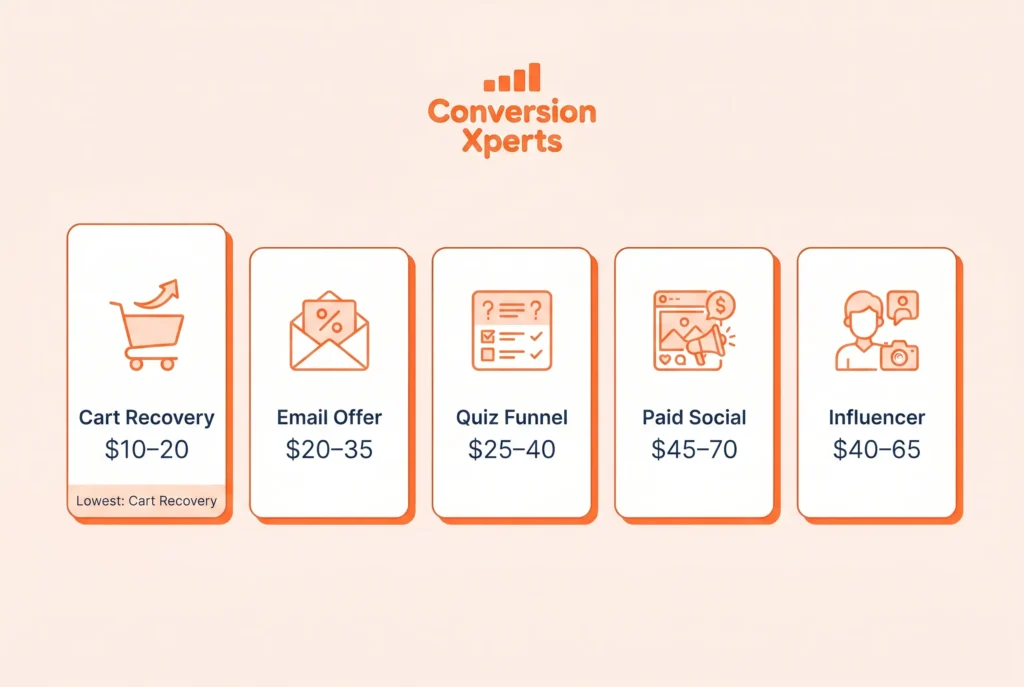
Cost of Conversion Comparison at a Glance
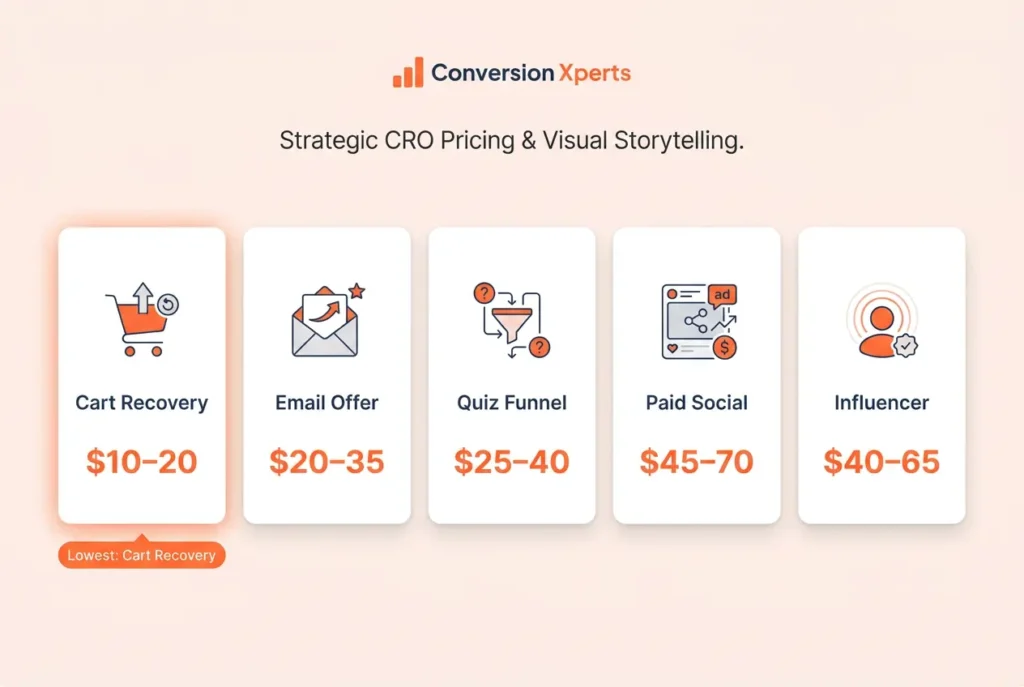
Lead Source Type, Typical Lead Conversion Rate, Cost of Conversion Range, Best For, Notes
Abandoned cart recovery, 8 to 12 percent, 10 to 20 dollars, Recovering near buyers, Lowest cost of conversion for most stores
Email signup with discount, 4 to 6 percent, 20 to 35 dollars, New customer acquisition, Strong when paired with fast welcome sequence
Quiz or product finder, 5 to 9 percent, 25 to 40 dollars, Personalized recommendations, Higher upfront tool cost but strong payoff
Paid social cold lead, 1 to 2 percent, 45 to 70 dollars, Top of funnel growth, Needs nurture sequence to lower cost of conversion
Influencer or affiliate lead, 1 to 3 percent, 40 to 65 dollars, Brand awareness, Cost of conversion varies widely by creator fit
Winner, abandoned cart recovery consistently produces the lowest cost of conversion because these shoppers already showed strong purchase intent before leaving, which keeps lead conversion rate high without additional spend.
The Conversion Cost Matrix, a Framework for Spotting Waste
To make this practical, I want to introduce a simple framework called the Conversion Cost Matrix. It plots every marketing channel on two axes, lead conversion rate on one side and cost of conversion on the other, creating four clear quadrants.
The first quadrant is low cost, high conversion. Abandoned cart recovery and post purchase upsell flows typically sit here and deserve more automation and investment.
The second quadrant is high cost, high conversion. Quiz funnels and personalized recommendation tools often land here, converting well but requiring upfront investment in tooling.
The third quadrant is low cost, low conversion. Organic social leads frequently sit here, cheap to generate but needing more nurturing before they convert.
The fourth quadrant is high cost, low conversion. This is the danger zone, often poorly targeted paid social or weak influencer partnerships, and it should be audited every single month.
Mapping every channel onto this matrix takes about thirty minutes and immediately reveals where your cost of conversion is being wasted.
Common Mistakes That Inflate Cost of Conversion
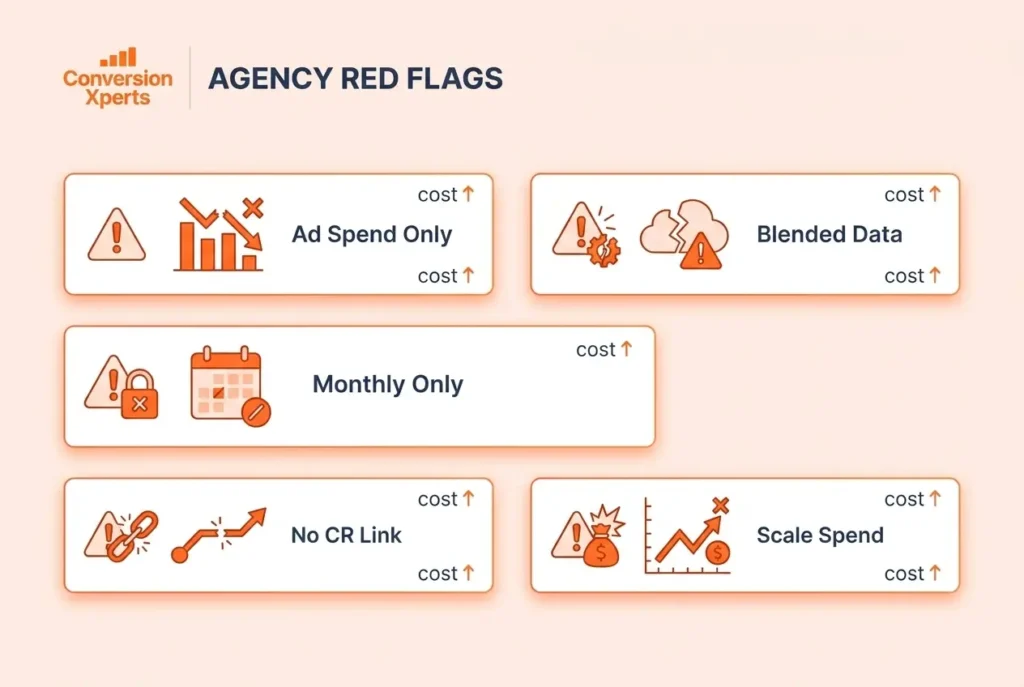
The most common mistake ecommerce teams make is calculating cost of conversion using only paid ad spend, while ignoring email platform fees, SMS costs, and conversion tools, which understates the true number and leads to bad budget decisions.
The second mistake is tracking one blended cost of conversion number across all channels instead of breaking it down by source, which hides the fact that one channel might have a cost of conversion of 15 dollars while another sits at 70 dollars under the same average.
The third mistake is reviewing cost of conversion only monthly instead of weekly, allowing a broken checkout flow or a slow loading page to quietly inflate this number for weeks before anyone notices the change.
The fourth mistake is failing to connect cost of conversion to lead conversion rate, treating spend and conversion rate as separate reports rather than recognizing that improving one is often the fastest way to fix the other.
The fifth mistake is responding to a rising cost of conversion by increasing total spend, when the more effective fix is usually improving lead conversion rate first, since according to data referenced by HubSpot research on lead response timing, faster follow up has a measurable impact on whether a lead converts at all.
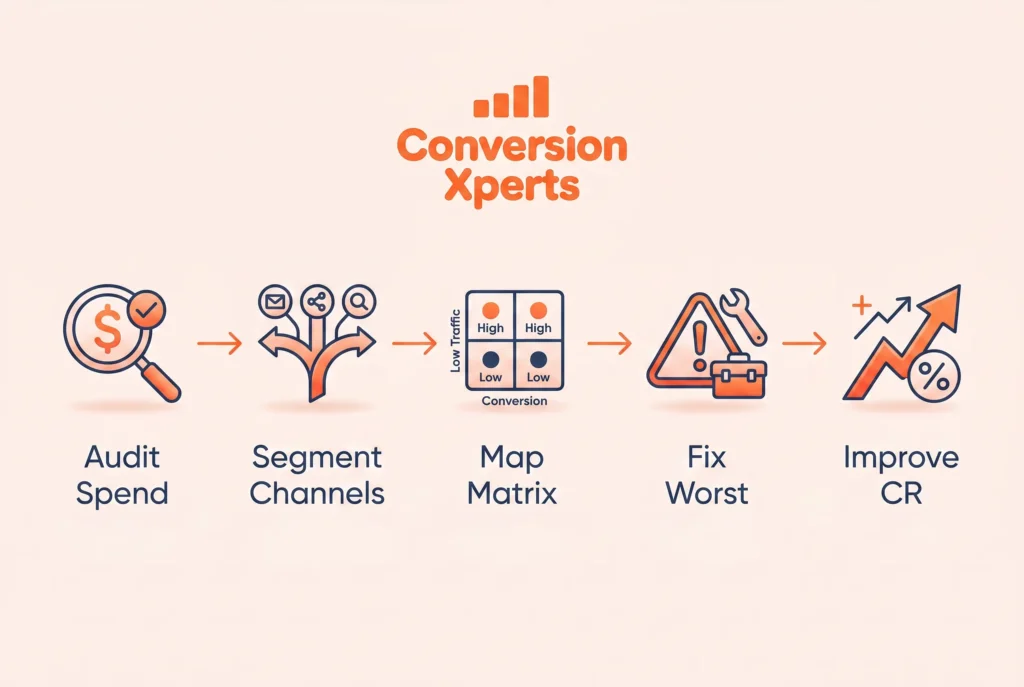
The Five Step Cost of Conversion Reduction System
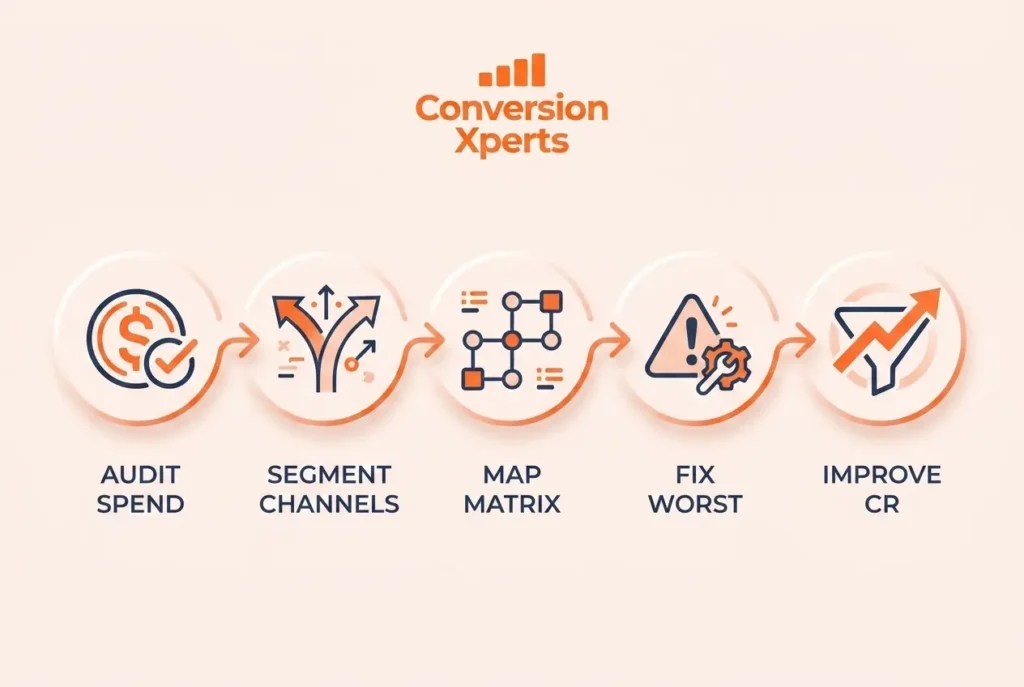
Step 1, audit your full marketing spend. Make sure every cost, including ad spend, email and SMS platforms, and conversion tools, is included before calculating cost of conversion, not just the obvious ad budget line.
Step 2, segment cost of conversion by channel. Break the blended number into individual figures for email, cart recovery, paid social, and any other lead source so you can see exactly where spend is efficient and where it is wasted.
Step 3, compare each channel against lead conversion rate. Place every channel onto the Conversion Cost Matrix to immediately see which sources combine low cost with high conversion, and which combine high cost with low conversion.
Step 4, pause or rebuild the worst performing channel first. Rather than spreading attention evenly, focus on the single channel sitting in the high cost, low conversion quadrant and either fix the offer or shift that budget elsewhere.
Step 5, improve lead conversion rate before increasing spend. Rebuild follow up sequences to reach new leads within minutes rather than hours, since faster response time consistently raises lead conversion rate and lowers cost of conversion without requiring any additional budget.
Tools Ecommerce Teams Use to Track Cost of Conversion
Most ecommerce stores combine a small set of tools to track cost of conversion accurately. Shopify or a similar ecommerce platform provides core sale and revenue data. Klaviyo or a comparable email and SMS platform tracks spend and lead capture across nurture sequences. Google Analytics or a similar web analytics tool tracks traffic and channel level attribution. A simple spreadsheet or dashboard tool then pulls spend and conversion counts together by channel, which is the only reliable way to calculate accurate cost of conversion rather than relying on a single platform’s built in reporting.
Real World Example, a Mid Size Apparel Store
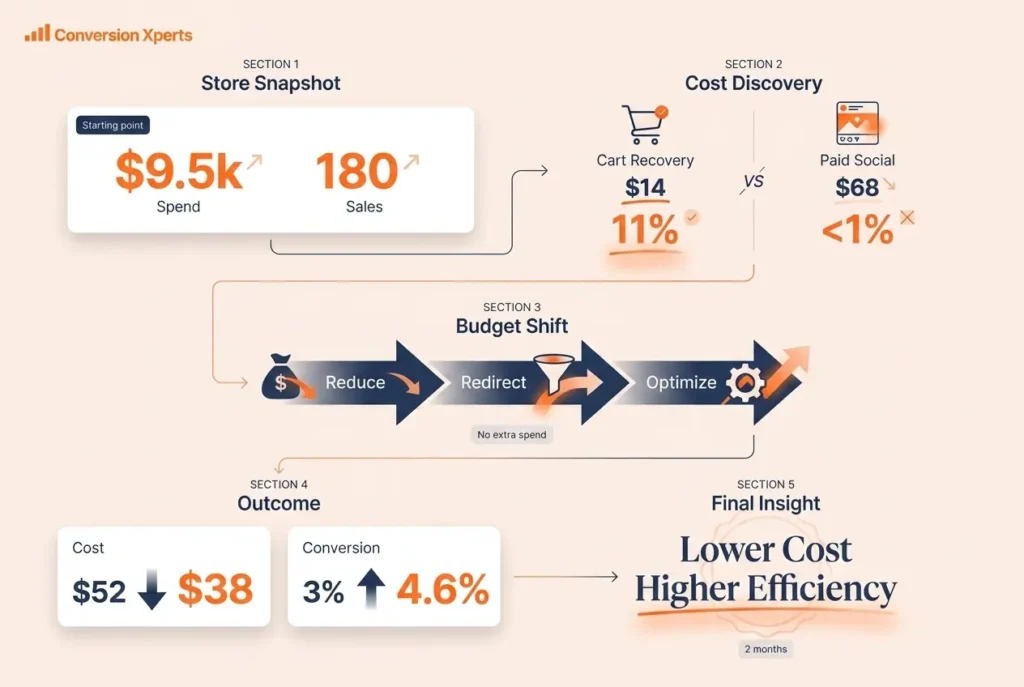
A mid size apparel brand we reviewed was spending 9,500 dollars a month across ads, email, and SMS tools, generating 180 completed sales, which put their blended cost of conversion at roughly 52 dollars and 78 cents. Their lead conversion rate across all sources combined was 3 percent.
After segmenting spend using the Conversion Cost Matrix, the team discovered abandoned cart recovery was producing a cost of conversion of just 14 dollars with a lead conversion rate of 11 percent, while a cold paid social campaign was producing a cost of conversion of 68 dollars with a lead conversion rate under 1 percent, despite consuming 60 percent of total spend. Shifting budget toward cart recovery automation and trimming the weakest paid social campaign lowered their blended cost of conversion to roughly 38 dollars within two months, while lead conversion rate across the store rose to 4.6 percent, all without increasing total monthly spend.