Conversion Rate Optimization Best Practices: The Ultimate Guide (2026)
What Is Conversion Rate Optimization and Why It Matters
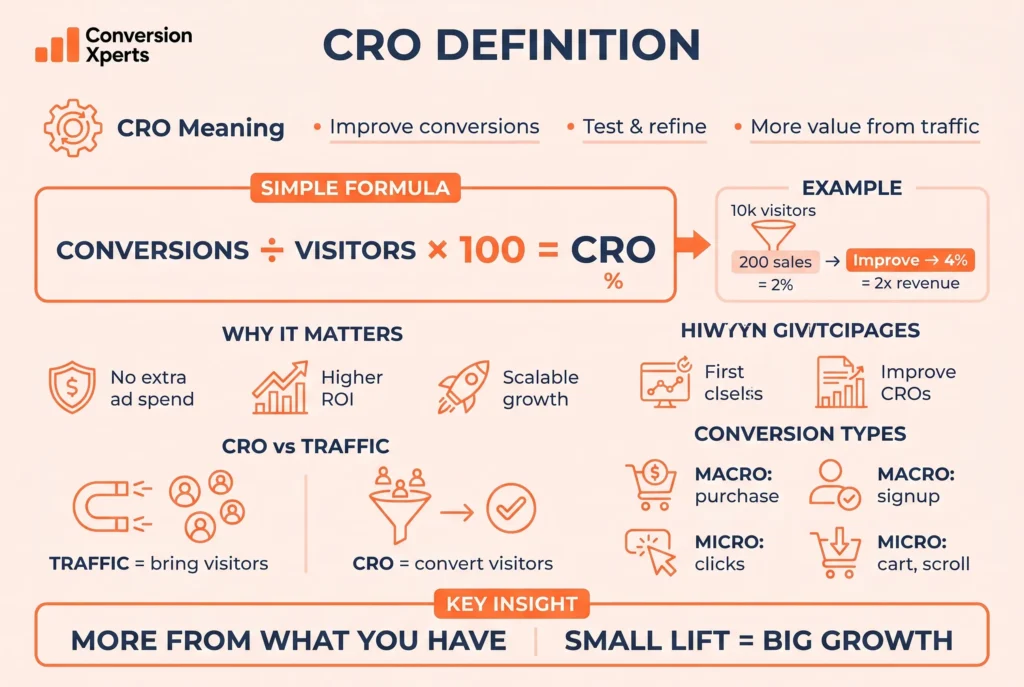
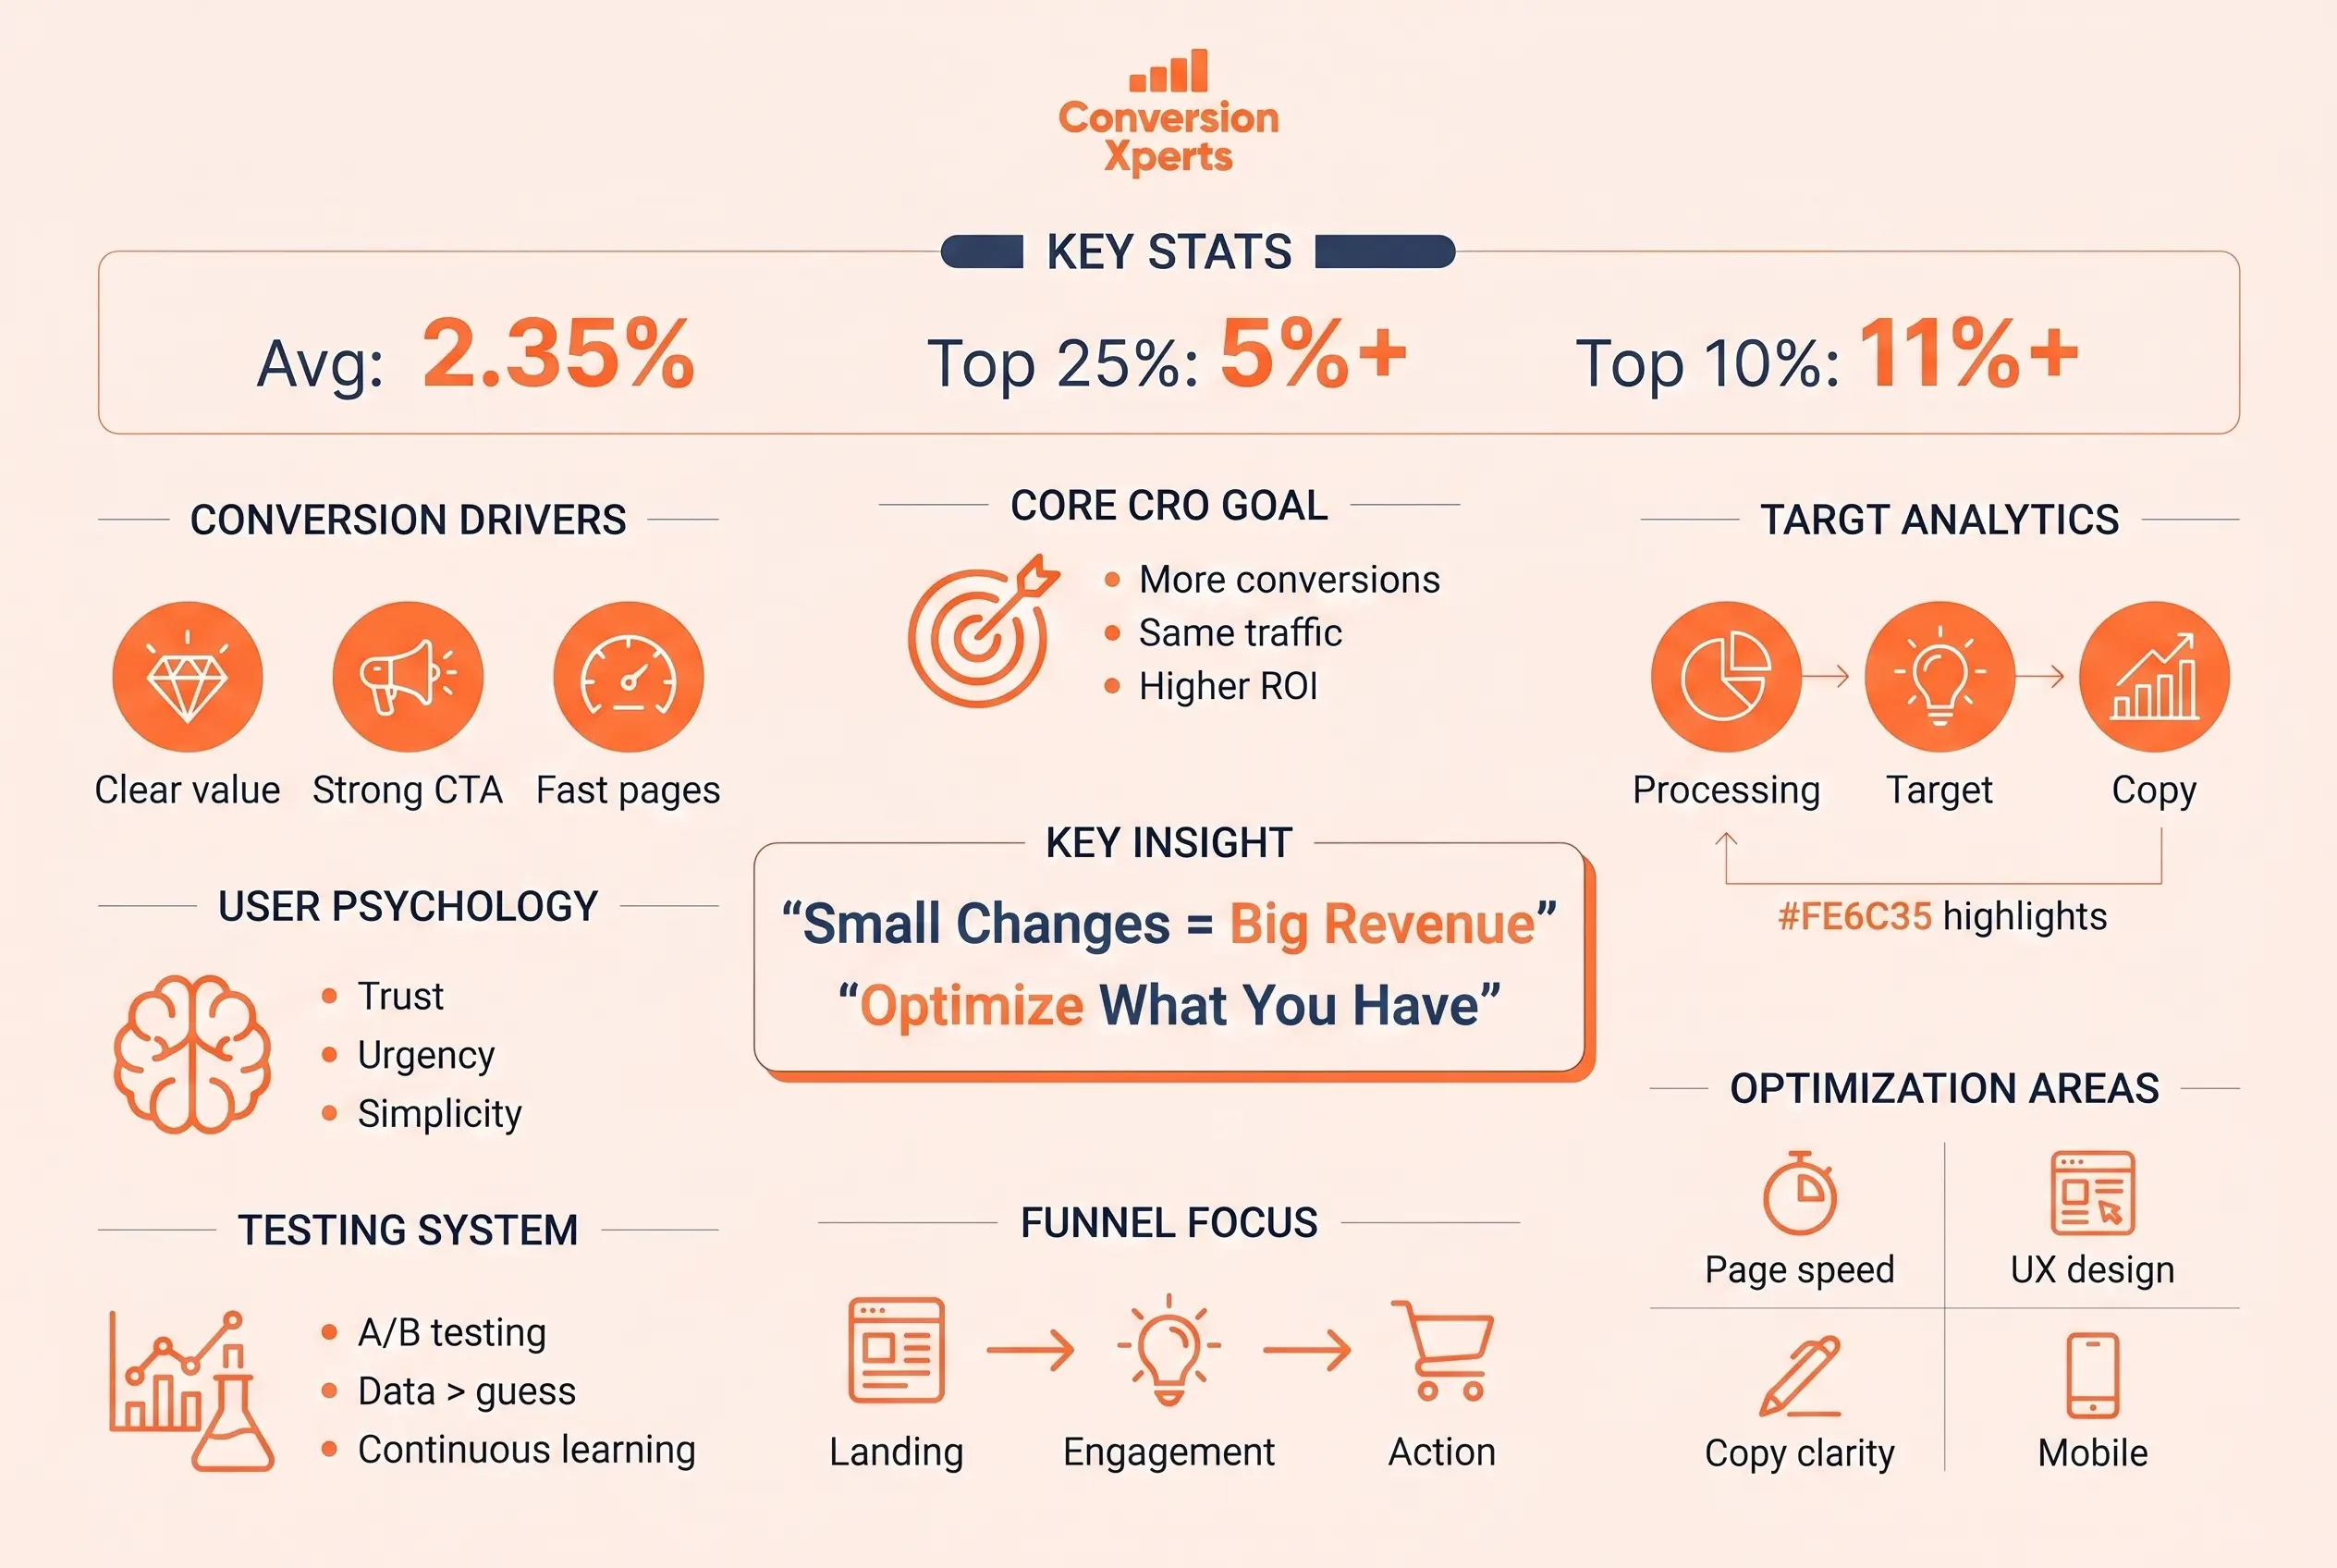
Conversion rate optimization is the systematic practice of testing and improving website elements to increase the percentage of visitors who take a target action. Rather than spending more to attract new visitors, CRO focuses on squeezing more value from existing traffic.
The formula is simple:
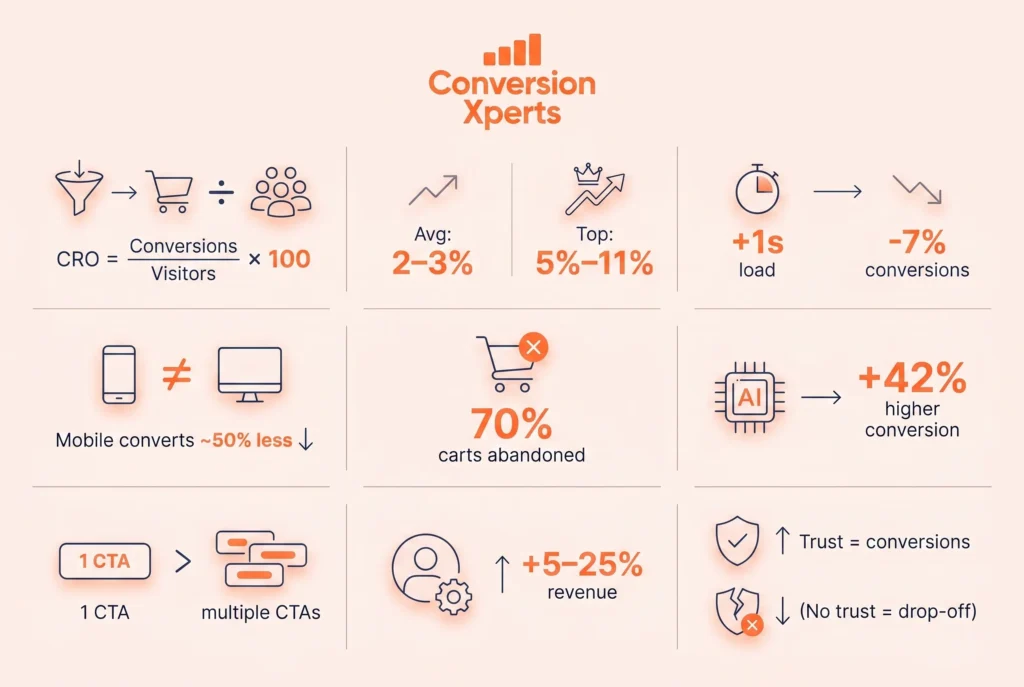
Conversion Rate = (Number of Conversions / Total Visitors) x 100
If your site gets 10,000 visitors per month and 200 of them buy something, your conversion rate is 2%. Improving that rate to 4% effectively doubles your revenue without spending an additional dollar on advertising.
Why CRO Delivers Exceptional ROI
According to a 2024 report by Invesp, businesses that invest in structured CRO programs generate 223% more ROI on average than those that do not. Every percentage point gained in conversion rate has a compounding effect across your entire marketing funnel.
Think of it this way. If you spend $10,000 per month on paid ads and convert at 2%, you generate 200 leads. Improve your rate to 3% and you generate 300 leads from the exact same ad spend. That is 100 additional leads at zero incremental cost.
The Difference Between CRO and Traffic Generation
Traffic generation brings people to your door. CRO decides whether they walk in and buy. Most businesses obsess over traffic and neglect conversion. The most profitable businesses do both. As Neil Patel noted in 2024, “Traffic without conversion is just a vanity metric.”
What Counts as a Conversion
A conversion is any meaningful action a visitor takes that moves them closer to becoming a customer. Macro conversions include purchases, subscriptions, and booked appointments. Micro conversions include email signups, video plays, cart additions, and page scroll depth. Tracking both types gives a complete picture of user intent and funnel health.
Conversion Rate Optimization Best Practices for Landing Pages
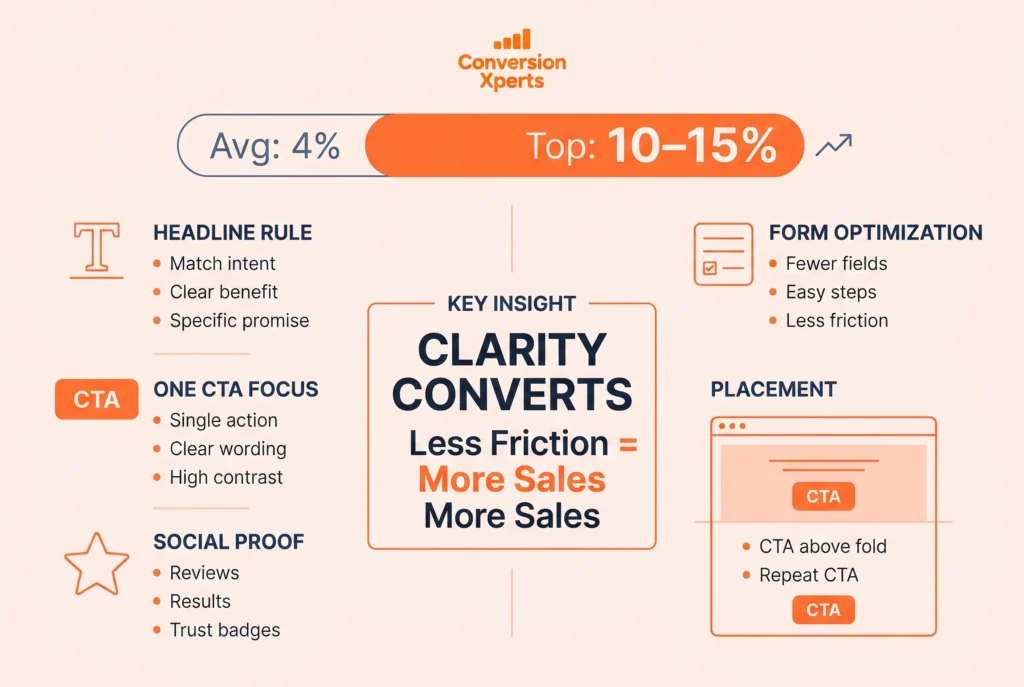
Landing pages are the highest-leverage point in any funnel. A well-optimized landing page can convert between 10% and 15% of visitors. The industry average sits at around 4.02%, according to WordStream’s 2024 benchmarks. The difference lies almost entirely in execution.
Write Headlines That Match Search and Ad Intent
Your headline is the first thing every visitor reads and the primary reason they stay or leave. According to Copyblogline data cited in the 2024 Nielsen Norman Group report, 80% of visitors read headline copy but only 20% read the rest of the page.
A high-converting headline must do three things immediately. It must confirm the visitor is in the right place. It must communicate the core value proposition. And it must create enough curiosity or urgency to keep the visitor reading.
Weak headline: “Welcome to Our Platform” Strong headline: “Cut Your Customer Acquisition Cost by 40% in 90 Days”
The second version is specific, benefit-driven, and time-bound. It speaks directly to a pain point. That is what separates high-converting landing pages from low-converting ones.
Always match your headline to the source of traffic. If your Google Ad says “Free CRM for Small Businesses,” your landing page headline should echo that exact language. This concept, called message match, reduces bounce rates by creating continuity between the ad and the destination.
Design a Single, Focused Call to Action
One of the most consistent findings in CRO research is that pages with multiple competing calls to action convert worse than pages with a single focused one. HubSpot’s 2023 State of Marketing report found that landing pages with one CTA convert 266% better than pages with five or more CTAs.
The reason is psychological. When visitors face multiple choices, they experience decision fatigue and often choose none. Clarity drives action.
Your CTA button should use action-oriented, first-person language. “Get My Free Report” consistently outperforms “Download” or “Submit.” A 2024 Unbounce study found that first-person phrasing on CTA buttons increased clicks by 90% compared to generic alternatives.
CTA placement also matters. Put your primary CTA above the fold so visitors see it without scrolling. Repeat it after every major section of long-form pages. Use contrast color so the button visually pops from the background.
Use Social Proof Strategically
Social proof is one of the most powerful conversion optimization tools available. Testimonials, reviews, trust badges, client logos, case study snippets, and usage statistics all serve as external validation that reduces buyer hesitation.
According to BrightLocal’s 2024 Consumer Review Survey, 87% of consumers read online reviews before making a purchase decision. Pages that display customer testimonials see an average conversion lift of 34%, according to VWO’s 2023 benchmark data.
Place social proof near your CTA, not just at the bottom of the page. The moment a visitor is about to click is the moment they need reassurance. A short testimonial next to your primary button can dramatically improve conversion rates.
Specificity makes testimonials more credible. “This software helped us increase revenue by 62% in six months, reducing our sales cycle from three weeks to five days” is far more persuasive than “Great product, highly recommend!”
Minimize Form Fields
Every additional field in a form reduces the likelihood of completion. This is one of the most replicated findings in all of CRO research.
Unbounce’s 2024 Conversion Benchmark Report found that reducing form fields from 11 to 4 increased conversions by 120%. If you only need an email address, only ask for an email address. You can collect additional information later in the onboarding sequence once trust has been established.
For longer forms that cannot be shortened, use progressive disclosure. Break the form into multiple steps and show a progress bar. Multi-step forms routinely outperform single long forms because each small step builds commitment through the psychological principle of consistency.
How to Improve Conversion Rate on Website Using Psychology
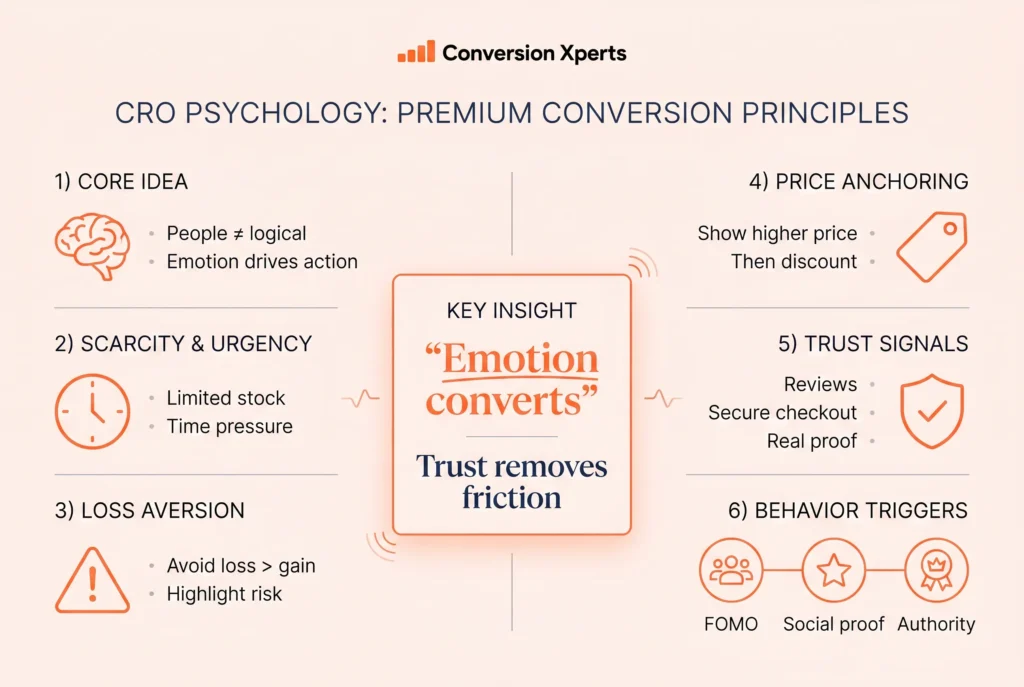
Understanding the psychological drivers of human decision-making is one of the most effective and underused conversion rate optimization strategies. People do not make purely rational decisions. Emotion, cognitive bias, and social influence shape every click, scroll, and purchase.
The Principle of Scarcity and Urgency
Scarcity and urgency are among the most reliable triggers in consumer psychology. When people believe something is limited in supply or available for only a short time, they assign it greater value and act faster.
Booking.com famously uses both tactics simultaneously: “Only 2 rooms left at this price” combined with “12 people are looking at this right now.” Their internal tests, described in a 2023 case study published by the Baymard Institute, showed these urgency signals increased bookings by 27% on average.
Urgency works best when it is real. Artificial countdown timers that reset on every page visit erode trust and damage brand reputation. Authentic scarcity, such as genuine inventory limits or actual sale deadlines, produces sustainable conversion gains without the long-term brand damage.
Loss Aversion and Framing Effects
Nobel Prize-winning psychologist Daniel Kahneman demonstrated that people are roughly twice as motivated to avoid a loss as they are to acquire an equivalent gain. Smart copywriters use this principle in every headline and CTA.
Framing your offer around what the prospect loses by not acting is often more effective than framing it around what they gain by acting.
Instead of: “Grow your email list with our tool.” Try: “Stop losing 73% of your visitors forever with no way to reach them again.”
The second version activates loss aversion and speaks to a pain point the visitor already feels. Both sentences describe the same product. The second one converts better because it triggers a stronger emotional response.
The Anchoring Effect in Pricing
Anchoring is the cognitive bias where the first piece of information encountered serves as a reference point for all subsequent judgments. In pricing, showing a higher original price next to a discounted price makes the discounted price feel like a bargain even if the original price was never what customers actually paid.
A 2024 study published in the Journal of Consumer Psychology found that price anchoring increased purchase intent by 38% compared to showing the discounted price alone.
This principle also applies to pricing tiers. Displaying a premium plan first makes middle-tier plans appear more affordable by comparison. This is why SaaS companies consistently list their most expensive plan on the left in pricing tables.
Trust Signals and Authority Indicators
Visitors make subconscious trust assessments within milliseconds of landing on a page. Trust is built through visual credibility signals, not just claims.
Effective trust signals include SSL certificates and padlock icons near checkout, clear refund and return policies, press logos and media mentions, professional photography, named and photographed testimonials, recognizable payment method icons, and physical address and phone number visibility.
According to a 2024 survey by the Baymard Institute, 17% of abandoned purchases were directly attributed to trust concerns about the website. Eliminating trust objections is one of the highest-leverage conversion optimization strategies available.
A/B Testing and Data-Driven Conversion Optimization Tips
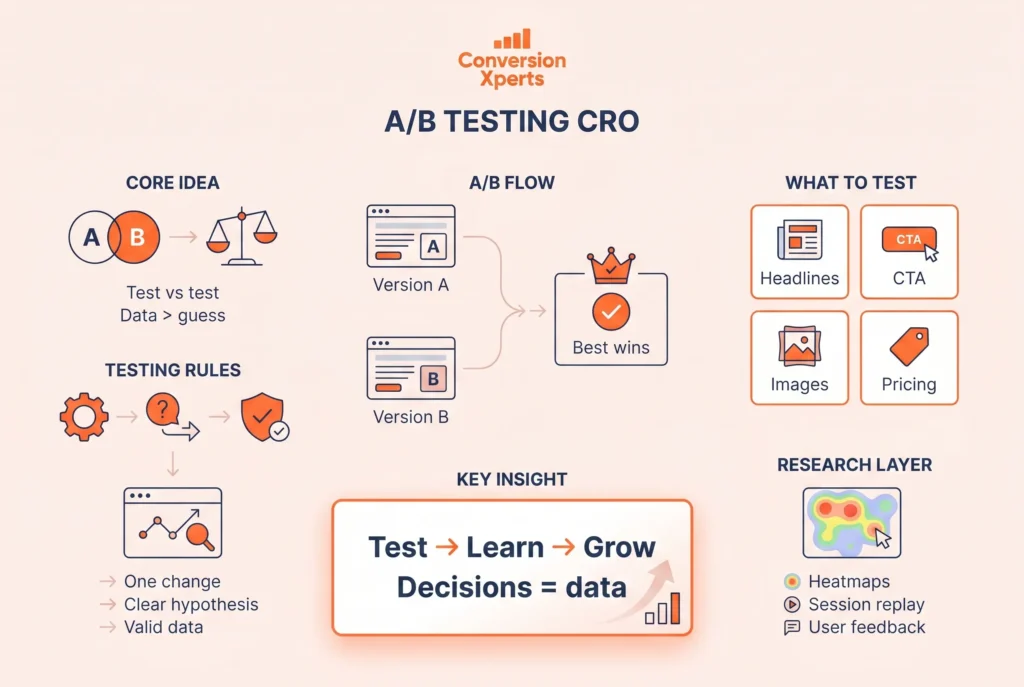
A/B testing is the backbone of any serious conversion rate optimization program. It is the process of showing two or more versions of a page, element, or flow to different segments of visitors simultaneously and measuring which version drives more conversions.
Without testing, CRO is just guesswork. With structured testing, every change is validated by real user behavior.
How to Run A/B Tests That Actually Move the Needle
Most A/B tests fail not because the hypothesis was wrong, but because the test was set up incorrectly. The most common mistakes are testing too many changes at once, ending tests too early, and running tests without statistical significance.
A proper A/B test requires a clear hypothesis. Not “let us try a green button” but “changing the CTA button from gray to orange will increase clicks by 15% because orange creates higher visual contrast with our white background, making it more noticeable.”
According to Optimizely’s 2024 Experimentation Platform Report, teams that document hypotheses before testing generate 40% more winning test results than teams that test ad hoc.
Always test one variable at a time unless you are running a multivariate test with sufficient traffic. Running multiple simultaneous changes makes it impossible to know which change caused the result.
Statistical significance is non-negotiable. Most CRO practitioners use a 95% confidence threshold. This means there is only a 5% chance the observed difference occurred by random variation rather than the change you made. Google Optimize and VWO both provide built-in significance calculators.
What to Test First for Maximum Impact
Not all page elements are equal in their conversion impact. Prioritize testing elements with the highest leverage first using the PIE framework: Potential, Importance, and Ease.
Headlines consistently rank as the highest-leverage test because they affect every single visitor. Button copy and color, hero images, pricing presentation, testimonial placement, and form length are all high-impact test candidates.
According to Widerfunnel’s 2024 State of Experimentation Report, headline tests produce winning results 43% of the time, compared to a 22% win rate for color and layout tests. Start with copy before design.
Qualitative Research to Inform Your Tests
Numbers tell you what is happening. Qualitative research tells you why. Session recording tools like Hotjar or Microsoft Clarity reveal where visitors click, where they drop off, how far they scroll, and what causes frustration.
Heatmaps regularly reveal surprising insights. Visitors often click on non-clickable elements, signaling they want information that is not being provided. Rage clicks on a specific area indicate a broken expectation. Scroll maps showing only 30% of visitors reach your pricing section mean your value proposition is not compelling enough above the fold.
Customer surveys are equally powerful. Asking visitors “What almost stopped you from signing up today?” generates conversion rate optimization tips that no amount of quantitative data could surface. According to a 2023 report by the Customer Experience Professionals Association, companies that combine behavioral data with direct customer feedback improve conversion rates 2.3 times faster than those that rely on analytics alone.
Page Speed, Mobile UX, and Technical CRO Factors
Technical performance is a conversion factor that is frequently underestimated. A website that loads slowly or looks broken on mobile is losing conversions before a single word of copy is read.
Page Speed Is a Conversion Multiplier
Google’s 2023 industry benchmark data shows that as page load time increases from one second to three seconds, the probability of a visitor bouncing increases by 32%. At five seconds, that probability increases by 90%.
Portent’s 2023 Site Speed and Conversion Rate study found that a one-second delay in page load time reduces conversions by 7%. For a website generating $100,000 per month in revenue, that is $7,000 per second of unnecessary delay.
Core Web Vitals, Google’s user experience metrics, directly affect both search rankings and conversion rates. The three key metrics are Largest Contentful Paint (LCP), which measures perceived load speed and should be under 2.5 seconds; First Input Delay (FID), which measures interactivity and should be under 100 milliseconds; and Cumulative Layout Shift (CLS), which measures visual stability and should be under 0.1.
Use Google PageSpeed Insights and GTmetrix to audit your current performance. Common quick wins include compressing images using WebP format, enabling browser caching, minifying CSS and JavaScript files, and using a content delivery network.
Mobile Optimization Is No Longer Optional
As of 2024, mobile devices account for 60.67% of all global website traffic, according to Statista. Google uses mobile-first indexing, meaning the mobile version of your site is what determines your search ranking.
Yet mobile conversion rates remain significantly lower than desktop rates. According to Statista’s 2024 Digital Commerce Report, mobile conversion rates average 2.1% compared to 4.3% on desktop. That gap represents a massive opportunity.
The primary reasons mobile converts worse include small tap targets that are difficult to click, forms that are painful to complete on a touchscreen, pages that are not responsive and require horizontal scrolling, and checkout processes not optimized for mobile payment methods like Apple Pay or Google Pay.
Fixing mobile UX is one of the highest-ROI conversion optimization strategies for most businesses. Ensure buttons are at least 44 by 44 pixels, use large legible font sizes of at least 16px, simplify navigation, and always test your checkout flow on an actual mobile device.
Reducing Checkout Friction for Ecommerce
Cart abandonment is a technical and UX problem as much as a trust problem. The Baymard Institute’s 2024 large-scale usability study found that the average documented cart abandonment rate is 70.19%. Of those abandoning shoppers, 26% left because the checkout process was too long or too complicated.
Enabling guest checkout is one of the single highest-impact changes an ecommerce site can make. Baymard found that forcing account creation before purchase reduces conversions by up to 24%. Over 35% of shoppers said they would abandon a purchase rather than create an account.
Every additional step in a checkout flow reduces completion probability. Evaluate your checkout page by page and remove every field, page, and confirmation step that is not strictly necessary.
Conversion Rate Optimization Tips for Ecommerce
Ecommerce CRO operates under specific dynamics that differ from lead generation. The purchase decision involves more risk, more comparison shopping, and more emotional friction. These conversion rate optimization tips are specifically calibrated to online retail.
Product Page Optimization
The product page is where purchase decisions are made. It must simultaneously inform, persuade, and remove doubt.
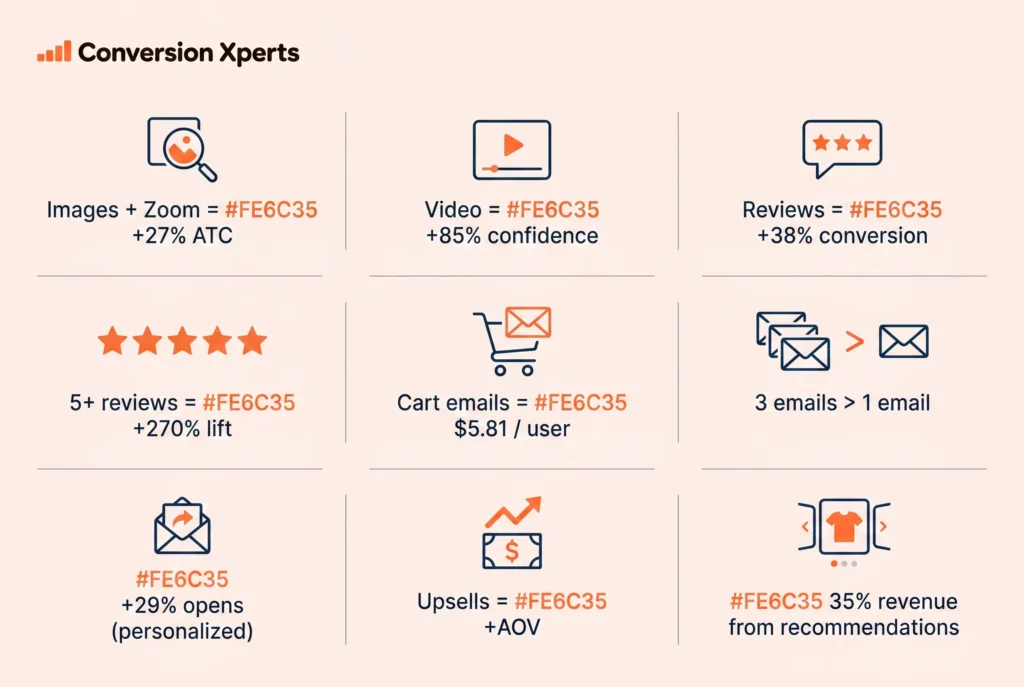
High-quality images from multiple angles are table stakes. A 2024 Shopify merchant data analysis found that stores offering 360-degree product views or zoom capability experienced 27% higher add-to-cart rates. Video demonstrations increase purchase confidence by 85%, according to Wyzowl’s 2024 Video Marketing Report.
Product descriptions should address the customer’s problem first and product features second. “Sleeps through the night in total comfort” sells a mattress better than “8-inch memory foam core with CertiPUR-US certification,” even if both statements appear on the same page.
Star ratings and review counts displayed prominently on product pages increase conversions by an average of 38%, according to Spiegel Research Center data updated in 2024. Products with 5 or more reviews convert 270% better than products with no reviews.
Cart Abandonment Recovery
The cart abandonment email sequence is one of the highest-ROI tactics in ecommerce. Klaviyo’s 2024 Benchmark Report found that abandoned cart email flows generate an average revenue per recipient of $5.81, making them among the most profitable automated emails in existence.
A three-email sequence outperforms single-email recovery consistently. Send the first email within one hour of abandonment, focusing on a helpful reminder with no discount. Send the second email 24 hours later, addressing potential objections. Send the third email 72 hours later with a time-limited incentive if conversion has not occurred.
Personalization dramatically improves performance. Including the actual product name, image, and price in the email subject line increases open rates by 29%, according to Campaign Monitor’s 2024 Email Marketing Benchmark Study.
Upsell and Cross-Sell Placement
Amazon attributes 35% of its total revenue to its recommendation engine. Post-purchase upselling is one of the most powerful revenue multipliers in ecommerce because the customer has already decided to trust you and has their payment method active.
Show upsell offers on the cart page, on the checkout confirmation page, and in the post-purchase email. Keep recommendations relevant and clearly explain the complementary value.
Average order value is a conversion metric often overlooked by CRO practitioners. Increasing AOV through upsells and cross-sells has the same mathematical effect as increasing conversion rate. Both multiply total revenue.
Building a CRO Stack: Tools, Metrics, and Process
A sustainable conversion rate optimization program requires the right infrastructure. Without a proper stack, insights are missed, tests cannot be tracked, and improvements do not compound over time.
The Essential CRO Tool Stack
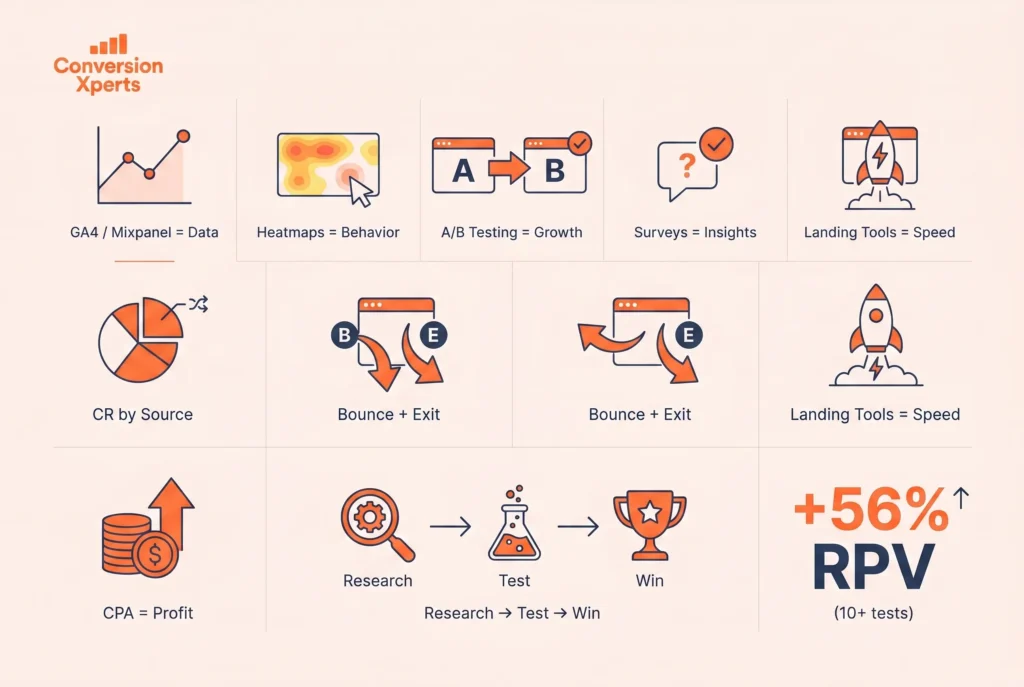
Analytics Foundation: Google Analytics 4 (free) or Mixpanel for behavioral analytics. Set up conversion goals, funnel reports, and audience segmentation before running any tests. You cannot improve what you cannot measure.
Heatmaps and Session Recording: Hotjar (plans from free to $99/month) or Microsoft Clarity (free) for visual behavior data. Both tools provide heatmaps, scroll maps, click maps, and session recordings.
A/B Testing: Optimizely, VWO, or Google Optimize for structured experimentation. These platforms handle traffic splitting, statistical significance calculation, and results reporting.
Customer Feedback: Typeform or SurveyMonkey for exit-intent surveys and on-page polls. Drift or Intercom for live chat data that surfaces common questions and objections.
Landing Page Building: Unbounce or Instapage for rapid landing page creation and testing without developer resources.
The Metrics That Actually Matter
Tracking too many metrics dilutes focus. The KPIs that matter most for conversion rate optimization are:
Overall conversion rate by traffic source, because different channels attract different audiences with different intent levels. Bounce rate by page and traffic source. Average session duration. Pages per session. Exit rate by page, particularly on checkout and lead generation flows. Cart abandonment rate for ecommerce. Cost per acquisition, which connects CRO directly to business profitability.
A 2024 Forrester Research report found that companies with clearly defined conversion KPIs and regular reporting cadences improve their overall conversion rates 1.8 times faster than companies that track metrics inconsistently.
The CRO Process Framework
The most successful CRO programs follow a structured repeating cycle: Research, Hypothesize, Test, Analyze, and Implement.
Research involves gathering quantitative data from analytics and qualitative data from user research, heatmaps, and surveys. Hypothesize involves formulating a specific, testable prediction about what change will improve performance and why. Test involves running a properly structured A/B or multivariate experiment. Analyze involves reading results at statistical significance and drawing conclusions. Implement involves deploying winning variants and documenting learnings for future tests.
This cycle should run continuously. The best CRO teams at companies like Booking.com, Amazon, and Airbnb run hundreds of tests per year because they have systematized the process. According to a 2024 Conversion XL survey, companies running 10 or more A/B tests per month generate 56% more revenue per visitor than companies running fewer than two tests per month.
CRO Comparison Table: High-Converting vs Low-Converting Pages
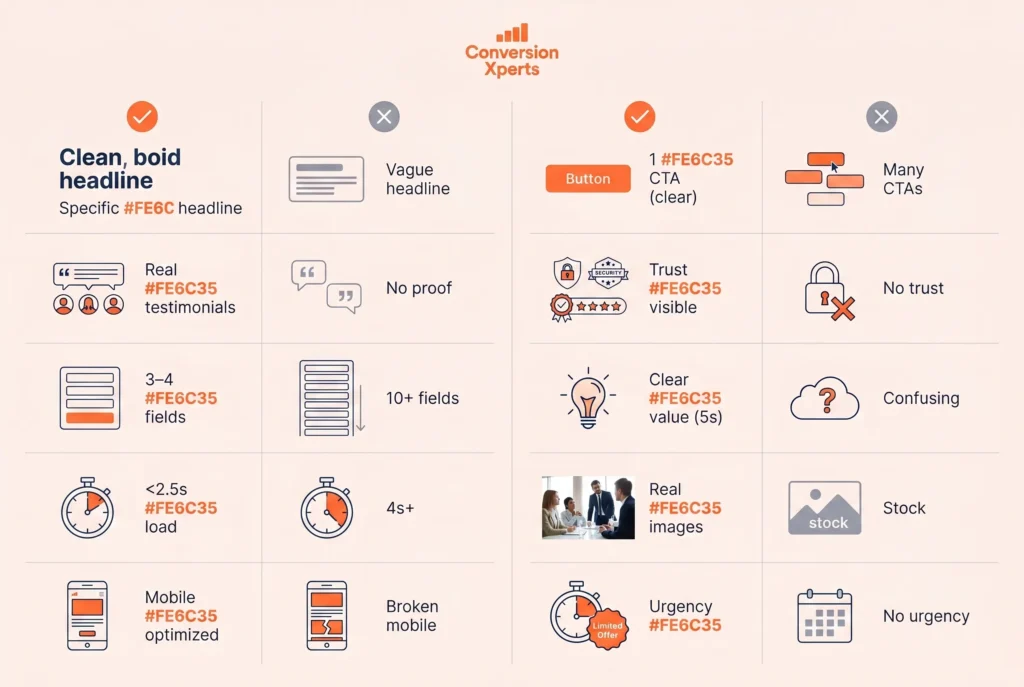
| Element | High-Converting Page | Low-Converting Page |
Headline | Specific, benefit-driven, audience-targeted | Generic, feature-focused, vague |
CTA | Single, prominent, first-person language | Multiple CTAs, passive language |
Social Proof | Specific testimonials with names and results | Anonymous quotes or no social proof |
Form Length | 3 to 4 fields, progressive if longer | 10 or more fields, no indication of time required |
Page Load Speed | Under 2.5 seconds LCP | 4 seconds or more |
Mobile Experience | Responsive, large tap targets, native checkout | Non-responsive, small buttons, desktop-only experience |
Trust Signals | SSL, reviews, guarantees, press logos visible | No trust signals or only buried in footer |
Value Proposition | Clear within 5 seconds of landing | Requires scrolling or reading to understand |
Images | High quality, product-in-use, lifestyle context | Stock photos, no product context |
Urgency | Authentic scarcity or time-based offer | No urgency, open-ended offer |