Ecommerce Conversion Rate News: The Complete 2026 Guide
What Is Ecommerce Conversion Rate and Why 2026 Is Different
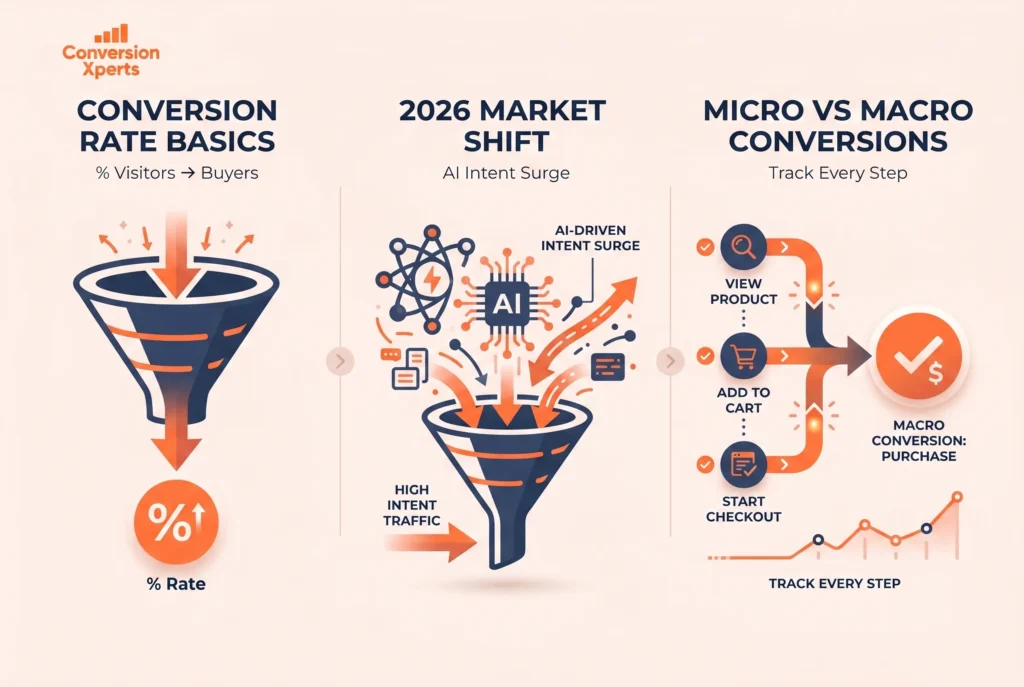
The ecommerce conversion rate is the percentage of website visitors who complete a target action — most commonly a purchase — out of total sessions in a given period. If your store gets 15,000 monthly visitors and 420 buy, your conversion rate is 2.8%.
Simple math. Enormous implications.
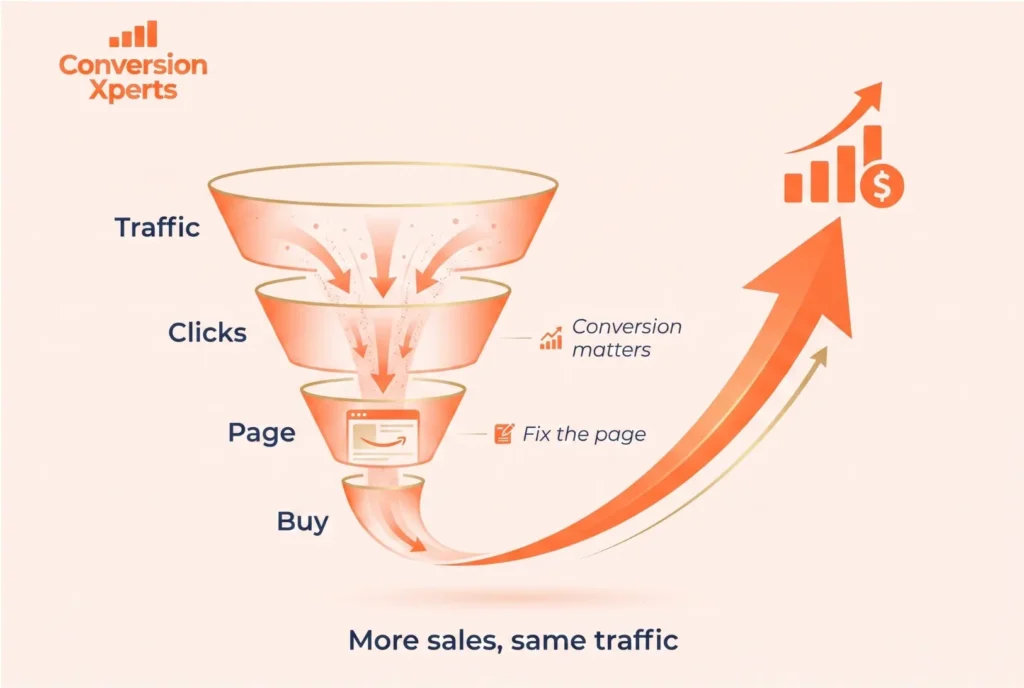
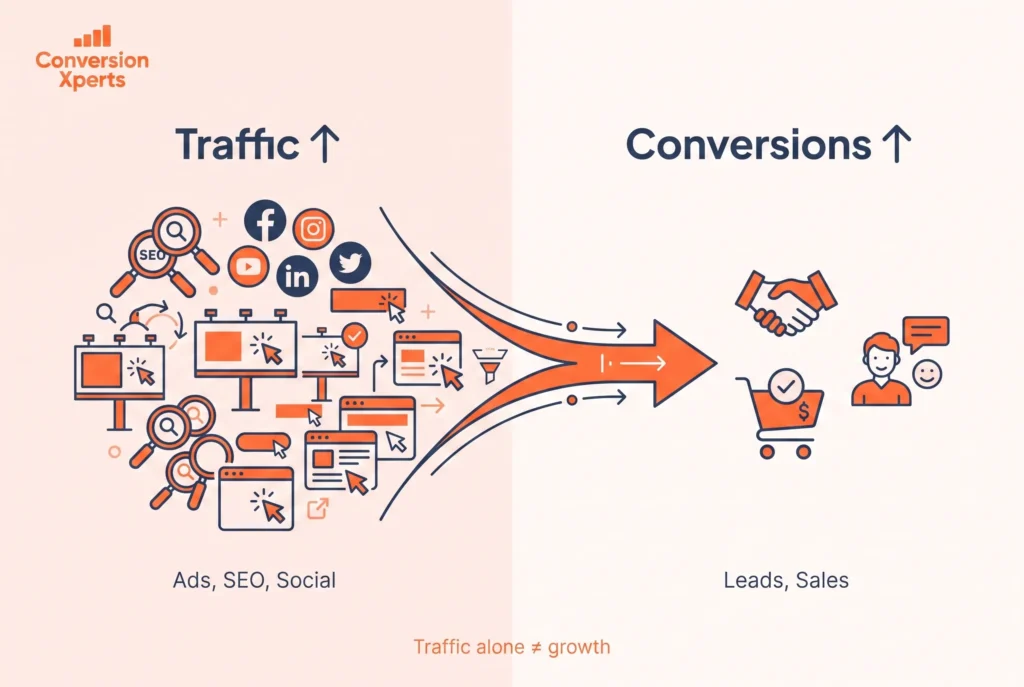
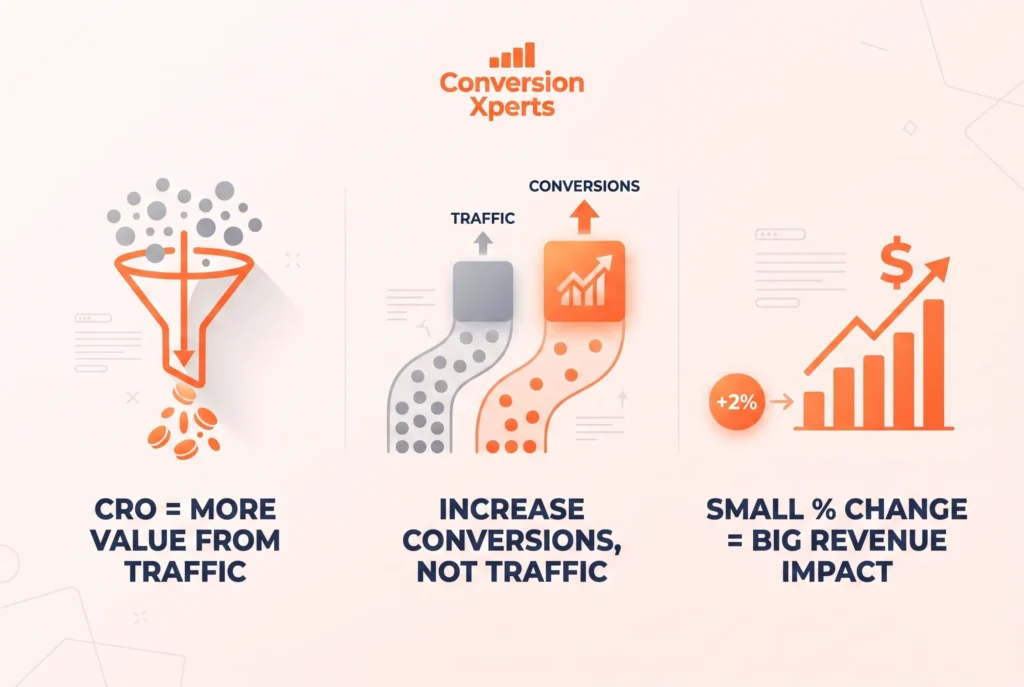
Improving your conversion rate is the only growth lever that costs zero additional ad spend. Double your rate, double your revenue from the same traffic. That is why conversion rate ecommerce optimization consistently delivers the highest ROI of any marketing activity available to online stores.
Why 2026 Specifically Changes Everything
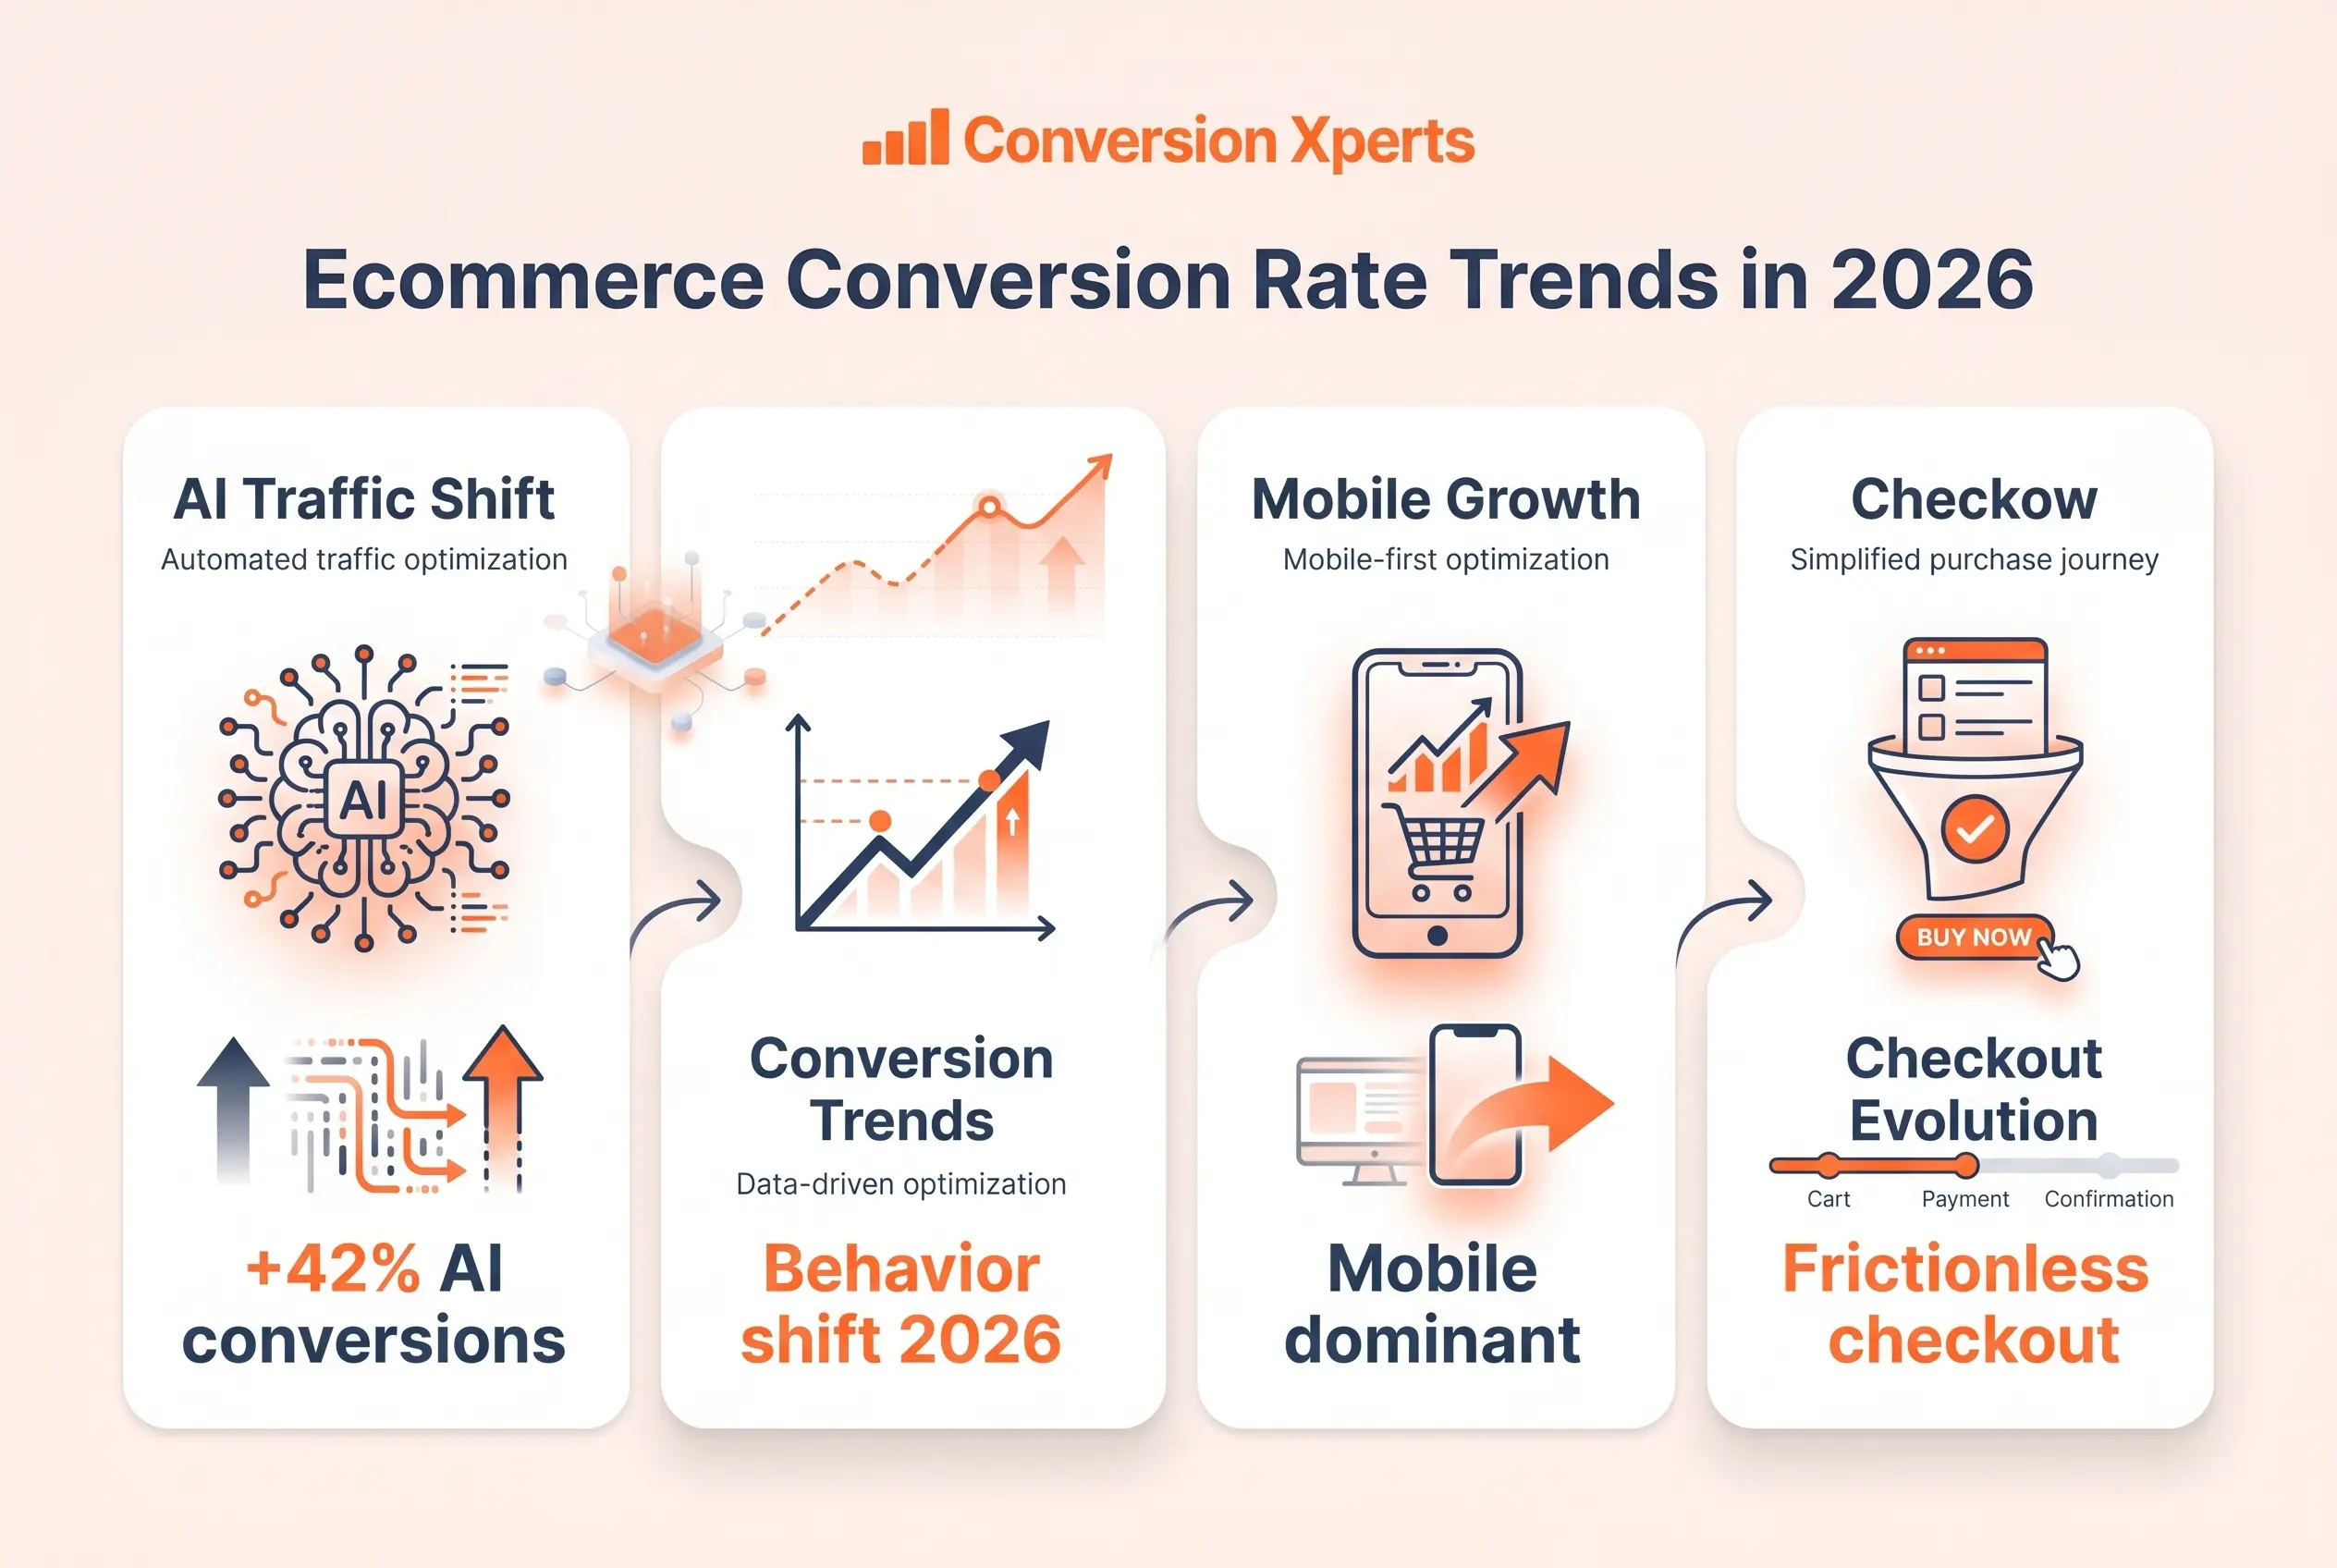
Three structural shifts have converged in 2026 to make ecommerce conversion rate news more consequential than at any previous point.
First, AI-assisted shopping has crossed a tipping point. Shoppers are now arriving on product pages after being advised by AI tools — ChatGPT, Perplexity, Google’s AI Overviews, and shopping-specific agents — with much higher purchase intent than traditional organic or paid traffic. The Adobe finding above is not a rounding error. It is a signal that the entire top-of-funnel dynamic is being restructured.
Second, 19% of consumers currently use AI agents for brand interactions, a figure expected to jump to 46% by end of 2026. That is not a future trend. That is happening now, this year, in your analytics.
Third, only 31% of companies have a structured approach to testing and optimization, meaning 69% of ecommerce businesses are guessing rather than testing. In an environment where top-performing stores are pulling further ahead using AI-powered personalization and systematic CRO, that gap is becoming commercially fatal.
Macro vs. Micro Conversions
Most ecommerce conversion rate news focuses on purchase conversions, but experienced operators track the full funnel: add-to-cart rates, product page engagement, email sign-ups, and wishlist additions. These micro-conversions predict purchase intent weeks before the sale lands and are the leading indicators that tell you whether your optimization efforts are actually working.
Latest Ecommerce Conversion Rate News and Benchmarks for 2026
Concrete, current numbers are the foundation of any conversion rate ecommerce strategy. Here is exactly where the benchmarks stand in 2026, sourced from the most credible datasets available.
The 2026 Global Baseline
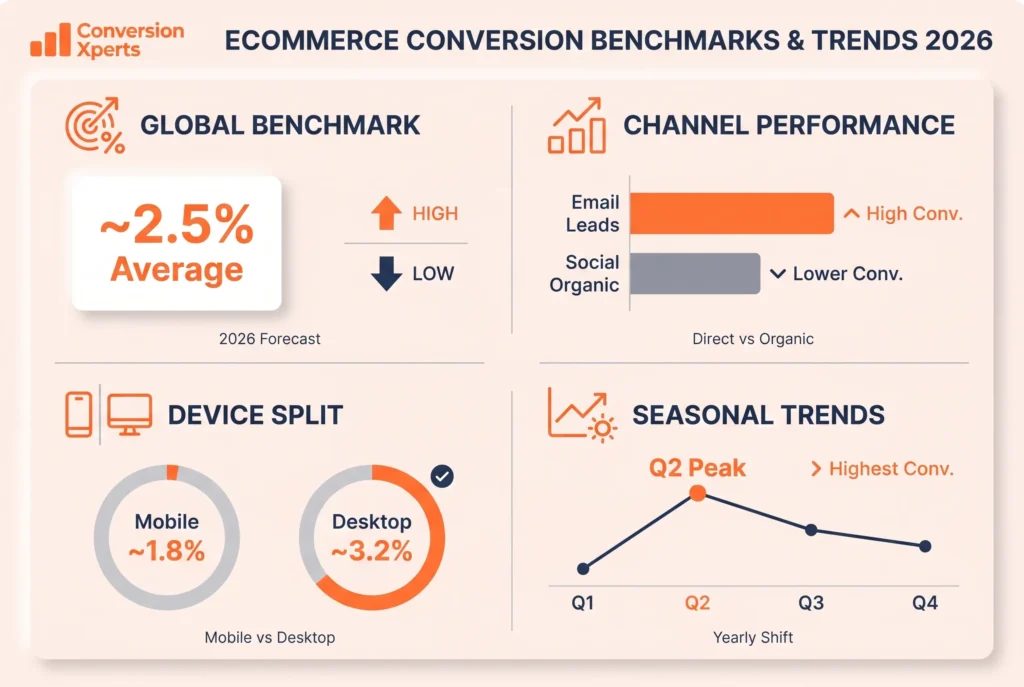
The global average ecommerce conversion rate ranges from 1.6% (Statista) to 2.9% (Dynamic Yield) depending on data source and methodology. The most commonly cited figure is 2.5%, reported by Contentsquare for Q3 2025, up 0.4% year over year.
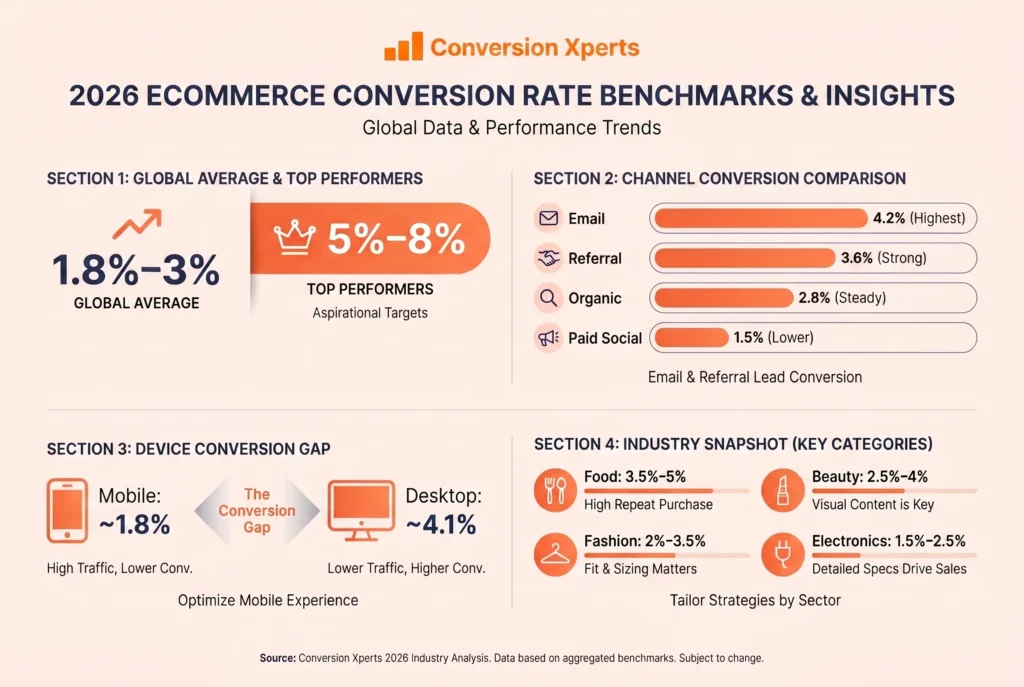
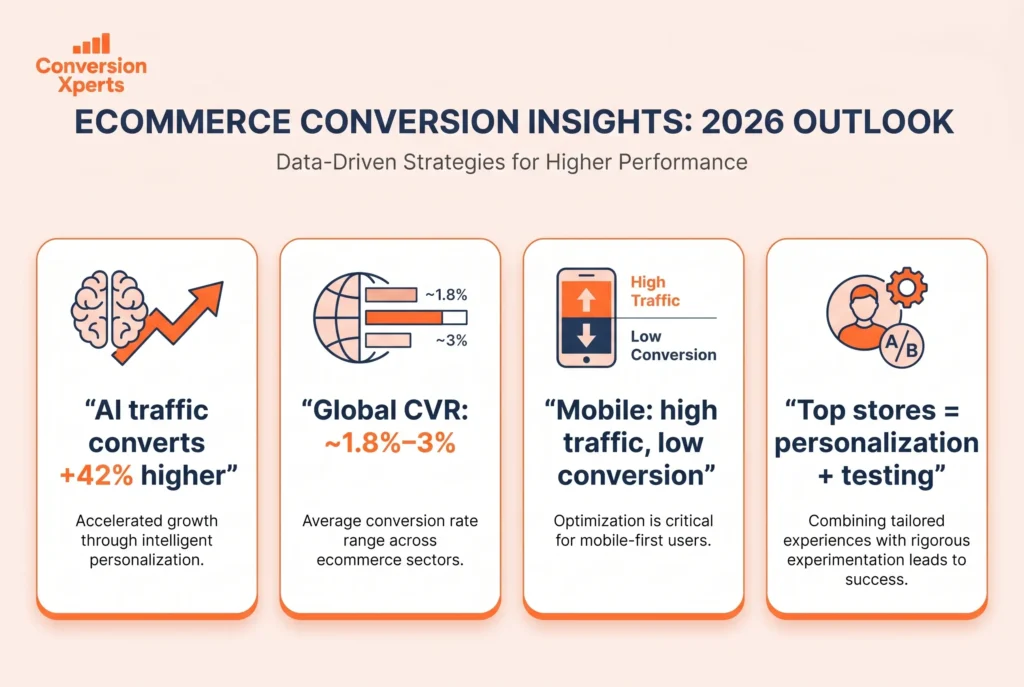
The realistic global range for ecommerce conversion rates in 2026 is 1.8% to 3%, with variation reflecting differences in merchant size, product category, traffic quality, and methodology. A rate of 2% or above generally indicates a healthy funnel for most stores. Stores above 3% are performing in the top tier.
For Shopify specifically, the picture is slightly more optimistic. Industry guides cite 2.5% to 3% as a typical conversion rate for Shopify stores, while optimized merchants regularly hit 4% to 5% and above.
Benchmarks by Traffic Channel
Channel matters enormously to conversion rate ecommerce performance. Here is how the numbers break down in 2026 data:
Referral traffic delivers the highest conversion rate at 5.4%, indicating strong trust and intent from third-party recommendations. Email marketing closely follows at 5.3%, proving highly effective due to targeted messaging and engaged subscriber lists. Direct traffic converts at 2.2%, suggesting brand-aware visitors are more likely to complete purchases than casual browsers.
By traffic source: email converts highest at 4.0% to 5.3%, organic search averages 2.7% to 3.0%, and paid social is lowest at 0.7% to 1.2%.
The paid social numbers deserve attention. Despite consuming enormous portions of ecommerce ad budgets, paid social traffic converts at barely above one percent. This is not a reason to abandon social advertising — it is a reason to build landing pages and post-click experiences specifically engineered for social-referred visitors who arrive with lower purchase intent than search or email traffic.
Benchmarks by Device
Mobile converts at roughly 1.8% to 2.8% versus desktop’s 3.2% to 3.9%. The gap exists because mobile screens make product comparison harder, checkout forms create more friction, and trust signals often get buried.
Mobile conversion lags at 1.8% versus desktop’s 3.9%, while mobile traffic reaches 70% of total ecommerce visits.
That arithmetic — 70% of traffic converting at roughly half the rate — is the single largest unrealized revenue opportunity sitting inside most ecommerce businesses right now.
The Seasonal Conversion Picture
First-party benchmark data from real Shopify stores adds important context that industry averages miss. Real data from 21 Shopify stores generating $688 million in combined revenue shows Q2 consistently outperforming Q4, despite Black Friday and Cyber Monday driving November volume, with Q2 2025 peaking at 3.21% and Q1 2026 dipping to 2.32%. This challenges the conventional wisdom that Q4 is always the highest-converting period — heavy promotional traffic during BFCM pulls in deal-seekers who convert at lower rates, diluting the overall number.
AI and Personalization: The Conversion Rate Story of the Year
No area of ecommerce conversion news has generated more data, investment, or urgency in 2026 than artificial intelligence. AI is no longer a bolt-on feature for enterprise retailers — it is the primary driver separating top-converting stores from the median.
AI Traffic Is Now Converting Better Than Everything Else
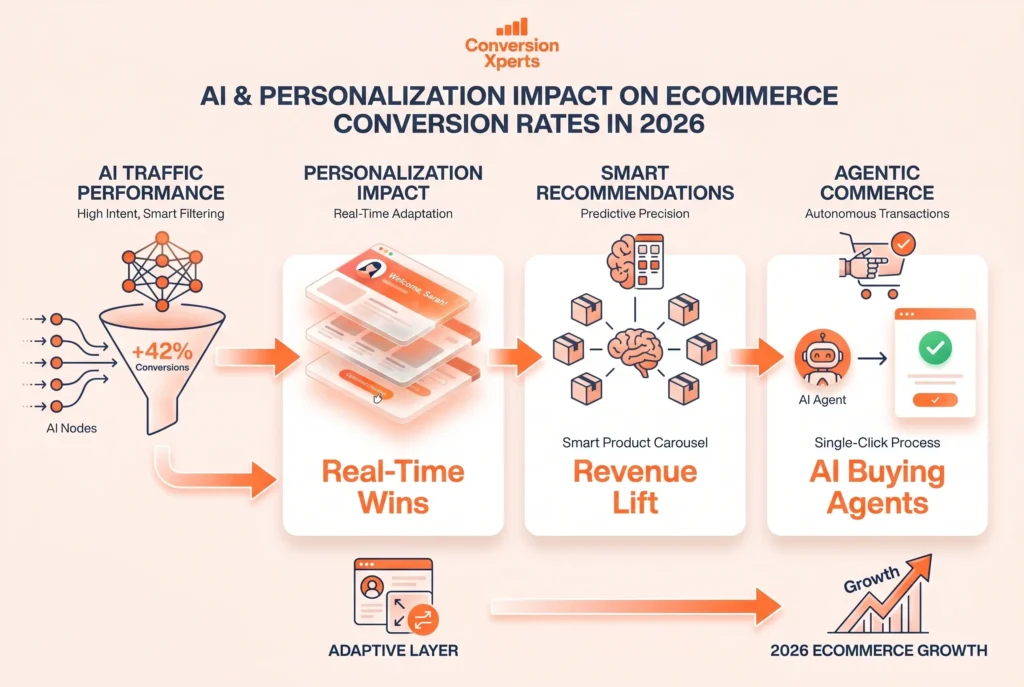
The most important ecommerce conversion news story of 2026 is the Adobe finding referenced above. AI-driven traffic to retailers’ websites converted 42% more often than traffic from non-AI sources as of March 2026 — a reversal from one year earlier, at which point visitors from AI sources were converting at almost half the rate associated with non-AI traffic.
What happened? AI shopping assistants have gotten dramatically better at matching shopper intent to the right product at the right moment. A consumer who arrives on your product page after a ChatGPT shopping conversation has already resolved most of their consideration questions. They are closer to the buy decision before they ever click your link.
The implication for ecommerce conversion strategy is significant: optimizing your product pages and product data for AI discovery is now a direct conversion optimization activity, not just an SEO task.
The Revenue Impact of AI Personalization
According to McKinsey, AI personalization most often drives a 5% to 15% revenue lift, with top performers reaching 25%. Additionally, 79% of brands say AI-driven conversational commerce has increased their sales.
Shoppers complete purchases 47% faster when assisted by AI tools, and 89% of companies report positive returns from AI personalization, with an average payback period of just 9 months.
Growth Engines’ internal analysis of 37 ecommerce clients shows that businesses operating at Level 3 personalization maturity — meaning real-time one-to-one personalization — see an average 2.4 times higher revenue per visitor compared to those at Level 1. The jump from Level 2 to Level 3 alone delivers a median 18% conversion rate improvement.
Product Recommendations Are Still the Highest-Leverage AI Application
Personalized recommendations can drive up to 31% of ecommerce revenues for sessions where customers engage with them.
Real-time personalization delivers 20% higher conversion than batch processing, and multi-channel personalization generates 126 times higher user sessions when combining four or more channels.
The practical lesson: AI recommendations only perform at their potential when they are real-time and cross-channel. Static “customers also bought” blocks based on weekly batch processing are leaving conversion points on the table compared to models that update with every click and session.
Agentic Commerce: The Next Frontier
Gorgias’s State of Conversational Commerce 2026 report, based on a survey of 400 ecommerce decision-makers across North America and Europe, finds that 71% of brands are likely to hire employees dedicated to AI-related ecommerce functions within the next 12 months.
The emerging category to watch is agentic commerce — AI that does not just recommend but actually executes purchases on behalf of consumers. Several major platforms have already begun rolling out shopping agents capable of completing transactions autonomously. Stores whose product data, checkout APIs, and inventory feeds are structured for agent access will be positioned to capture this conversion channel. Stores that are not will be invisible to it.
Mobile Commerce and the Conversion Gap That Won’t Close Itself
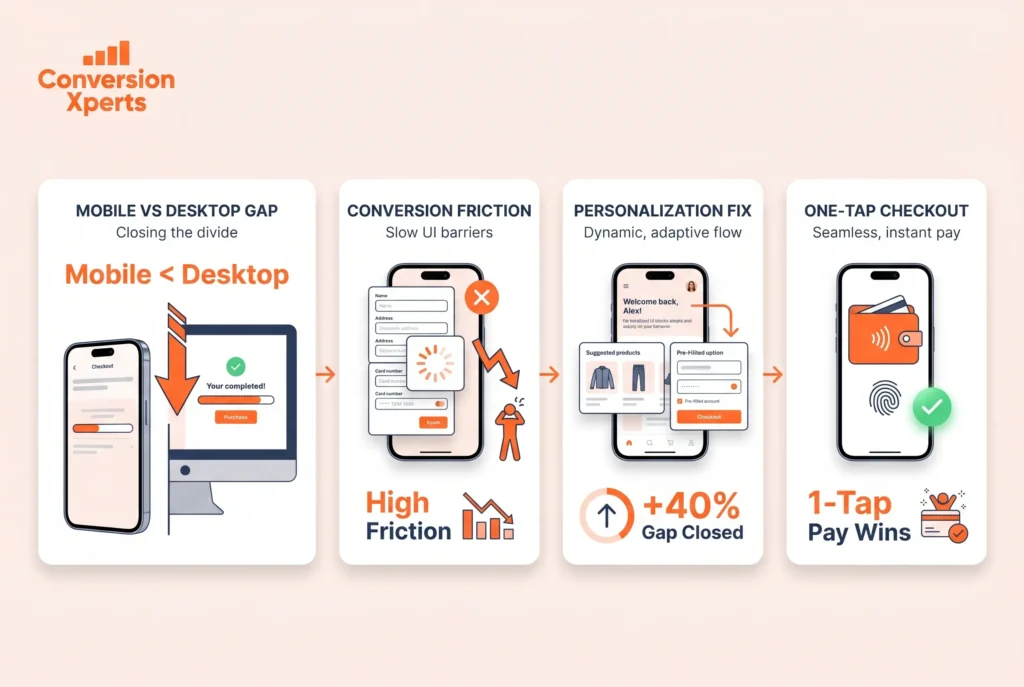
The mobile conversion problem is the most-discussed topic in ecommerce conversion rate news and, simultaneously, the most consistently under-addressed. Year after year, mobile drives the majority of ecommerce traffic. Year after year, mobile converts at roughly half the rate of desktop. And year after year, most stores make only incremental changes to the experience most of their shoppers actually have.
Why the Gap Persists in 2026
The reasons for the mobile conversion gap have been well-documented for years. What is different in 2026 is the granularity of data showing exactly which specific friction points cost the most conversions.
According to Baymard Institute’s ongoing mobile UX research, the top conversion killers on mobile remain: form fields requiring full text entry, multi-step checkout flows not optimized for thumb navigation, product images that fail to communicate detail on a five-inch screen, and trust signals that get pushed below the fold on smaller viewports.
Personalization closes roughly 40% of the conversion gap between mobile and desktop, making it the single most impactful investment for brands struggling with mobile conversion rates. This means a significant portion of the mobile gap is not a UX problem — it is a relevance problem. Mobile shoppers converting at lower rates are often seeing generic experiences while desktop shoppers benefit from more contextually relevant pages.
One-Tap Payments Are Table Stakes in 2026
Consumers expect easy, one-click payment options, and in 2026, digital wallets — Apple Pay, Google Pay, Shop Pay, and others — are everywhere. Stores not offering these options are losing conversions.
This is no longer a nice-to-have. Shoppers who have experienced one-tap checkout will not enter 16-digit card numbers on mobile keyboards for stores that haven’t implemented it. The data on checkout completion rates among mobile shoppers using digital wallets versus manual entry is unambiguous across every major platform reporting it.
Progressive Web Apps Still Deliver
Brands that invested in Progressive Web App (PWA) infrastructure between 2023 and 2025 are reporting sustained conversion advantages in 2026. The combination of app-like loading performance, push notification capability, and offline functionality removes the friction that drives mobile abandonment. For stores on platforms that support PWA deployment, it remains one of the highest-ROI mobile conversion investments available.
Checkout Optimization: Where Stores Are Still Bleeding Revenue
Cart abandonment is not a new problem. But it remains one of the most solvable conversion problems in ecommerce, and most stores are still leaving enormous revenue on the table by failing to address it systematically.
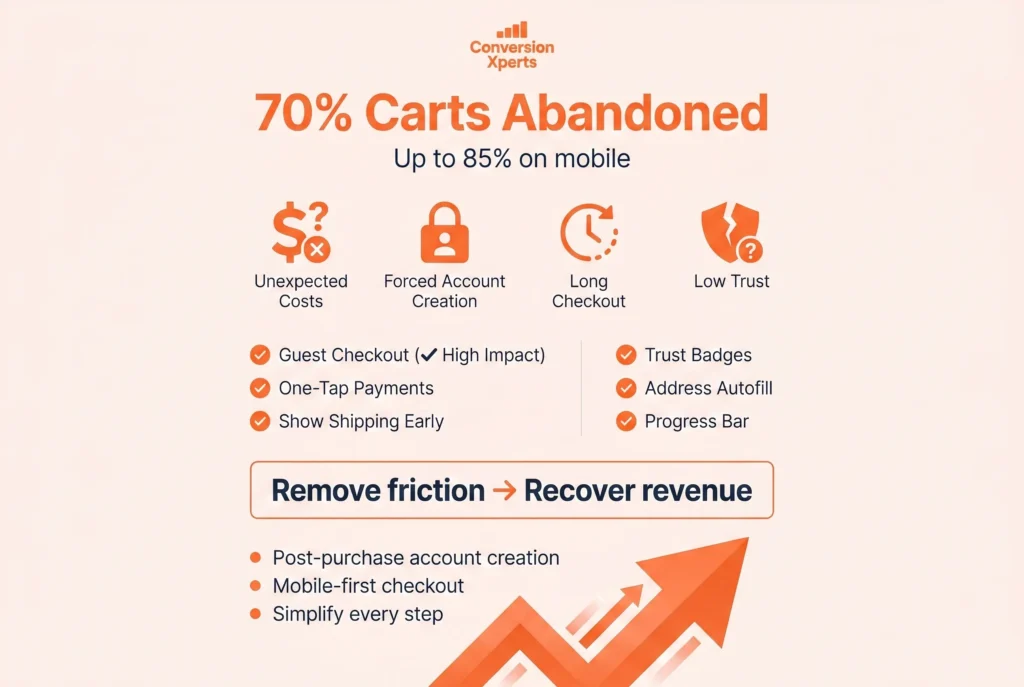
The 2026 cart abandonment baseline: approximately 70% of carts are abandoned across all industries. On mobile, that number climbs to 75% to 85%.
The Reasons Have Not Changed. The Solutions Have.
The top reasons shoppers abandon at checkout in 2026 data remain consistent with prior years: unexpected costs including shipping and tax at the top, followed by forced account creation, a checkout process perceived as too long or complex, insufficient trust signals near payment fields, and delivery timelines that don’t meet expectations.
What has changed is the toolkit available to address each of these — and how sophisticated the best implementations have become.
Guest Checkout Remains Non-Negotiable
Every year, every authoritative source on conversion rate ecommerce optimization repeats the same finding: requiring account creation before purchase destroys conversions. And yet stores continue building this friction into their checkout flows.
The smart 2026 approach is post-purchase account creation. Let the shopper complete their order as a guest. Then, on the order confirmation page — when trust is at its absolute peak and all their data is already in your system — offer one-click account creation. Account creation rates using this method run three to five times higher than pre-purchase prompts, and the customer relationship starts on a positive note rather than a friction point.
Checkout Optimization Tactics: Ranked by Impact
| Tactic | Conversion Impact | Implementation Effort |
Guest checkout as default | Very High | Low |
One-tap payment (Apple/Google Pay) | Very High on mobile | Low–Medium |
Shipping cost shown on product page | High | Medium |
Exit-intent offer with real incentive | Medium–High | Low |
Progress indicator in checkout | Medium | Low |
Address autocomplete | Medium | Low |
Trust badges near payment fields | Medium | Low |
Single-page checkout | High | High |
Real-time tax calculation | Medium | Medium |
BNPL options at checkout | High for $100–$500 tickets | Medium |
Buy Now Pay Later: Still Growing
BNPL accounted for 8% of Prime Day 2025 spend, up from 7.6% the prior year, reflecting continued consumer appetite for payment flexibility on higher-ticket items. For ecommerce stores selling products in the $100 to $500 range, BNPL integration consistently reduces checkout abandonment and increases average order value simultaneously — one of the rarer cases of a single tactic improving two metrics at once.
Ecommerce Conversion by Industry: 2026 Breakdown
The global average conversion rate tells you almost nothing useful. What matters is how you stack up against brands in your specific industry, traffic mix, and customer base. Here is the full 2026 picture by vertical.
Industry Conversion Rate Benchmarks: 2026
| Industry | Conversion Rate Range | Key Conversion Driver |
Food & Beverage | 4.5% – 6.0% | Repeat purchase, subscriptions, low risk |
Health & Pharma | 3.0% – 5.0% | Necessity buying, strong intent |
Beauty & Cosmetics | 3.0% – 4.0% | AR try-on, UGC, strong visual content |
Home & Garden | 1.5% – 2.8% | AR visualization, detailed imagery |
Apparel & Fashion | 2.0% – 3.0% | Size tools, returns policy, UGC |
Consumer Electronics | 0.8% – 1.4% | Detailed specs, financing, comparison |
Luxury & Jewelry | 0.8% – 1.2% | Trust, editorial content, clienteling |
B2B Ecommerce | 1.8% – 3.0% | Account pricing, quote flows, relationships |
The Americas lead regionally at 3.14%, and Food & Beverage leads all categories at 6.02%. A strong conversion rate can be achieved through personalization, a frictionless checkout, and optimized site speed.
Fashion and Apparel
Fashion consistently converts below the global average due to sizing anxiety and high return rates. The brands outperforming their category in 2026 are those deploying AI-powered size recommendation tools, displaying prominently free and easy returns above the fold, and filling product pages with diverse real-customer photography showing the item on bodies that match the shopper’s own.
Beauty and Cosmetics
Beauty outperforms the global average for one structural reason: products are visually demonstrable and purchase risk is relatively low. The 2026 conversion accelerator in this category is augmented reality try-on, with brands reporting conversion rates two to three times higher among shoppers who engage with AR features versus those who do not.
Consumer Electronics
Electronics is the hardest ecommerce conversion category because purchase decisions involve genuine complexity and high financial stakes. The brands winning on conversion here invest heavily in AI-powered product advisors that help shoppers navigate specifications, genuine side-by-side product comparison tools, expert review integration, and multiple financing options at checkout.
What Top-Performing Stores Are Doing Differently Right Now
High conversion rate ecommerce is not a mystery. The gap between stores converting at 5% and stores converting at 1.5% is almost entirely explained by a specific set of practices. Here is what the top tier is actually doing in 2026.
They Are Treating Personalization as Infrastructure, Not a Feature
The brands winning in 2026 aren’t just personalizing more — they’re personalizing smarter. They’re building unified data foundations, deploying AI that learns in real time, and treating personalization as a core conversion rate optimization strategy rather than a bolt-on feature.
This distinction matters. Adding a recommendation widget to a product page is personalization as a feature. Building a first-party data infrastructure that informs every touchpoint — homepage, email, paid retargeting, on-site search, and checkout — is personalization as infrastructure. The latter is what drives the 2.4 times revenue per visitor premium cited in the Growth Engines data above.
They Are Structured About Testing
Only 31% of companies have a structured approach to testing and optimization. The stores in the top conversion tier are almost all in that 31%. They run A/B tests continuously, with a documented hypothesis for every test, statistical significance requirements before calling results, and a backlog of tests prioritized by estimated impact.
Gut-feel optimization — changing button colors because someone read a blog post — is how average stores operate. Systematic, data-driven testing is how top-performing stores compound their conversion advantages over time.
They Have Eliminated Surprise From the Purchase Journey
Every point at which the shopper encounters unexpected information — a shipping cost revealed at checkout, a size that isn’t available in their preferred color, a delivery date longer than expected — is a conversion exit risk. Top-performing stores work relentlessly to surface all relevant information early in the browse journey, so that by the time a shopper reaches the checkout, they have already mentally completed the purchase and are simply executing it.
They Are Optimizing for AI Discovery
Following the Adobe data on AI-referred traffic converting at a 42% premium, the sharpest ecommerce operators are now actively optimizing their product content for AI shopping tools. This means detailed, accurate, and comprehensive product descriptions that answer the questions AI tools are likely to surface; structured data markup that makes product attributes machine-readable; and strong review ecosystems that give AI tools the social proof signals they use to assess product quality.