Average Ecommerce Conversion Rate by Industry: The Complete 2026 Benchmark Guide
What Is Ecommerce Conversion Rate and How Do You Calculate It
Your ecommerce conversion rate is the percentage of website visitors who complete a desired action, most commonly making a purchase. It is the single clearest indicator of whether your store is doing its job.
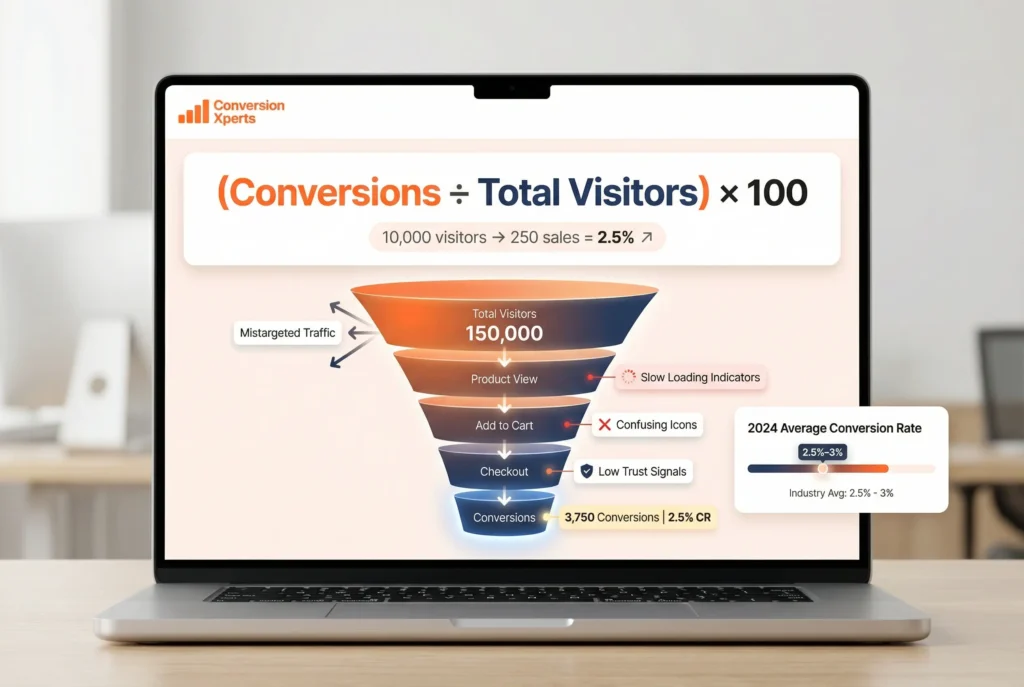
The formula is straightforward. Take the number of conversions, divide it by total visitors, and multiply by 100. So if 10,000 people visited your store and 250 bought something, your conversion rate is 2.5%.
What makes this number so powerful is what it tells you about your entire customer experience. A low conversion rate rarely means your product is bad. More often, it means something in your funnel is creating friction, whether that is a slow loading page, a confusing checkout, mistargeted traffic, or a lack of trust signals.
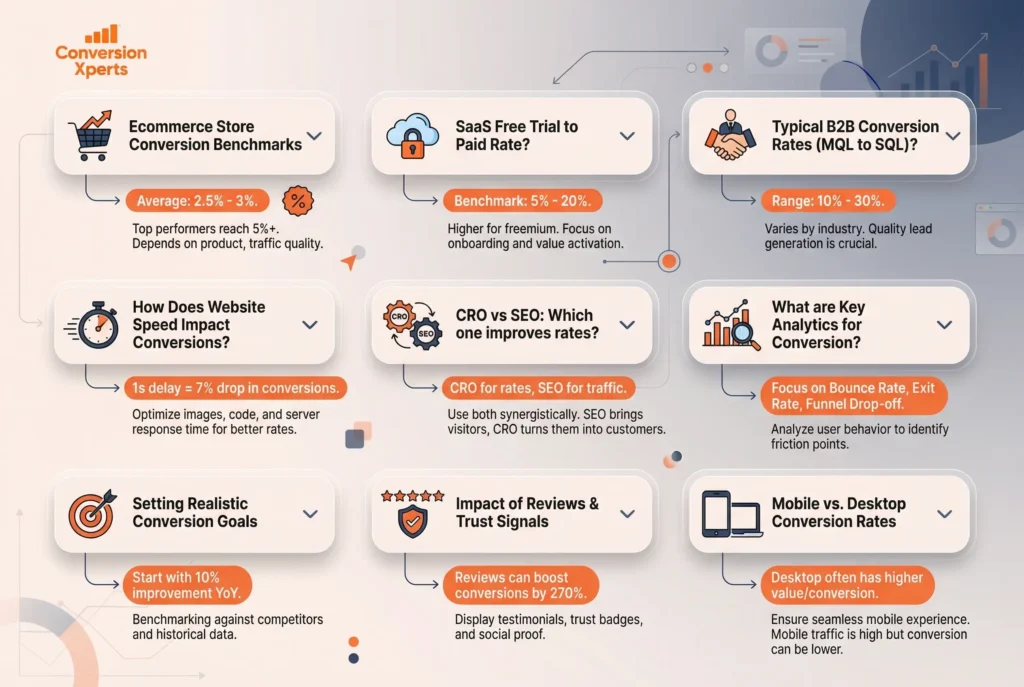
According to a 2024 report by Shopify, the global average ecommerce conversion rate sits between 2.5% and 3%. That is the broad benchmark everyone loves to quote. But the moment you zoom in by industry, device, or traffic source, the picture becomes much more nuanced and much more useful.
Why Industry Benchmarks Matter More Than the Global Average
Comparing your fashion store to a global average that includes industrial B2B suppliers is like comparing a sprint time to a marathon record. The number exists, but it tells you nothing actionable.
Industry-specific ecommerce benchmarks let you set realistic goals, identify genuine underperformance, and prioritize which CRO investments will have the most impact. They also tell you what “good” looks like for your specific customer, product price point, and purchase frequency.
Average Ecommerce Conversion Rate by Industry in 2025
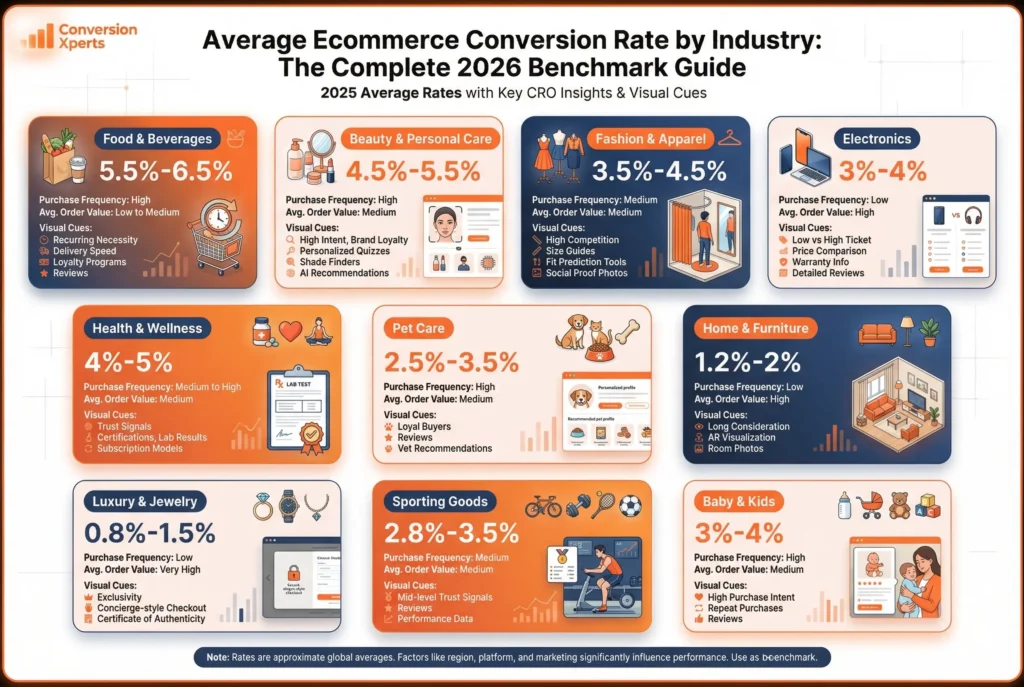
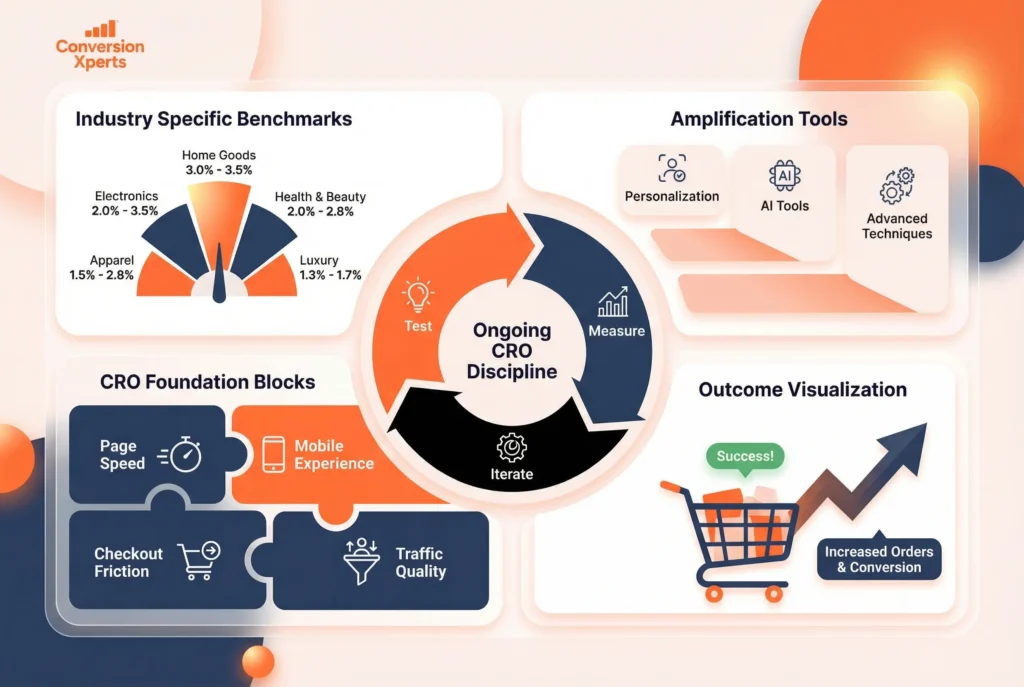
Here is a complete breakdown of ecommerce conversion rates by industry, drawn from data compiled by Dynamic Yield, ConvertCart, and Shopify across 2024 and 2025. These are not estimates. They reflect real aggregated data across thousands of ecommerce stores globally.
| Industry | Average Conversion Rate | Purchase Frequency | Avg. Order Value |
Food and Beverages | 5.5% to 6.5% | Very High | Low to Medium |
Beauty and Personal Care | 4.5% to 5.5% | High | Medium |
Fashion and Apparel | 3.5% to 4.5% | High | Medium |
Electronics | 3.0% to 4.0% | Medium | High |
Pet Care | 2.5% to 3.5% | Medium | Low to Medium |
Home and Furniture | 1.2% to 2.0% | Low | High |
Luxury and Jewelry | 0.8% to 1.5% | Very Low | Very High |
Health and Wellness | 4.0% to 5.0% | Medium to High | Medium |
Sporting Goods | 2.8% to 3.5% | Medium | Medium |
Baby and Kids | 3.0% to 4.0% | High | Medium |
Now, let us go deeper on each one.
Food and Beverages: 5.5% to 6.5%
Food and beverage brands consistently top the ecommerce conversion rate charts, and the reason is simple. People need food. It is not a discretionary purchase. It is a recurring necessity.
This creates a customer who already knows what they want, trusts the category, and is motivated to complete the transaction. Low average order values also reduce the mental friction of the purchase decision. Spending $30 on a grocery order feels much lower risk than spending $300 on a jacket.
According to data from Statista in 2024, online food and grocery shopping adoption has grown by over 40% since 2020, with repeat purchase rates significantly higher than any other consumer category.
What actually drives conversions in this space is delivery speed, transparent pricing including delivery fees, loyalty and subscription programs, and customer reviews on individual product pages. If you are in the food space and your conversion rate is below 4%, your friction is almost certainly in the checkout, the delivery cost display, or the trust signals on your product pages.
Beauty and Personal Care: 4.5% to 5.5%
Beauty is a high-conversion category because the purchase intent is usually strong when someone lands on your page. They have likely already done their research through YouTube reviews, Instagram recommendations, or friends. By the time they visit your store, they are close to a decision.
The challenge in beauty is brand loyalty. Customers in this space develop strong preferences. A customer who loves a particular skincare brand will not switch easily, which means your job is to get them to try you once and then keep them coming back.
Personalization is the biggest lever in beauty CRO. According to a 2024 McKinsey study, 76% of consumers say personalized communication is a key factor in their purchase decision, and beauty customers over-index on this preference. Quizzes that match products to skin type, shade finders, and AI-powered recommendation engines have all been shown to lift beauty ecommerce conversion rates by 15% to 30%.
Fashion and Apparel: 3.5% to 4.5%
Fashion is one of the most competitive ecommerce categories globally. According to Capital One Shopping research, clothing and apparel accounts for over 20% of all US ecommerce purchases. The volume is enormous, but so is the competition.
The main barrier to conversion in fashion is the inability to physically try on the product. Size uncertainty is the number one reason for cart abandonment in fashion, which is why brands that invest in detailed size guides, fit prediction tools, and generous return policies consistently outperform their peers on conversion rate.
Social proof also plays a massive role. User-generated content, specifically real customers posting photos wearing the product, converts far better than studio photography because it gives potential buyers a realistic sense of how the item looks in the real world.
Localization is also crucial for global fashion brands. Sizing conventions differ between Pakistan, the US, and Europe. Currencies, payment preferences, and delivery expectations differ. A store that adapts to local context will always outperform one that treats all markets the same.
Electronics: 3.0% to 4.0%
Electronics presents a split personality in ecommerce. Low-ticket accessories like phone cases, cables, and earbuds convert at much higher rates because the decision is low-risk. High-ticket items like laptops and smartphones require extensive research before the buyer commits.
This is why electronics stores tend to have longer consideration cycles and why content marketing, particularly in-depth reviews, comparison pages, and video demonstrations, is so valuable for CRO in this space.
Price comparison is rampant in electronics. Buyers will check three to five stores before purchasing. Offering price-match guarantees, visible warranty information, and clear return policies addresses the main objections that prevent someone from completing a purchase on your site versus a competitor.
Health and Wellness: 4.0% to 5.0%
Health and wellness ecommerce has exploded since 2020. Supplements, fitness equipment, mental wellness tools, and organic food products all fall into this category. The conversion rates are strong because purchase intent is high and customers often return regularly for replenishment.
Trust is the defining factor in health CRO. Certifications, lab testing results, clinical backing, and medical professional endorsements all meaningfully increase conversion rates in this space. Customers are putting these products into their bodies. They need more than a good product photo.
Subscription models convert especially well in health and wellness. According to ReCharge’s 2024 subscription commerce report, subscription-based health products show 30% to 40% higher lifetime value compared to one-time purchase models, which also improves the economics of your CRO investment.
Pet Care: 2.5% to 3.5%
Pet care buyers are intensely loyal to products their pets accept well. The challenge is getting that first conversion. Once a customer finds food their dog loves or litter their cat tolerates, switching costs are high, which is actually great news for retention but means acquisition-driven conversion is harder.
Reviews and community endorsements drive conversions more than any other tactic in pet care. If other pet owners are saying it works, that carries enormous weight. Veterinarian recommendations, safety certifications, and ingredient transparency are also major trust drivers.
Home and Furniture: 1.2% to 2.0%
Home and furniture has the longest consideration cycle of any consumer ecommerce category. People research for weeks before buying a sofa. They measure rooms, compare finishes, and imagine how the piece will look in their space. A 1.5% conversion rate in this context is not a sign of failure. It is the reality of selling high-ticket, visually dependent products online.
The CRO opportunity in home and furniture is massive. Augmented reality tools that let customers visualize furniture in their own rooms have been shown to lift conversion rates by up to 40% in this category, according to data from Shopify Partners in 2024. Detailed room photography showing products in real interior settings also consistently outperforms white-background product shots.
Luxury and Jewelry: 0.8% to 1.5%
Luxury is the lowest-converting category in ecommerce, and it is supposed to be. Exclusivity is part of the value proposition. A luxury brand that converts at 5% is probably not communicating luxury correctly.
The conversion levers in luxury are different from any other category. It is not about speed or simplicity. It is about trust, authenticity, and the feeling of being a valued customer. High-resolution product photography, certificate of authenticity documentation, white-glove customer service, and concierge-style checkout experiences all matter more than A/B testing button colors.
SaaS Conversion Rates: What the Data Actually Says
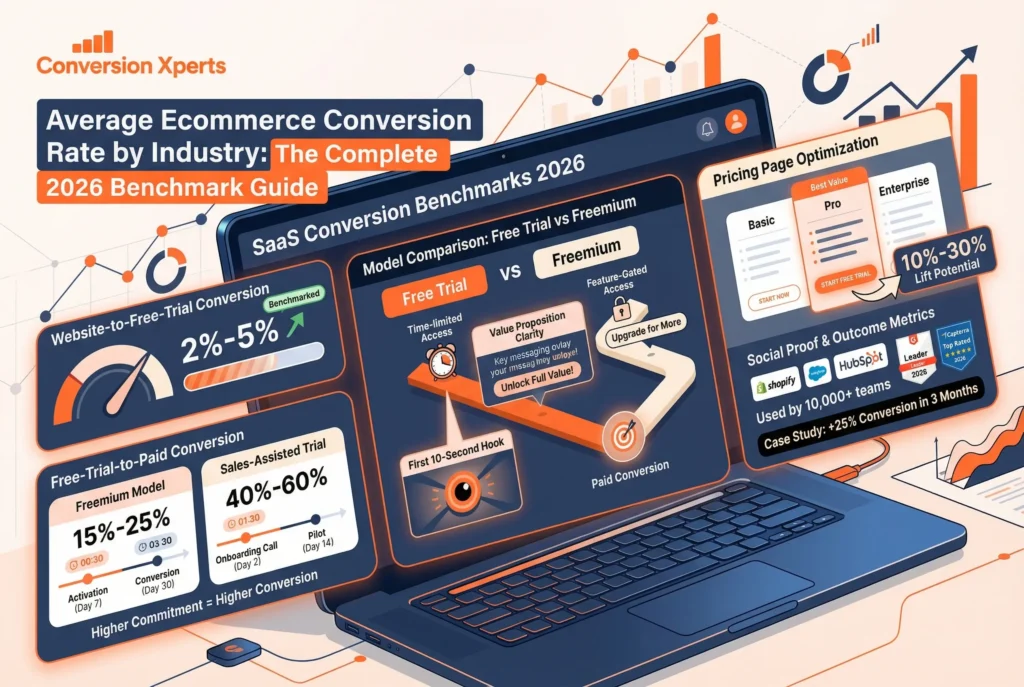
SaaS conversion rates operate on a completely different model than product ecommerce. The primary metric for SaaS CRO is converting a website visitor into a free trial or demo signup, and then converting that trial into a paying customer.
According to data from Totango’s 2024 SaaS benchmark report, the average website to free trial conversion rate for SaaS products is between 2% and 5%. The free trial to paid conversion rate varies widely: around 15% to 25% for freemium models and 40% to 60% for free trials with sales-assisted follow-up.
What Drives SaaS Conversion Rates Up
The biggest driver of SaaS conversion rate is the clarity of your value proposition. If a visitor cannot understand what your product does and why it matters within the first ten seconds, they will leave. This is not a design problem. It is a messaging problem.
Social proof in SaaS takes the form of case studies, logos of recognizable customers, G2 or Capterra ratings, and specific outcome metrics from real users. “Used by 10,000 teams” converts better than “industry-leading solution.”
Pricing page design is one of the highest-leverage CRO opportunities in SaaS. According to a 2024 study by Price Intelligently, companies that revisit their pricing page design and structure see an average 10% to 30% lift in trial signups without changing the underlying price.
Free Trial vs Freemium: Which Converts Better
Free trials with a hard end date convert at higher rates than freemium because they create urgency. But freemium models produce more activated users and often result in higher long-term revenue because the barrier to getting started is essentially zero. The right model depends entirely on your product’s value delivery timeline. If users can feel the value within 48 hours, a free trial works. If it takes weeks or months to demonstrate value, freemium is usually a better path.
B2B Conversion Rates and Why They Work Differently
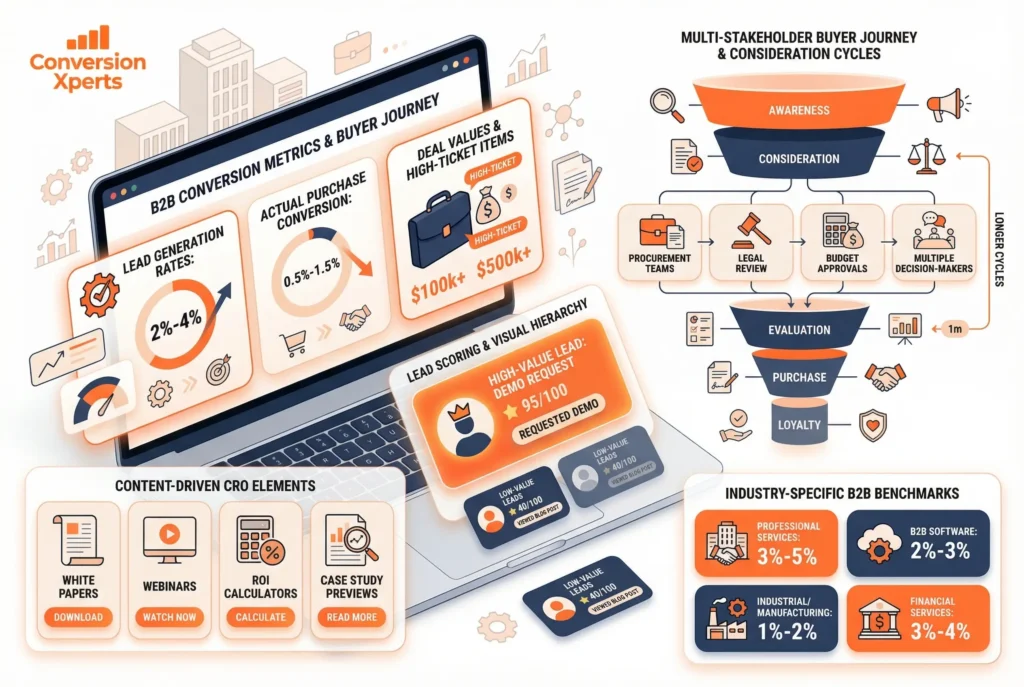
B2B conversion rates are the most misunderstood benchmark in digital marketing. People often panic when they see rates of 1% to 3% on their B2B website, not realizing that a single converted deal might be worth tens of thousands of dollars.
According to Demand Gen Report’s 2024 B2B Buyer Survey, the average B2B website conversion rate across all verticals sits between 2.0% and 4.0% for lead generation actions like demo requests, form fills, and content downloads. Actual purchase conversion rates are much lower, typically 0.5% to 1.5%, but the deal values offset this completely.
What Makes B2B CRO Different
In B2B, the buyer is rarely one person. Purchasing decisions involve multiple stakeholders, procurement teams, legal review, and budget approval cycles that can take weeks or months. This means CRO in B2B is about capturing qualified interest at each stage of a long journey, not just pushing someone to click “buy now.”
Content plays a dramatically larger role in B2B CRO than in consumer ecommerce. Whitepapers, case studies, webinars, and ROI calculators all convert better than promotional copy because they address the rational, risk-averse mindset of a business buyer.
Lead scoring is also essential in B2B. Not all conversions are equal. A demo request from a Director of Operations at a 500-person company is worth infinitely more than a newsletter signup from a student. Your CRO strategy should be designed to attract and convert the right kind of lead, not just more leads.
B2B Conversion Rate Benchmarks by Industry
According to Word Stream and HubSpot data from 2024, B2B conversion rates vary significantly by sector. Professional services typically convert at 3% to 5% for lead generation. B2B software sits around 2% to 3%. Industrial and manufacturing B2B tends to be 1% to 2%. Financial services B2B often achieves 3% to 4% on targeted landing pages.
Why Your Conversion Rate Might Be Lower Than the Benchmark
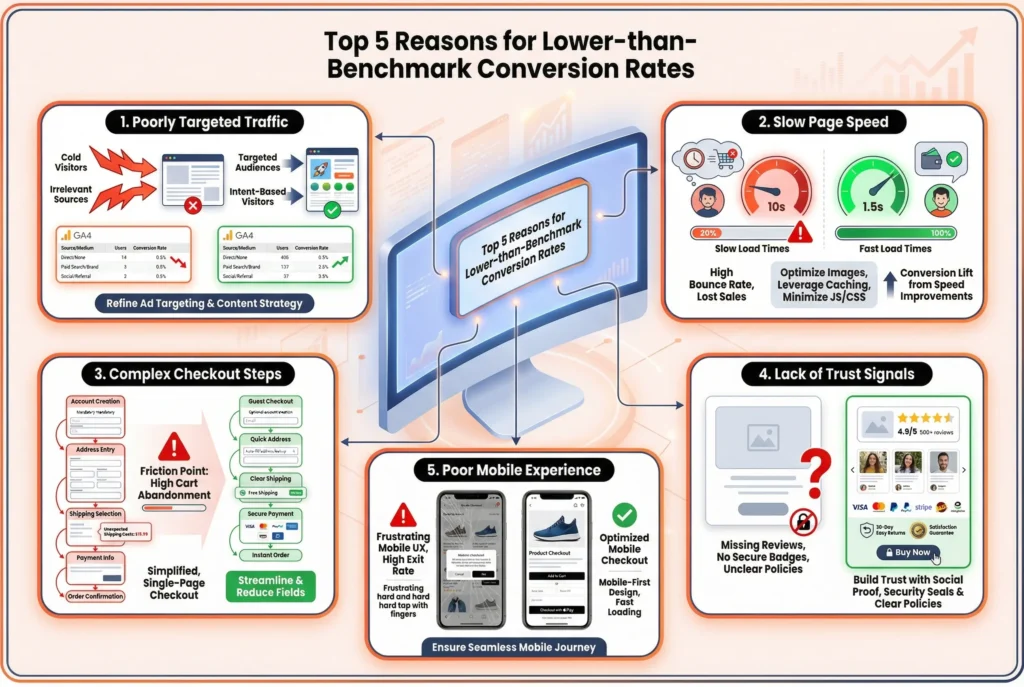
If you are measuring your store against the ecommerce benchmarks above and coming up short, the problem is almost always in one of five areas.
Traffic Quality Is the Problem, Not the Store
This is the most common CRO mistake. Companies spend months redesigning their checkout process when the real issue is that their traffic is poorly targeted. If you are running broad awareness ads and sending cold traffic directly to a product page, a 1% conversion rate is not a problem. It is the expected outcome.
Before you optimize your store, audit your traffic sources. Ask whether the people arriving at your site have the purchase intent your content assumes they do. Google Analytics 4 allows you to segment conversion rates by traffic source, and the differences are often dramatic.
Your Page Speed Is Destroying Conversions
According to a 2024 Deloitte study, a 0.1-second improvement in page loading speed improved retail ecommerce conversion rates by 8.4% and average order value by 9.2%. That is not a rounding error. That is a massive lift from a technical fix.
Google’s Core Web Vitals data shows that pages loading in under 2 seconds convert at rates 2 to 3 times higher than pages taking over 4 seconds. Every second you add to your load time costs you real orders.
Your Checkout Has Too Many Steps
The Baymard Institute’s 2024 large-scale checkout usability study found that the average cart abandonment rate across ecommerce is 70.19%. The top reasons are unexpected shipping costs (48%), being forced to create an account (24%), and a checkout process that was too long or complicated (22%).
The fix is not complicated. Show shipping costs early. Offer guest checkout. Reduce the number of form fields to the absolute minimum required to complete the transaction. Each step you remove from checkout increases your conversion rate.
You Are Not Building Trust Fast Enough
First-time visitors from cold traffic start with zero trust in your brand. Trust has to be earned within seconds through visible signals: customer reviews with photos, secure payment badges, clear return policies, recognizable payment methods, and professional design.
In markets like Pakistan, the Middle East, and Southeast Asia, cash on delivery options and local payment methods like JazzCash or Easypaisa dramatically increase conversion rates because they align with how customers already prefer to pay.
Your Mobile Experience Is an Afterthought
According to Statista, over 76% of ecommerce traffic in 2024 came from mobile devices. But mobile conversion rates globally still lag desktop by a significant margin because most stores are designed on desktops and adapted for mobile rather than built mobile-first.
If your mobile checkout requires zooming in, has buttons too small to tap comfortably, or loads product images slowly on cellular connections, you are losing a large share of your potential conversions before the customer even sees your add-to-cart button.
CRO Strategies That Genuinely Move Your Conversion Rate Up 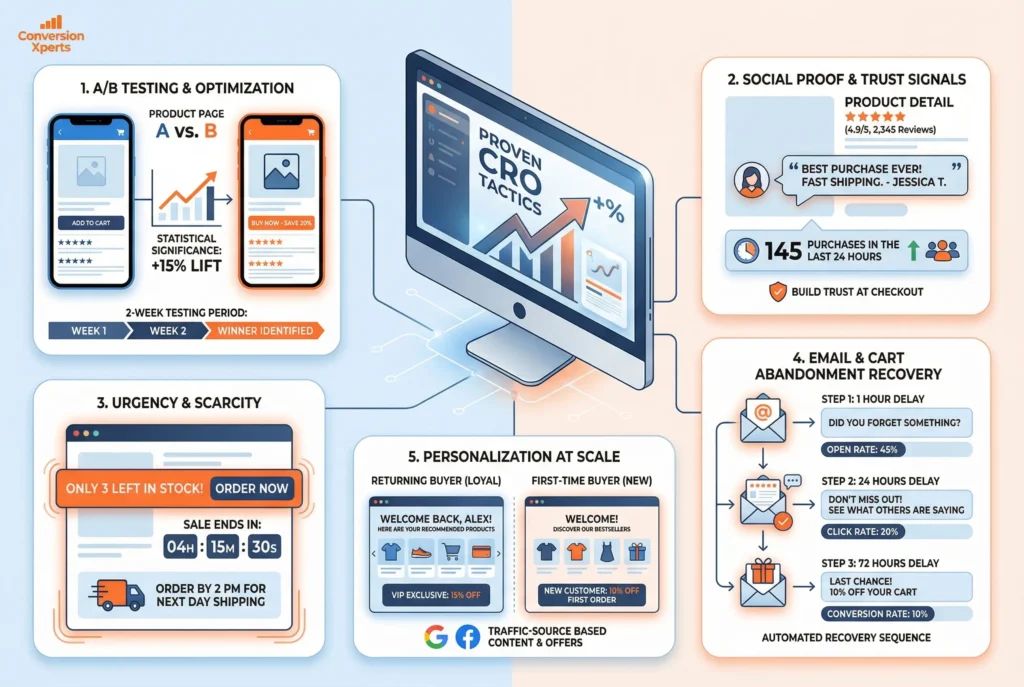
This is where most articles stop at generic advice. We are going deeper with specific, proven CRO tactics tied to real data.
A/B Testing: The Foundation of Serious CRO
A/B testing is the process of running two versions of a page simultaneously to determine which one converts better. It sounds simple but is frequently done incorrectly in ways that produce misleading results.
The most common A/B testing mistake is ending tests too early. You need statistical significance before declaring a winner. For most ecommerce stores, that means running a test for at least two full weeks and reaching a minimum of 1,000 conversions per variation. Tests ended after a few days with small sample sizes will steer you in the wrong direction.
High-impact things to test include the headline on your product page, the color and copy of your add-to-cart button, the placement of customer reviews, product image order, and whether showing or hiding the price before clicking improves or reduces conversions.
Social Proof Placement Changes Everything
Putting your customer reviews at the bottom of the page where only scrollers see them is a wasted asset. Moving review stars to appear directly under your product title, adding in-line quote testimonials near your add-to-cart button, and showing a real-time count of people who bought the product in the last 24 hours all create social proof at the exact moment of purchase hesitation.
According to a 2024 BrightLocal consumer survey, 87% of consumers read online reviews for local businesses and 79% trust online reviews as much as personal recommendations. That number is even higher for ecommerce purchases where the customer cannot physically inspect the product.
Urgency and Scarcity: Use Them Honestly
Real urgency converts. Fake urgency destroys trust. A countdown timer for a limited-time offer that resets every time someone visits is not urgency. It is a conversion gimmick that customers recognize and resent.
Showing genuine low stock levels, real sale end dates, and actual shipping cutoffs for delivery by a specific date are all legitimate urgency signals that increase conversion rates without damaging your brand credibility.
Email and Cart Abandonment Recovery
Your CRO strategy does not end when someone leaves your site. Abandoned cart email sequences are among the highest-ROI tools in ecommerce marketing. According to Klaviyo’s 2024 benchmark report, abandoned cart emails generate an average of 5% to 15% recovery rate, meaning for every 100 people who abandon their cart, between 5 and 15 will come back and purchase after receiving a well-designed email sequence.
The most effective abandoned cart sequences send the first email within 1 hour of abandonment, a second email after 24 hours with a social proof focus, and a third email after 72 hours with a small incentive if your margins allow it.
Personalization at Scale
The biggest CRO gains in 2025 are coming from personalization technology. Showing returning customers products related to what they previously viewed, tailoring the homepage based on the visitor’s traffic source, and using dynamic pricing or offer display based on customer segment are all producing measurable conversion lifts.
You do not need a six-figure technology stack to start personalizing. Even basic segmentation in a tool like Klaviyo or Omnisend that shows different email content to first-time buyers versus returning customers produces meaningful results.
Ecommerce Benchmarks by Device, Traffic Source, and Geography
Understanding the average ecommerce conversion rate by industry is only the beginning. The same store can show wildly different conversion rates depending on how and where the visitor arrives.
Conversion Rate by Device
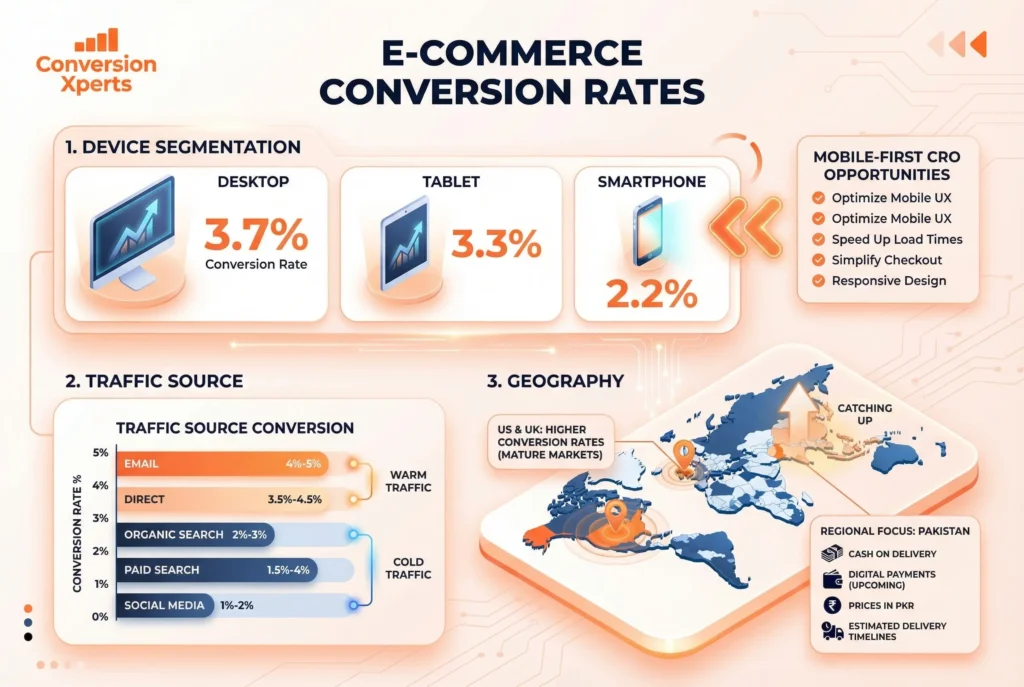
Desktop visitors still convert at higher rates than mobile visitors on most ecommerce platforms, even in 2025. According to Statista’s 2024 ecommerce data, desktop converts at approximately 3.7%, tablets at 3.3%, and smartphones at 2.2% on average. The gap exists primarily because desktop checkouts are easier to navigate, payment information is faster to enter, and screen real estate allows for more convincing product presentation.
However, mobile traffic represents the majority of visits. Closing the gap between mobile and desktop conversion rates is the single highest-leverage CRO opportunity for most ecommerce businesses today.
Conversion Rate by Traffic Source
Not all traffic converts equally. According to Google Analytics benchmark data aggregated by Wolfgang Digital in 2024, email marketing converts at the highest rate, typically 4% to 5%, because email traffic is already warm and pre-qualified. Direct traffic converts at 3.5% to 4.5% because these are people who already know your brand. Organic search converts at 2% to 3%. Paid search varies widely from 1.5% to 4% depending on keyword intent. Social media typically converts at 1% to 2% because it is mostly cold or awareness traffic.
Conversion Rate by Geography
Global ecommerce benchmarks vary significantly by region. The United States and United Kingdom typically see higher average conversion rates due to higher ecommerce maturity, trusted payment infrastructure, and fast delivery expectations being well met. Southeast Asia and South Asia, including Pakistan, are experiencing rapid ecommerce growth with conversion rates that are catching up as mobile payment adoption accelerates and logistics infrastructure improves.
For Pakistani ecommerce brands specifically, offering cash on delivery alongside digital payment options, displaying prices in Pakistani Rupees prominently, and showing estimated delivery timelines by city all have meaningful positive impacts on conversion rate.
The Hidden Conversion Killers Most Stores Ignore
Most ecommerce businesses audit the obvious things: checkout flow, page speed, product photography. But there is a second layer of conversion problems that rarely gets talked about, and it is quietly draining revenue from stores every single day.
Product Descriptions That Describe Instead of Sell
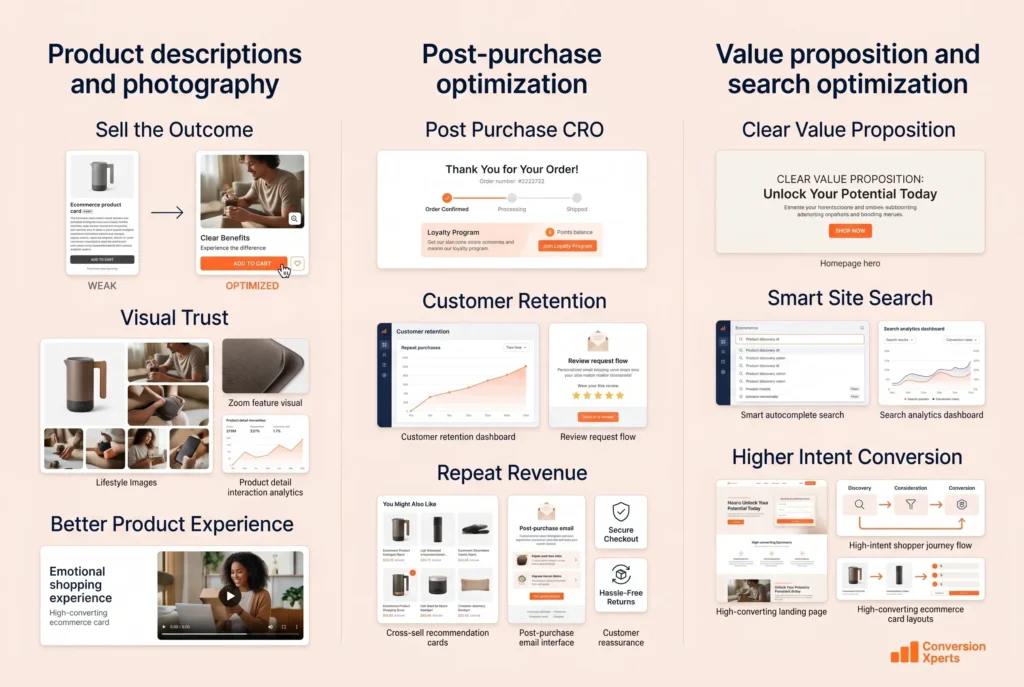
Most product descriptions tell buyers what a product is. The ones that convert tell buyers what it does for them. There is a meaningful difference between “100% merino wool sweater, slim fit, available in 6 colors” and “Stays warm without the bulk. The kind of sweater you wear from the office straight to dinner without thinking twice about it.”
Customers do not buy features. They buy outcomes, feelings, and identities. If your product descriptions are still written like manufacturer spec sheets, rewriting them in the customer’s language with a focus on life improvement rather than product attributes is one of the highest-leverage, zero-cost CRO changes you can make.
Weak Product Photography in a Visual Purchase Environment
Blurry images, flat lighting, and single-angle shots are silent conversion killers. Customers shopping online cannot touch, smell, or try on your product. They rely entirely on the visual experience you give them to make a purchase decision. A buyer who feels uncertain about what they are getting will not purchase.
The stores that convert best in fashion, home goods, and beauty all share one thing: they invest in photography that removes visual uncertainty. Multiple angles, lifestyle context shots showing the product in use, zoom functionality that lets buyers inspect texture and detail, and short video clips all close the perception gap that kills conversions in visually dependent categories.
No Post-Purchase Reassurance Triggering Repeat Visits
Most CRO strategies focus entirely on the first conversion. Very few think about the moment immediately after a purchase, which is actually one of the most powerful opportunities to set up the second one.
The post-purchase page and confirmation email are two of the most-read pieces of content your store produces, and most brands use them only to confirm the order. Brands that use post-purchase moments to cross-sell complementary products, invite customers into loyalty programs, ask for a review with an incentive, or simply reinforce the customer’s good decision with reassuring copy see measurably higher repeat purchase rates and lower return rates.
Lack of a Clear Value Proposition Above the Fold
If a first-time visitor arrives on your homepage or product page and cannot immediately answer three questions: what you sell, why it is worth buying from you specifically, and what they should do next, you have already lost a significant portion of potential conversions before they even scroll.
Your value proposition is not your tagline. It is not a clever brand statement. It is a direct, specific answer to the question every visitor is silently asking: why should I buy this from you instead of Amazon, instead of a local store, instead of doing nothing at all? That answer needs to be visible, readable, and compelling within the first three seconds of landing on your page.
Site Search That Returns Poor Results
This one surprises most store owners. Site search users convert at 2 to 3 times the rate of non-search users, according to data from Econsultancy, because they already know what they want and are actively trying to find it. A customer using your search bar is the most purchase-ready visitor your site will see.
When that search returns irrelevant results, shows a “no results found” page for legitimate product queries, or fails to handle misspellings, you are turning away your highest-intent visitors at the exact moment they are ready to buy. Auditing your site search data, fixing the queries that return poor results, and adding synonym support and autocomplete to your search experience often produces an immediate, measurable lift in conversion rate.
How Seasonal Trends Affect Your Ecommerce Conversion Rate
Your conversion rate is not a flat line. It breathes with the calendar, and understanding that rhythm is what separates stores that plan for peaks from those that are perpetually caught off guard.
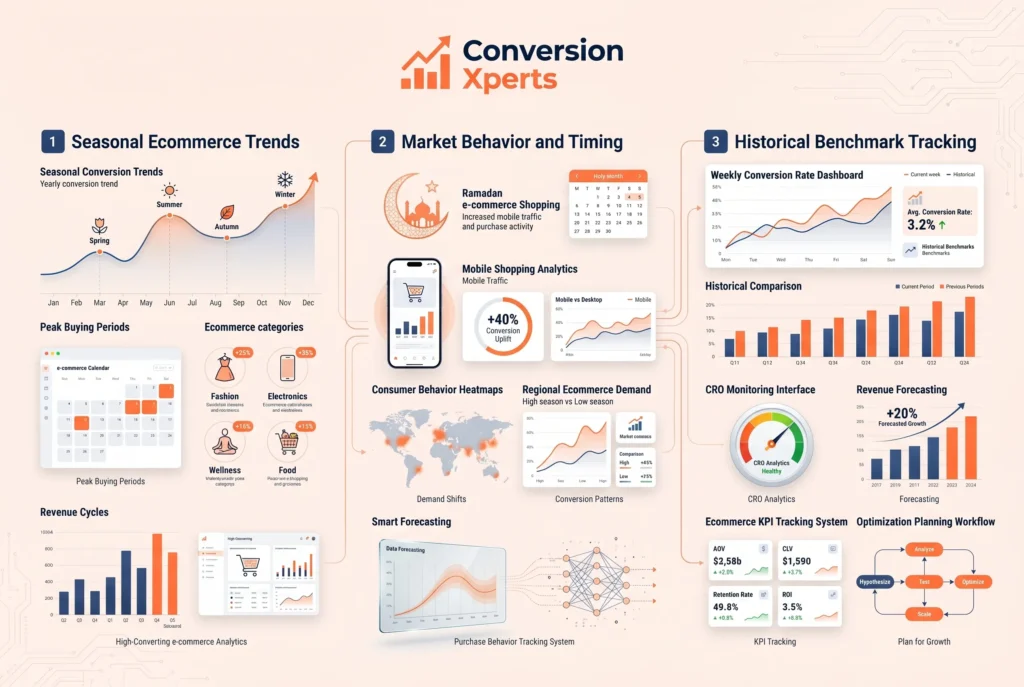
Every industry has a conversion season. Fashion peaks around back-to-school periods and the transition between summer and fall. Electronics surges around major gifting events and new product launch cycles. Health and wellness spikes in January as resolution-setting drives purchase behavior, and again in spring. Food and beverage conversion rates often increase during Ramadan for Pakistani and broader South Asian markets where online grocery and food delivery behavior shifts significantly.
The practical implication is this: your benchmark is not static. A 2.5% conversion rate in July might represent strong performance for your category. The same number in November during your peak season might indicate a serious underperformance problem requiring immediate attention.
The brands that use seasonal conversion data most effectively are the ones that build a historical benchmark map for their own store. They track their conversion rate weekly, compare it against the same period in prior years, and use that comparison to catch problems early and amplify things that are working well.
The Role of Customer Lifetime Value in Conversion Strategy
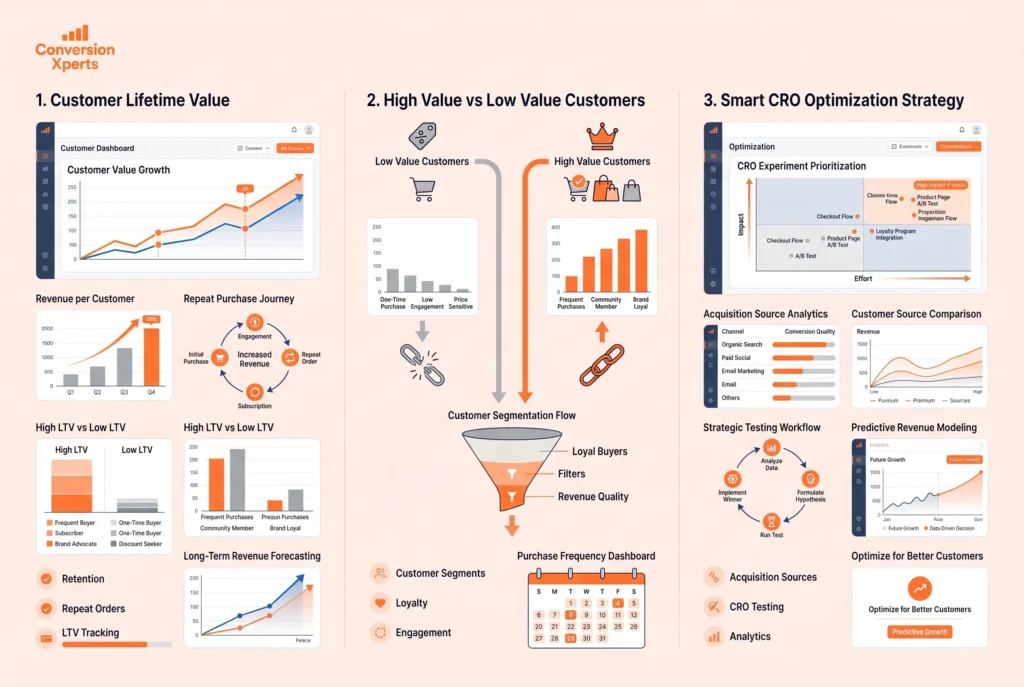
One of the most dangerous ways to think about conversion rate optimization is to treat every conversion as equal. They are not. And failing to understand the difference can lead you to optimize for the wrong customers entirely.
Customer lifetime value is the total revenue a customer generates across all their purchases with your brand over time. A customer who converts once at a $25 average order value and never returns has a different business impact than a customer who converts at the same $25 but comes back monthly for two years.
This matters for CRO because some of your conversion optimization tactics attract high-LTV customers and some attract low-LTV ones. Heavy discount promotions, for example, tend to drive high volume conversions from price-sensitive buyers who may never return at full price. In-depth product content, expert buying guides, and community features tend to attract customers who are more invested in the category and more likely to return.
Knowing your LTV by customer segment and by acquisition source changes how you prioritize CRO experiments. You start optimizing not just for more conversions but for more conversions from the customers who are actually worth the most to your business long-term.
How to Set Realistic Conversion Rate Goals for Your Store
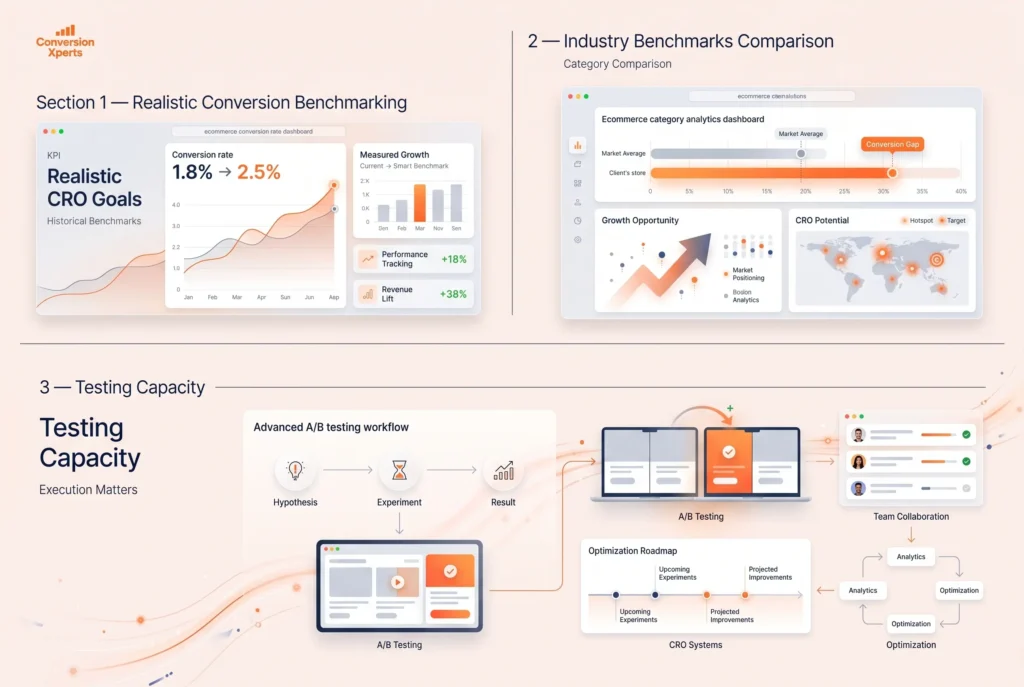
Most ecommerce businesses set conversion rate goals the wrong way. They look at the global average of 2.5% to 3%, note they are at 1.8%, and target 3% as their goal. That approach is almost meaningless because it ignores where you are starting from, what your industry ceiling looks like, and what specific levers you have available to pull.
A more practical approach to goal-setting starts with your own historical data. If your store has been converting at 1.8% for the past six months across consistent traffic volumes, a realistic near-term goal is 2.2% to 2.5%. That is a 20% to 40% improvement in conversion rate, which represents a meaningful revenue increase without requiring any additional traffic.
The second input is your industry benchmark range. If your category converts at 3.5% to 4.5% on average and you are at 1.8%, you know there is significant room to grow and you can set a more ambitious target with confidence. If you are already at 4.2% in a category that averages 4.5%, your marginal gains will be smaller and harder to achieve.
The third input is your testing capacity. A goal of improving conversion rate by 30% over the next quarter is only realistic if you have the traffic volume to run meaningful A/B tests, the tools to analyze behavior data, and the team bandwidth to implement and iterate on changes. Goals disconnected from execution capacity are just wishes.
When to Stop Optimizing and Start Scaling
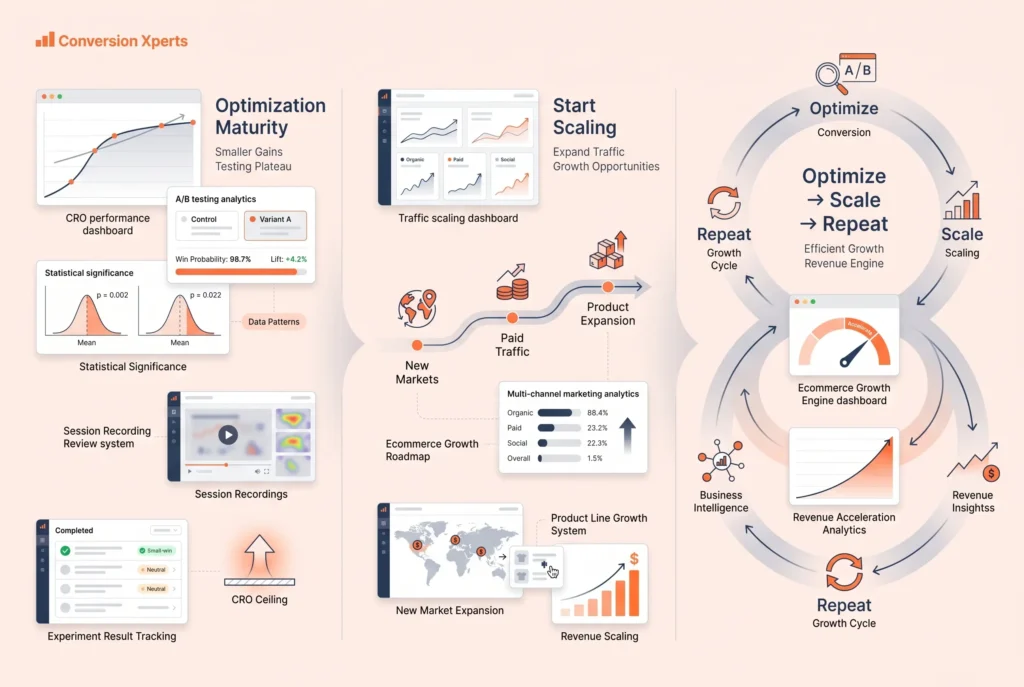
Conversion rate optimization has a law of diminishing returns. At some point, your store reaches a conversion rate that is close to what is achievable given your product, price point, and audience. Continuing to invest heavily in CRO beyond that point produces smaller and smaller gains for the same effort.
Knowing when you have reached that point is as important as knowing how to optimize in the first place.
The signal that you are approaching optimization maturity is not a specific conversion rate number. It is when your A/B tests consistently produce small, statistically insignificant improvements, when your session recording reviews are surfacing the same patterns you have already addressed, and when your traffic quality and product-market fit are the binding constraints rather than your conversion experience.
At that point, the highest-leverage move is often to shift investment from optimization to scaling. Get more of the right traffic to a store that already converts well. Expand into new markets, new traffic channels, or new product lines rather than squeezing the last half a percentage point from a funnel that is already performing near its ceiling.
The best ecommerce operators use CRO to maximize the efficiency of their existing traffic and then scale aggressively once that efficiency is established. The cycle then repeats: scale traffic, identify new conversion constraints, optimize, then scale again.