B2B Conversion Rate Benchmarks 2026: What You Need to Know to Outperform
What Is a B2B Conversion Rate?
A B2B conversion rate tells you what percentage of visitors, leads, or prospects take a specific action at any stage of your sales funnel. That action could be filling out a contact form, asking for a demo, starting a free trial, or signing a contract.
The formula is simple:
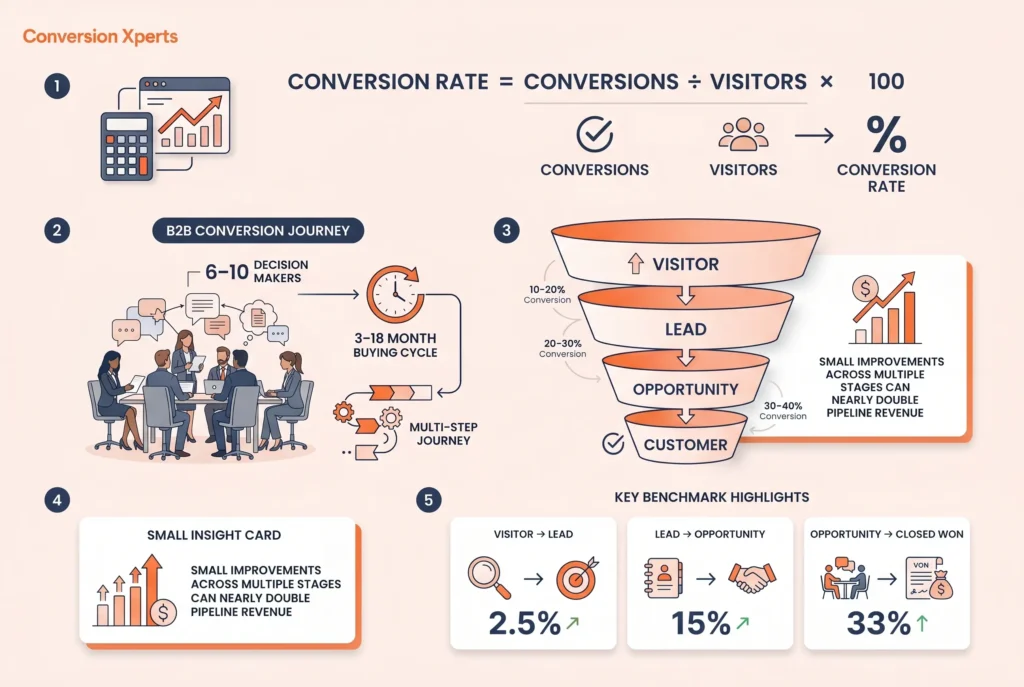
Conversion Rate = (Number of Conversions divided by Total Visitors or Leads) multiplied by 100
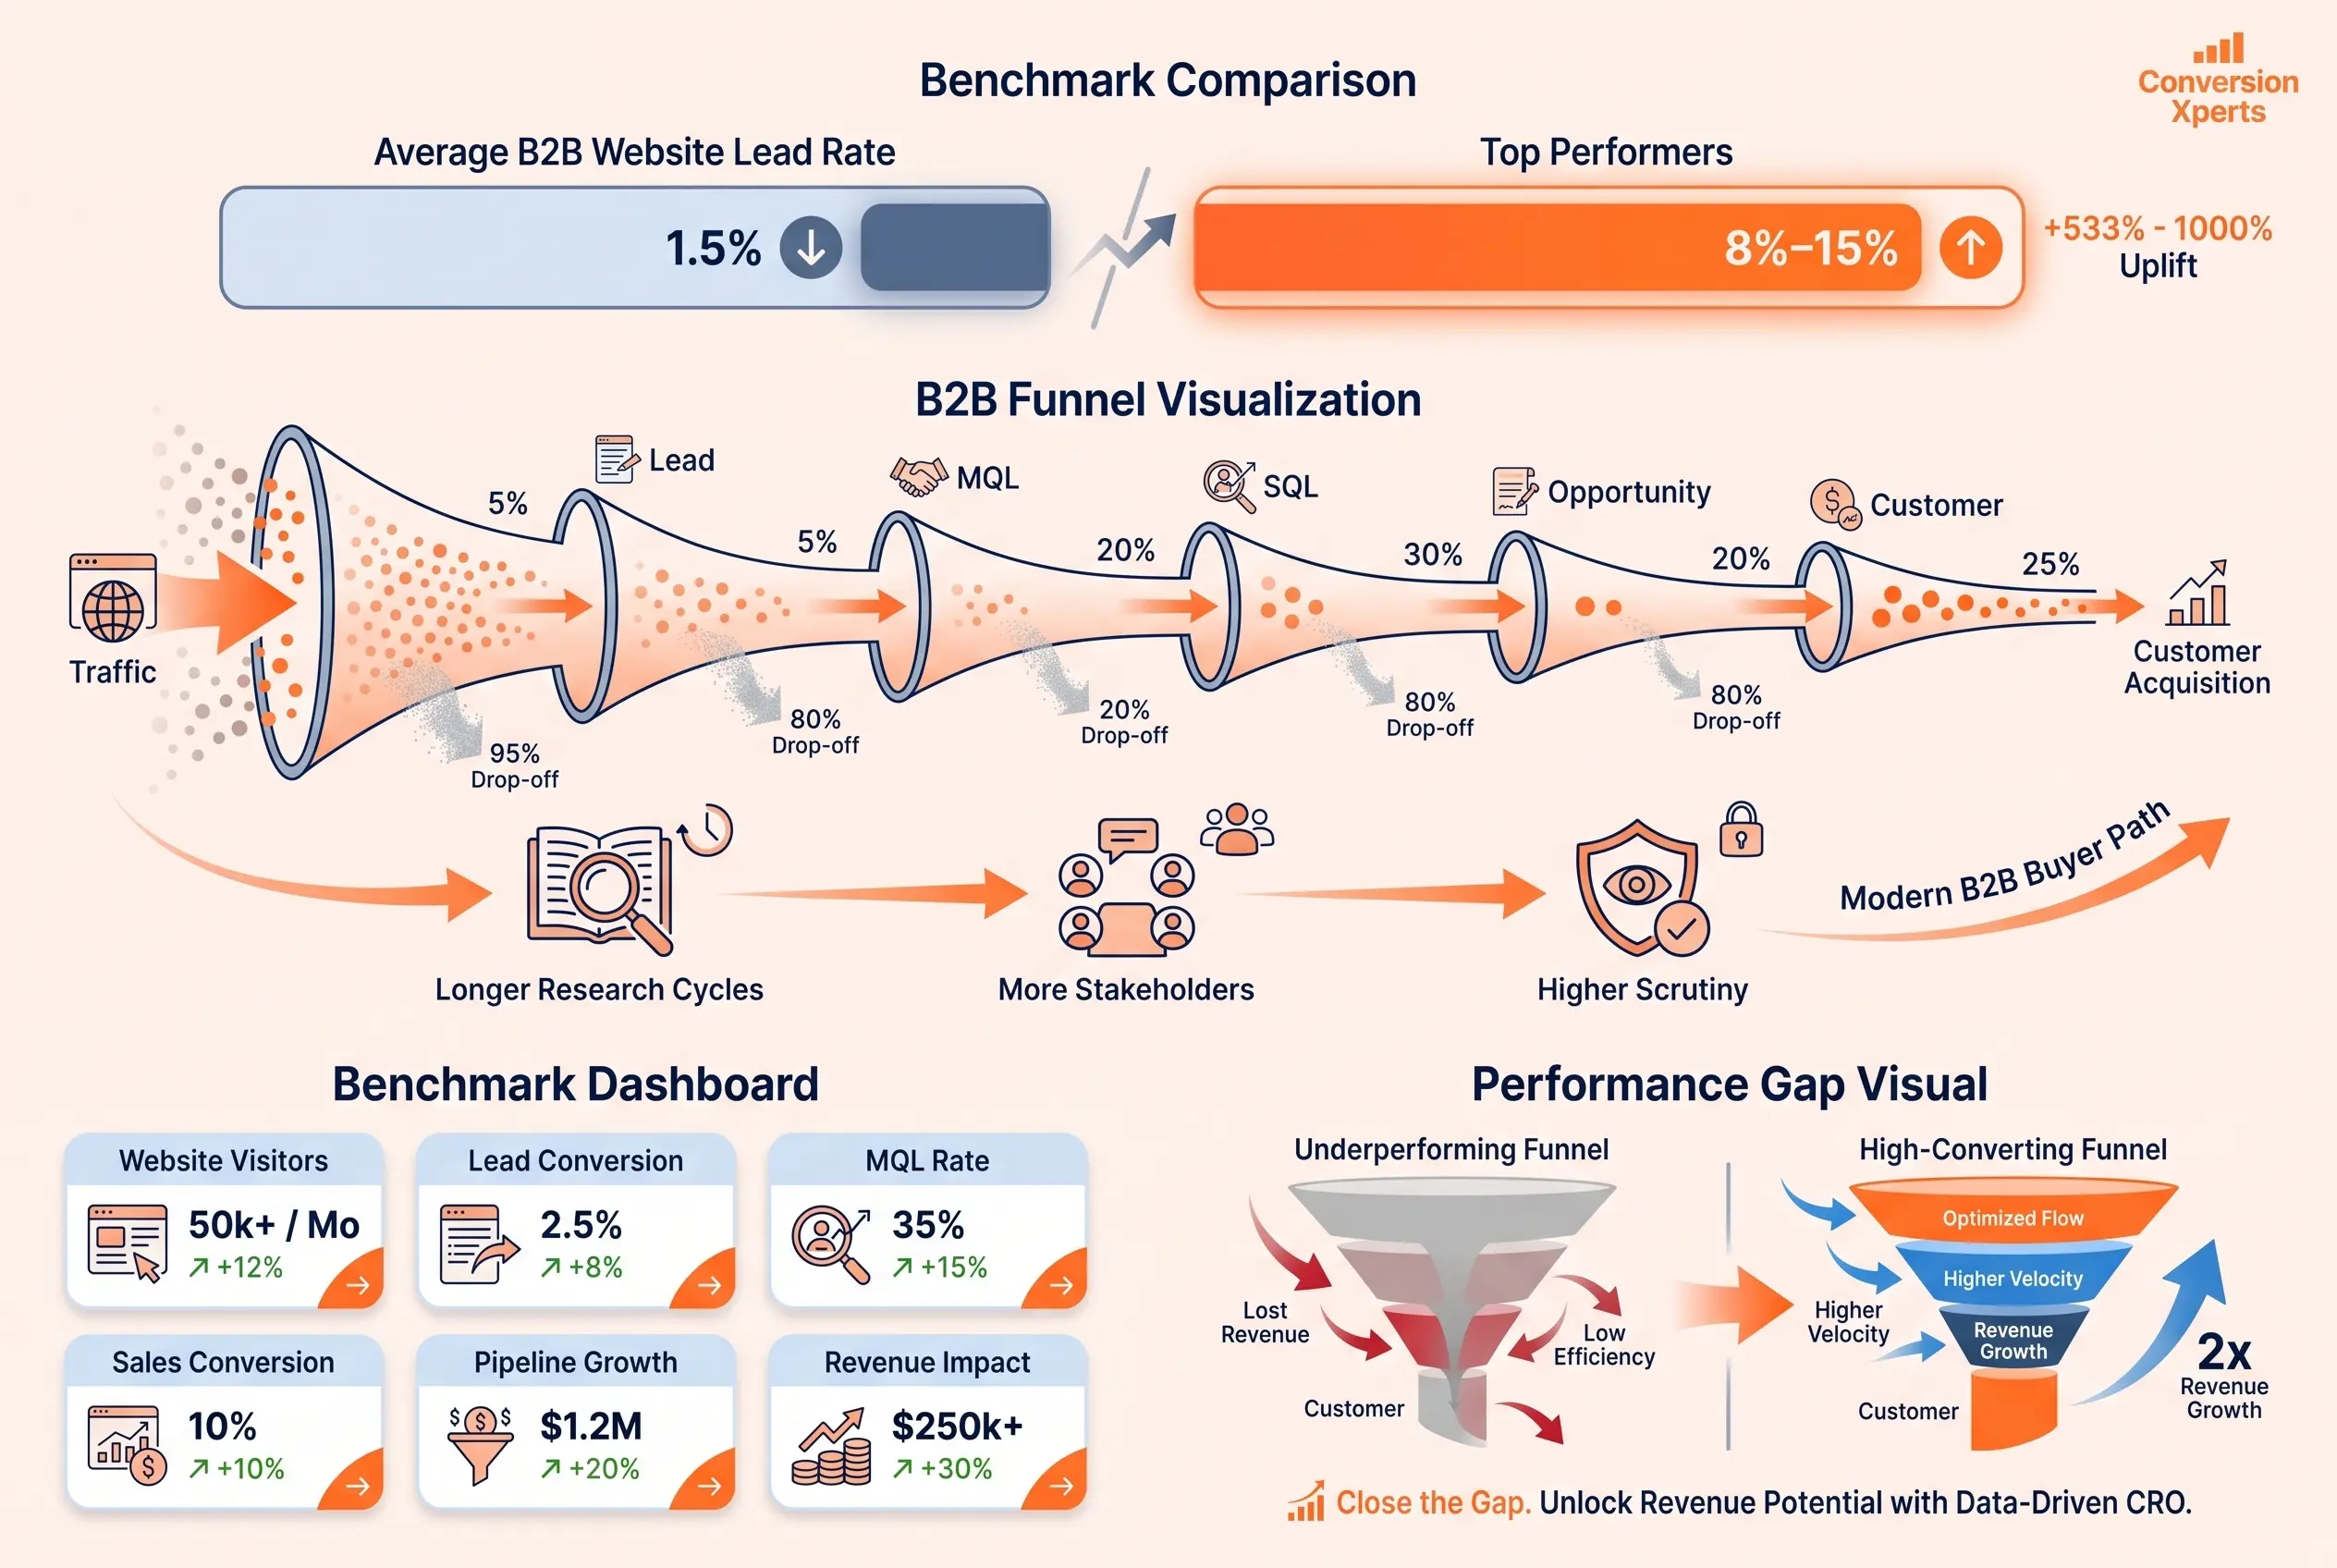
So if 5,000 people visit your website in a month and 75 fill out a demo request form, your visitor-to-demo conversion rate is 1.5%.
Why B2B Conversion Rates Are Different from B2C
B2B buying is very different from regular shopping. According to Gartner’s 2024 B2B Buyer research, the average business purchase involves 6 to 10 people and can take anywhere from 3 to 18 months to complete. This means a “conversion” in B2B is rarely one single moment. It is a chain of smaller actions across a long buying process.
This is why only looking at top-of-funnel numbers gives you an incomplete picture. A company with a 5% visitor to lead rate but a 5% lead to close rate is doing much better overall than a company with a 2% visitor to lead rate and a 30% lead to close rate, even though the second company closes a higher share of its deals.
How Conversion Rates Are Measured in B2B
Most B2B teams track conversion at three main stages. The first is Visitor to Lead, where someone fills out a form, requests a demo, or starts a free trial. The second is Lead to Opportunity (also called SQL), where a lead is reviewed by sales and confirmed as a real potential buyer. The third is Opportunity to Closed Won, where a qualified opportunity becomes a paying customer.
Each stage has its own benchmark. Your performance at each stage builds on the others. If you improve conversion by 15% at three stages at the same time, your total pipeline revenue can almost double.
B2B Conversion Rate Benchmarks by Industry
B2B conversion rate benchmarks change a lot depending on your industry. A good conversion rate in cybersecurity looks very different from what is considered good in legal services or manufacturing. The numbers below come from data collected across thousands of B2B companies.
Average Visitor to Lead Conversion Rates by Industry (2025)
| Industry | Average Conversion Rate | Top Quartile |
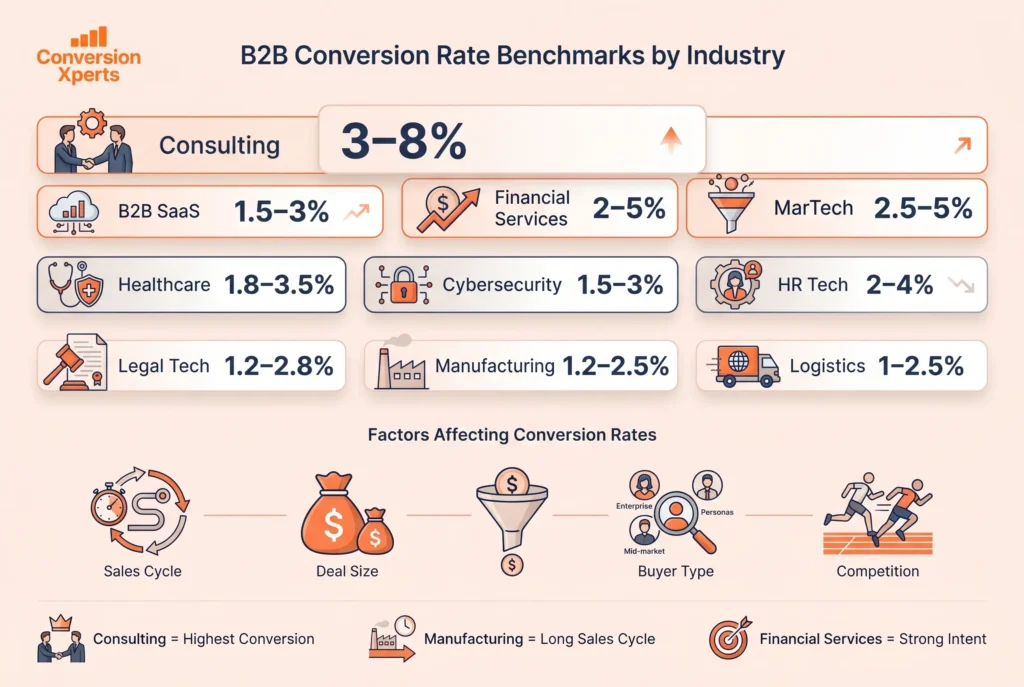
| B2B SaaS | 1.5% to 3.0% | 8% to 15% |
| Financial Services | 2.0% to 5.0% | 9% to 12% |
| Healthcare and MedTech | 1.8% to 3.5% | 7% to 10% |
| Manufacturing | 1.2% to 2.5% | 5% to 8% |
| Cybersecurity | 1.5% to 3.0% | 6% to 9% |
| Professional Services and Consulting | 3.0% to 8.0% | 12% to 20% |
| HR Tech and Workforce Platforms | 2.0% to 4.0% | 8% to 12% |
| Legal Tech | 1.2% to 2.8% | 5% to 8% |
| Logistics and Supply Chain | 1.0% to 2.5% | 4% to 7% |
| Marketing and Advertising Tech | 2.5% to 5.0% | 10% to 15% |
Sources: First Page Sage (2025), Unbounce Conversion Benchmark Report, WordStream B2B Advertising Data
These numbers represent visitors to lead conversions. That means someone who lands on your website and does something meaningful, like requesting a demo or filling out a contact form.
Why Your Industry Matters More Than You Think
The difference between industries is huge and it is not random. Several things drive these numbers.
Sales cycle length. Industries with long and complicated sales cycles,s like cybersecurity or enterprise manufacturing, tend to have lower top of funnel conversion rates. Buyers do a lot of research before agreeing to even a demo. Professional services companies often convert at higher rates because buyers already know they want to hire someone.
Price and deal size. Higher contract values mean buyers are more careful. An HR tech company selling at $5,000 per year will convert visitors at a higher rate than an enterprise data platform closing deals at $250,000 per year.
Who the buyer is. When your ideal customer is a senior executive, conversion rates are naturally lower. Those buyers are harder to reach and need more trust before they engage.
How competitive the market is. Crowded categories like CRM or marketing automation see lower conversion rates because buyers have more options and more distractions before they commit.
Financial Services B2B Benchmarks
Financial services companies such as fintech platforms, accounting software vendors, and B2B insurance tools tend to see higher conversion rates of 2 to 5% than most other B2B industries. The reason is buyer intent. Someone searching for “accounts payable automation software” is already deep into a buying decision. According to First Page Sage’s 2025 industry data, top-performing financial services companies see conversion rates from organic search as high as 10%.
Manufacturing and Industrial B2B Benchmarks
Manufacturing companies consistently sit at the lower end of the B2B conversion rate range. Buyers in this space are very technical, often need to involve procurement teams, and prefer phone calls over web forms. The average visitor conversion rate for manufacturing sits around 1.2 to 2.5%. Email outreach and direct sales tend to work better here than pure website traffic conversion.
B2B SaaS Conversion Rate Benchmarks: Free Trial and Demo Funnels
B2B SaaS conversion rate benchmarks deserve their own section because the funnel works differently. SaaS companies usually run one of two models. The first is demo-led, where prospects book a call before they can use the product. The second is product-led, where prospects try the product before talking to sales. Each model has different benchmarks.
Visitor to Trial and Visitor to Demo Benchmarks
| Conversion Event | Median | Good | Top Quartile |
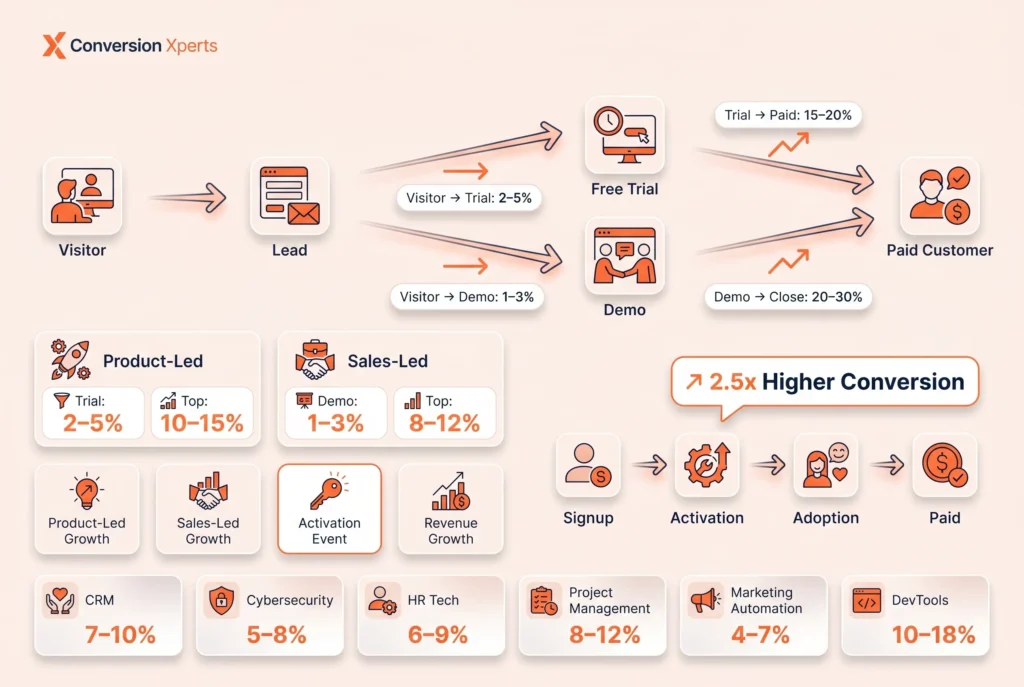
| Visitor to Free Trial (Product Led) | 2% to 5% | 5% to 8% | 10% to 15% |
| Visitor to Demo Request (Sales Led) | 1% to 3% | 3% to 6% | 8% to 12% |
| Visitor to Lead (Any Action) | 1.5% | 3% to 5% | 8% to 15% |
| Trial to Paid Conversion | 15% to 20% | 20% to 30% | 35% to 50% |
| Demo to Close | 20% to 30% | 30% to 40% | 45% to 60% |
Sources: SaaS industry aggregates (2024 to 2025), OpenView Partners SaaS Benchmarks Report
B2B SaaS Free Trial to Paid Conversion Rate Benchmark 2024
The B2B SaaS free trial to paid conversion rate benchmark sits at roughly 15 to 25% for opt-in trials (no credit card required) and 40 to 60% for opt-out trials (credit card required at signup), according to data from Totango and Intercom’s 2024 SaaS product benchmarks.
This is one of the most misunderstood numbers in SaaS. Many companies see a 20% trial to paid rate and think it is healthy. But without breaking it down by trial type, activation event, and how well the user fits your ideal customer profile, that number means very little.
Here is what the data shows when you look closer. Freemium to paid conversion averages just 1 to 5% across all users because most free users are not your ideal customer. Time limited free trials with 14 days and no card required convert at 15 to 20% on average. Credit card trials where users must enter payment at signup convert at 40 to 60%, but see more people abandon the signup step. Trials with a clear activation event, meaning a specific first action in the product, convert 2 to 3 times higher than those without one.
For CRM tools specifically, data from 86 B2B SaaS companies shows visitor to trial rates averaging 9.7% with 29% trial to paid conversion. This is well above average because people searching for CRM tools already know what they want.
Why Most SaaS Companies Underperform on Free Trial Conversion
The number one reason SaaS companies underperform here is that they never define what a successful first session looks like. This is called an activation event. It is the first moment in your product where a new user feels real value.
For Slack, it was a team sending 2,000 messages together. For Dropbox, it was syncing at least one file to one device. These companies built their entire onboarding experience around getting users to that moment as fast as possible.
According to a 2024 report by Lenny Rachitsky, SaaS companies that define and optimize for an activation event see trial to paid conversion rates 2.5 times higher than those that do not.
Vertical Specific SaaS Conversion Benchmarks
| SaaS Vertical | Visitor to Trial | Trial to Paid | Notes |
| CRM Software | 7% to 10% | 25% to 30% | High intent, competitive market |
| Cybersecurity | 5% to 8% | 18% to 25% | Long evaluation periods |
| HR and People Tech | 6% to 9% | 20% to 28% | Strong product-led growth |
| Project Management | 8% to 12% | 20% to 25% | Very high free user volume |
| Marketing Automation | 4% to 7% | 22% to 30% | Demo preferred buyers |
| DevTools and Engineering | 10% to 18% | 15% to 22% | Highest trial rates, moderately paid conversion |
B2B Conversion Rate Benchmarks by Traffic Channel
Where your traffic comes from has a huge effect on how well it converts. Not all visitors are equal. Someone who clicked a paid search ad for “best CRM for financial advisors” is much more likely to convert than someone who saw a display ad on a news website.
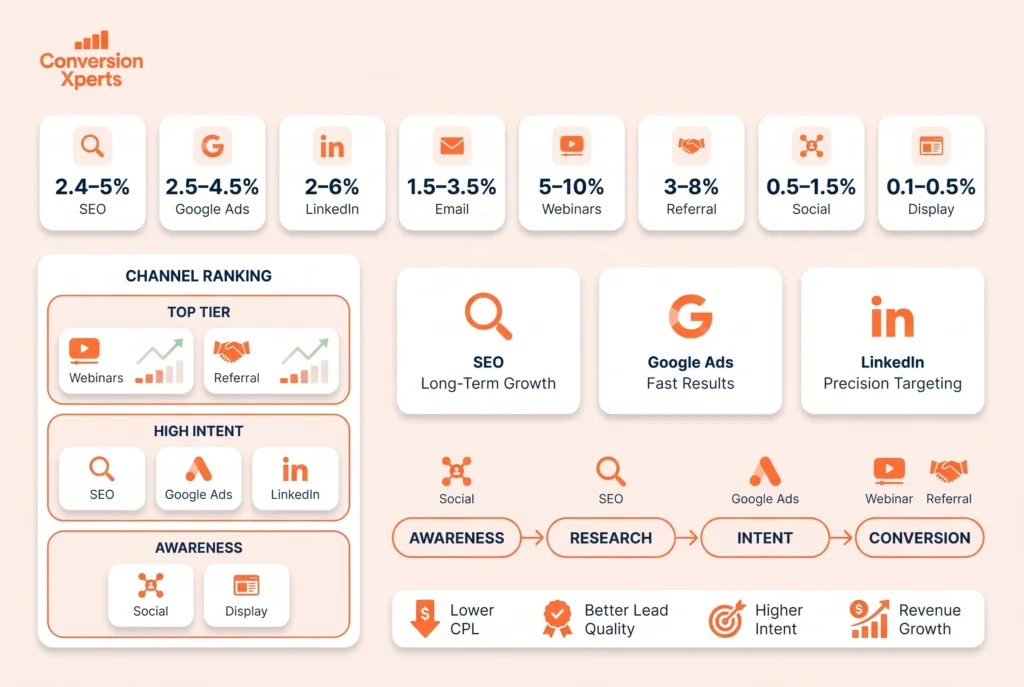
Channel by Channel B2B Conversion Rate Benchmarks
| Traffic Channel | Average Conversion Rate | Notes |
| Organic Search (SEO) | 2.4% to 5.0% | Highest intent, builds over time |
| Paid Search (Google Ads) | 2.5% to 4.5% | High intent, fast, but costs more |
| LinkedIn Ads | 2.0% to 6.0% | Best for reaching specific job titles |
| Email Marketing | 1.5% to 3.5% | Depends heavily on list quality |
| Webinars and Events | 5.0% to 10.0% | Highest conversion, lowest volume |
| Referral and Partner | 3.0% to 8.0% | Warm traffic, strong trust |
| Social Media Organic | 0.5% to 1.5% | Low intent, good for awareness |
| Display and Programmatic Ads | 0.1% to 0.5% | Very low intent, brand awareness only |
SEO vs. Paid Search: Which Converts Better for B2B?
Both channels work well,l but they serve different stages of the buying journey. Mixing them together in your reporting is a mistake most B2B teams make.
Paid search works well for people who are already close to making a decision. You can show ads for specific searches like “HubSpot alternatives with sales pipeline.” According to WordStream’s 2024 Google Ads benchmark report, the average B2B Google Ads conversion rate across industries is 3.04%, with top performers reaching 8 to 10%.
Organic search takes longer to build but tends to bring in better quality leads over time. A 2025 First Page Sage study found that B2B companies with strong SEO programs averaged 2.4% conversion rates from organic traffic. Those leads also closed at higher rates because they found the company through research rather than an ad.
The practical answer: use paid search to get leads now. Invest in SEO to reduce your cost per lead by 60 to 70% over the next 12 to 18 months.
LinkedIn Ads: The Underrated B2B Channel
LinkedIn often gets dismissed because of high click costs, typically $5 to $15 per click. But when your ideal customer is a VP of Engineering or a CFO at a 200-person SaaS company, LinkedIn’s targeting options are unmatched. Average conversion rates on LinkedIn for B2B offers range from 2 to 6%. LinkedIn Lead Gen Forms perform especially well, beating website landing pages by 2 to 3 times because the user does not have to leave LinkedIn to convert. Top-performing B2B SaaS companies regularly see 8 to 12% conversion rates on LinkedIn Lead Gen Forms when the offer matches the audience well.
Email: Still the Highest ROI B2B Channel
Despite being the oldest digital channel, email marketing remains the most cost-efficient for B2B companies. A 2024 Litmus report found that email delivers an average return of $36 for every $1 spent in B2B. Conversion rates from email to a landing page visit average 1.5 to 3.5%. But when email leads go on to book demos, those demos close at significantly higher rates than cold inbound leads.
B2B Funnel Stage Benchmarks: From Visitor to Closed Deal
Understanding your full funnel B2B conversion rate benchmarks is the only way to find exactly where your pipeline is leaking. Most B2B marketing teams only look at top-of-funnel numbers and miss the real problem, which is often a broken connection between marketing and sales.
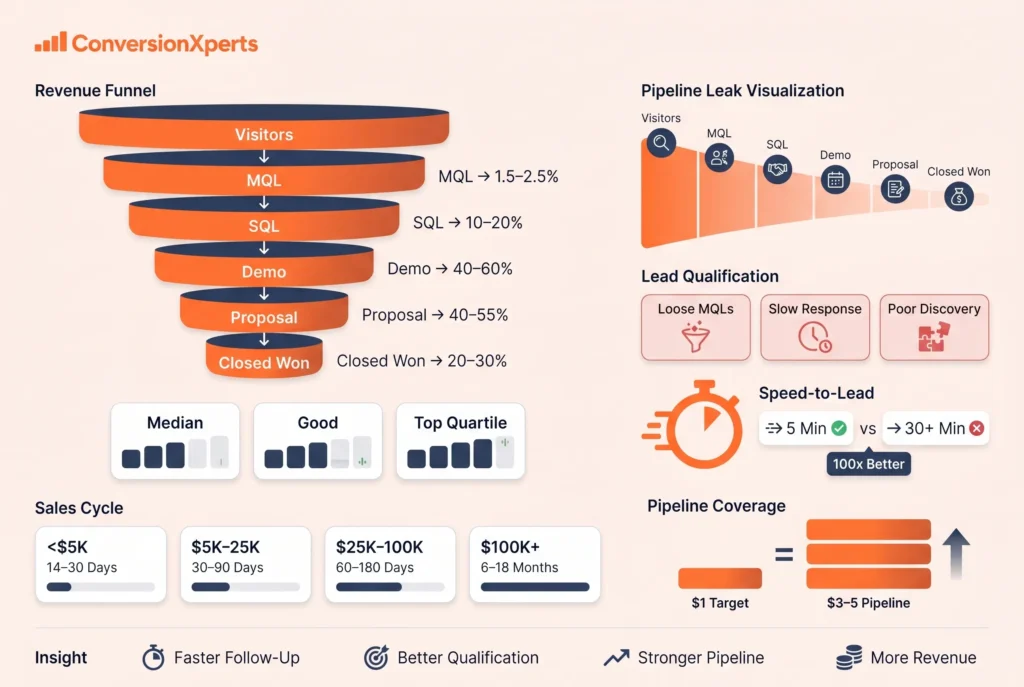
The Full B2B Funnel: Benchmarks at Every Stage
Here is a complete benchmark model for a mid market B2B SaaS company with annual contract values between $15,000 and $50,000:
| Funnel Stage | Median Rate | Good Rate | Top Quartile |
| Visitor to Lead (MQL) | 1.5% to 2.5% | 3% to 5% | 8% to 15% |
| Lead to SQL (Lead to Opportunity) | 10% to 20% | 20% to 30% | 30% to 50% |
| SQL to Demo Completed | 40% to 60% | 60% to 75% | 75% to 90% |
| Demo to Proposal or Evaluation | 40% to 55% | 55% to 70% | 70% to 85% |
| Proposal to Closed Won | 20% to 30% | 30% to 45% | 45% to 60% |
| End to End (Visitor to Close) | 0.5% to 1.0% | 1.0% to 2.0% | 3% to 6% |
This table shows something that surprises most B2B teams. Even with a great visitor to lead conversion rate, the end-to-end rate from visitor to closed customer is usually below 2%. That is completely normal. It also means that a small improvement at every stage adds up to a very large increase in total revenue.
Lead Qualification: Where Most B2B Pipelines Break
According to Salesforce’s 2024 State of Sales report, 79% of marketing leads never convert into sales. Not because they are bad leads, but because they are not properly qualified, followed up with, or nurtured. The benchmark for lead to SQL conversion is 10 to 20% for most B2B companies. If yours is below 10%, the problem is usually one of three things: your definition of a marketing qualified lead is too loose, your sales team is too slow to follow up, or your salespeople are not running proper discovery conversations.
How fast you respond is one of the most underestimated conversion levers in B2B. A 2024 Harvard Business Review study found that companies that respond to inbound leads within five minutes are 100 times more likely to qualify that lead compared to companies that wait 30 minutes or more.
Sales Cycle Length by Deal Size
| Deal Size (Annual Contract Value) | Average Sales Cycle Length |
| Under $5,000 | 14 to 30 days |
| $5,000 to $25,000 | 30 to 90 days |
| $25,000 to $100,000 | 60 to 180 days |
| Over $100,000 | 6 to 18 months |
Sales cycle length directly affects your pipeline math. If your average deal is $50,000 and your sales cycle is six months, you need a much bigger pipeline today to hit your revenue targets next quarter. Knowing these benchmarks helps you plan realistically.
Understanding Pipeline Coverage Ratios
A pipeline coverage ratio tells you how much total pipeline value you need to reliably hit your revenue target. For most B2B companies, a 3 to 1 or 4 to 1 ratio is the standard benchmark. That means you need $3 to $4 in qualified pipeline for every $1 of your revenue target. Companies with larger deal sizes and longer sales cycles typically need even higher ratios of 4 to 1 or 5 to 1 because more deals will delay or fall through before closing.
What Separates Top Performers from Average B2B Companies
Top quartile B2B companies do not just have better ads or a better product. They run their conversion funnels differently. And the differences are specific and learnable.
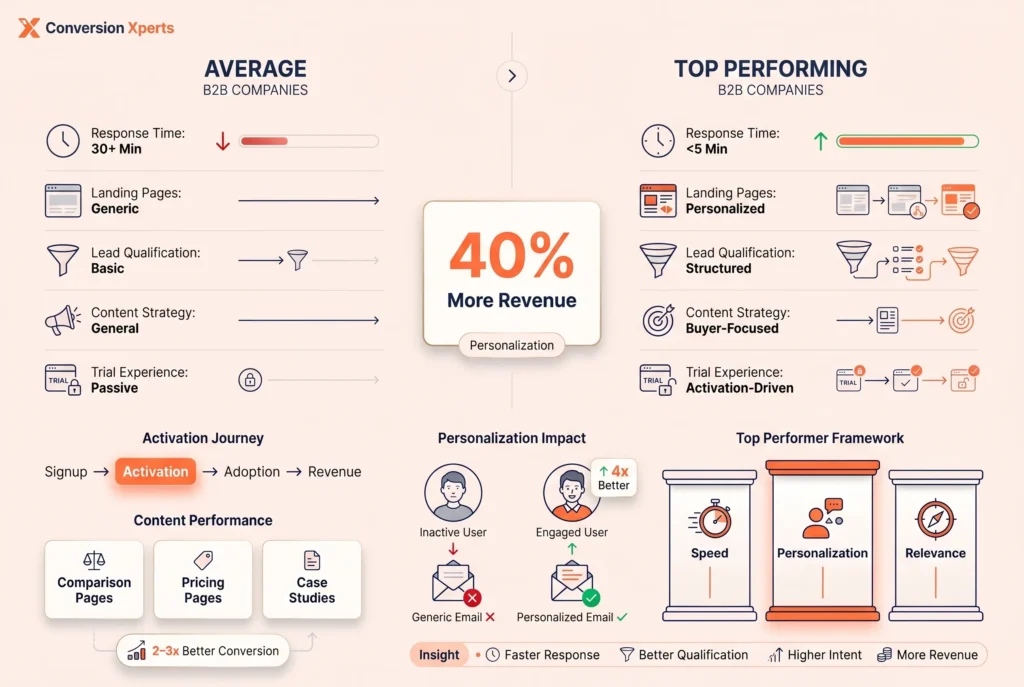
Speed, Personalization, and Relevance
The three things that drive high B2B conversion rates are speed (how fast you respond to and qualify leads), personalization (how relevant your messaging is to each buyer’s situation), and relevance (how well your content and offer match where the buyer is in their journey).
Companies in the top quartile for B2B SaaS conversion rate benchmarks share these habits. They define a clear activation event and actively guide all trial users toward it within the first 48 hours. Their landing pages are built for specific buyer roles, industries, and use cases rather than one generic page for all traffic. They use tracking tools to understand which combination of touchpoints leads to the highest close rates and then invest more in those sequences. They follow up with inbound leads within five minutes during business hours and use automated systems for nights and weekends. Their sales team runs structured discovery conversations with clear criteria for qualifying buyers, not open-ended chats.
The Role of Content in B2B Conversion
According to Demand Gen Report’s 2024 B2B Buyer Behavior study, 67% of B2B buyers use content to make purchase decisions. The average buyer reads 3 to 5 pieces of content before ever speaking with a salesperson. Top-performing B2B companies understand this and build their conversion process around it.
That means having comparison pages that rank for searches like “[Your Product] vs [Competitor],” pricing pages that give buyers enough information to decide if they are a good fit, and case studies organized by industry and use case. Companies with this kind of content in place convert at 2 to 3 times the rate of companies relying on a generic home page to do all the work.
The Data on Personalization and Conversion
A 2024 McKinsey study found that B2B companies using personalization in their marketing and sales outreach see 40% more revenue from those activities compared to companies using generic messaging. In practical terms for B2B SaaS conversion rate benchmarks, this means personalized emails to trial users based on what they actually did in the product convert 4 times better than generic check in emails sent on a fixed schedule.
The key takeaway is simple. Segment your trial users by what they do in your product, not by when they signed up. A user who has connected their CRM and invited two colleagues is in a completely different stage than someone who logged in once and never came back. Treat them differently.
How to Improve Your B2B Conversion Rate
Knowing your B2B conversion rate benchmarks only helps if you act on the gaps you find. Here is a practical, stage-by-stage plan for improving conversion across your whole funnel.
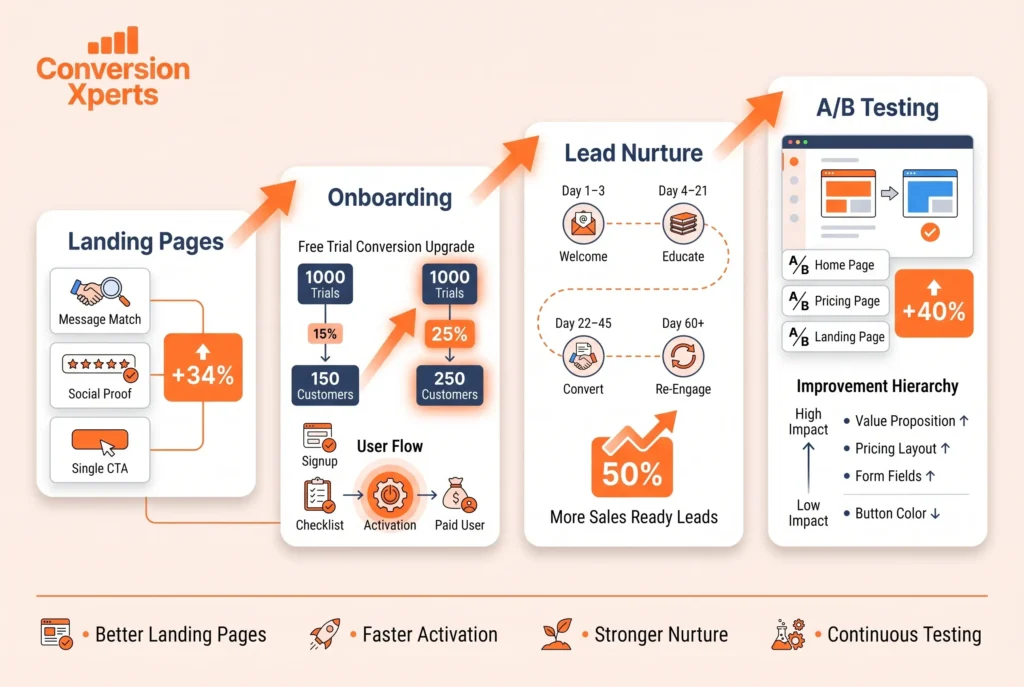
Fix Your Landing Pages First
Most B2B companies blame traffic quality when their conversion rates are low. But the real problem is usually the landing page itself. A 2024 Unbounce study found that the average B2B landing page converts at just 2.23%, but pages in the top 10% convert at 11.45% or higher. That is a five times difference with the exact same traffic.
Message match is the most impactful improvement. The headline on your landing page should reflect the exact language of the ad or link that brought the visitor there. If your Google Ad says “Automate your accounts payable in 30 days,” your landing page headline should say something very similar, not a generic product tagline.
Social proof at the top is the second big win. Logos of recognizable customers, a review score from G2 or Capterra, or a short customer quote placed in the top section of the page increase conversion rates by an average of 34% according to ConversionXL research.
One single clear call to action is the third. Pages with more than one main call to action convert at lower rates. Every element on the page should push the visitor toward one single next step.
Improve Your Free Trial Onboarding
For B2B SaaS companies, improving the free trial to paid conversion rate benchmark is usually more valuable than getting more trial signups. Here is the math. If you have 1,000 trial signups per month at a 15% conversion rate, you get 150 paid customers. If you improve your onboarding and reach a 25% conversion rate without changing your signup volume, you get 250 paid customers. That is a 67% increase in revenue from the same amount of traffic spend.
The most impactful onboarding improvements are defining and optimizing your activation event, adding a setup checklist (products with a guided setup checklist see 30 to 50% higher activation rates than products with open ended onboarding), and sending behavior based emails to users who have not yet reached the activation event after 24 hours. Do not send a generic getting started email. Send a message that speaks directly to where they are stuck.
Build a Lead Nurture System That Actually Works
The average B2B buyer needs 7 meaningful touchpoints before they are ready to convert. This is the well-known Rule of 7. Most B2B companies stop following up after 2 or 3 attempts and then wonder why their pipeline is thin.
A healthy lead nurture system includes a welcome sequence in the first three days, a middle funnel education sequence from day 4 to day 21 that addresses the top three objections your sales team hears most often, a decision stage sequence from day 22 to day 45 that includes case studies and a strong demo offer, and a re engagement sequence for leads that have gone quiet at 60, 90, and 180 days.
B2B companies with strong lead nurture programs generate 50% more sales ready leads at 33% lower cost, according to Forrester Research. Building a proper nurture system is one of the best investments any B2B marketing team can make.
Use A/B Testing in a Smart Way
A/B testing is the most reliable way to improve your B2B conversion rate benchmarks over time. But most teams test the wrong things. Testing button colors is low impact. Testing your core value proposition, your pricing page layout, or the number of fields in your demo request form can move conversion rates by 15 to 40%.
Start with the pages that get the most traffic and have the highest buying intent. That is usually the home page, the pricing page, and the main product landing page. Run tests for at least two weeks with enough traffic to get reliable results before deciding on a winner.
According to HubSpot’s 2024 State of Marketing report, companies that run five or more A/B tests per month see 40% higher conversion rates than companies that test quarterly or less.
How Buyer Intent Signals Are Changing B2B Conversion in 2026
The way B2B buyers signal their readiness to purchase has changed significantly over the last two years. Intent data has moved from being a nice-to-have piece of marketing intelligence to one of the most reliable conversion levers available to growth teams. Understanding how to read and act on these signals is now a meaningful separator between companies converting at average rates and those hitting the top quartile.
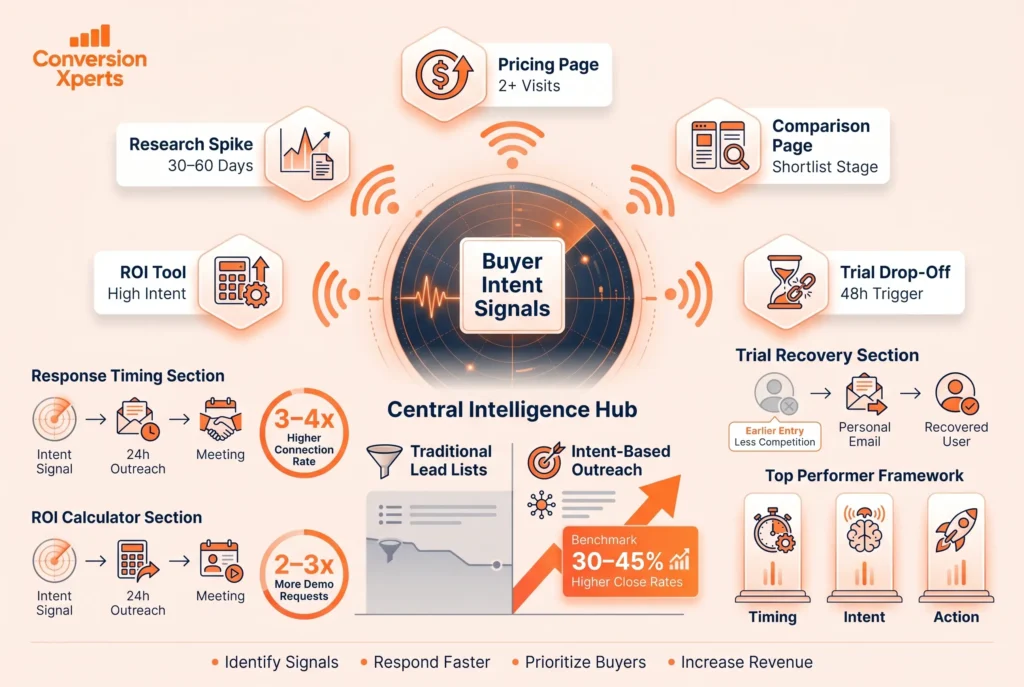
Buyer intent signals are behavioral data points that indicate a prospect is actively researching a solution in your category. These signals come from two primary sources. First-party signals are actions a prospect takes directly on your own website or within your product, like visiting your pricing page three times in one week, downloading a comparison guide, or starting a free trial without completing onboarding. Third-party signals are actions captured off your website by intent data platforms like Bombora, G2, or TechTarget, such as a target account spiking in content consumption around topics directly related to your product category.
What makes this relevant to conversion benchmarks is the difference in close rates when sales teams prioritize accounts showing high intent signals versus those that do not. Companies using intent data as a primary signal for outreach see demo to close rates 30 to 45 percent higher than teams working from traditional MQL lists alone. The leads are not necessarily better. The timing is better. And in B2B sales, timing is almost everything.
Here are the most reliable buyer intent signals that B2B teams should be tracking and acting on right now.
Pricing page visits from a known account. When a contact from a target company visits your pricing page twice or more within a 14 day period, that is one of the strongest indicators of an active buying decision. Sales teams that trigger immediate personalized outreach within 24 hours of this signal see connection rates 3 to 4 times higher than standard outbound sequences.
Return visits to competitor comparison content. A prospect who lands on a page comparing your product to a competitor is not casually browsing. They have a shortlist. They are evaluating. This is one of the highest-intent content categories in all of B2B, and companies that treat it accordingly by offering immediate live chat, a dedicated comparison guide download, or a direct sales follow-up convert those visitors at rates far above their overall site average.
Trial activity drop-off after an initial session. For SaaS products, a user who logged in once and never returned is showing a negative intent signal that most companies ignore. The best onboarding teams treat this as an urgent trigger, not a passive data point. Sending a personally worded email from a real team member within 48 hours of inactivity consistently recovers 15 to 20 percent of users who would otherwise churn before they ever converted.
Third-party research spikes on category topics. When Bombora or a similar intent data platform flags that a target account is spiking on topics like “revenue intelligence software” or “enterprise contract management,” that spike typically precedes an active vendor search by 30 to 60 days. Sales teams that engage during this research window rather than waiting for the prospect to raise their hand convert at significantly higher rates and face less competitive pressure because they enter the conversation before a formal shortlist has been established.
Engagement with ROI or pricing calculator tools. Self-service tools like ROI calculators and pricing estimators are among the highest intent signals on any B2B website. A visitor who spends time with a calculator is explicitly trying to justify a purchase decision. These users convert to demo requests at 2 to 3 times the rate of visitors who only read blog content, and they arrive at sales conversations with a much clearer internal business case already forming.
The conversion implication is straightforward. B2B teams that build their outreach workflows around these signals rather than static lead scoring models consistently outperform their benchmarks, not because they have more leads but because they are having the right conversations at the right time.
The Impact of Pricing Page Design on B2B Conversion Rates
The pricing page is the most underleveraged conversion asset on most B2B websites. It is the page where the highest-intent visitors in your entire funnel land, and yet it receives a fraction of the optimization attention that homepage or blog content does. Getting your pricing page right consistently produces some of the largest conversion rate gains of any single change you can make to a B2B website.
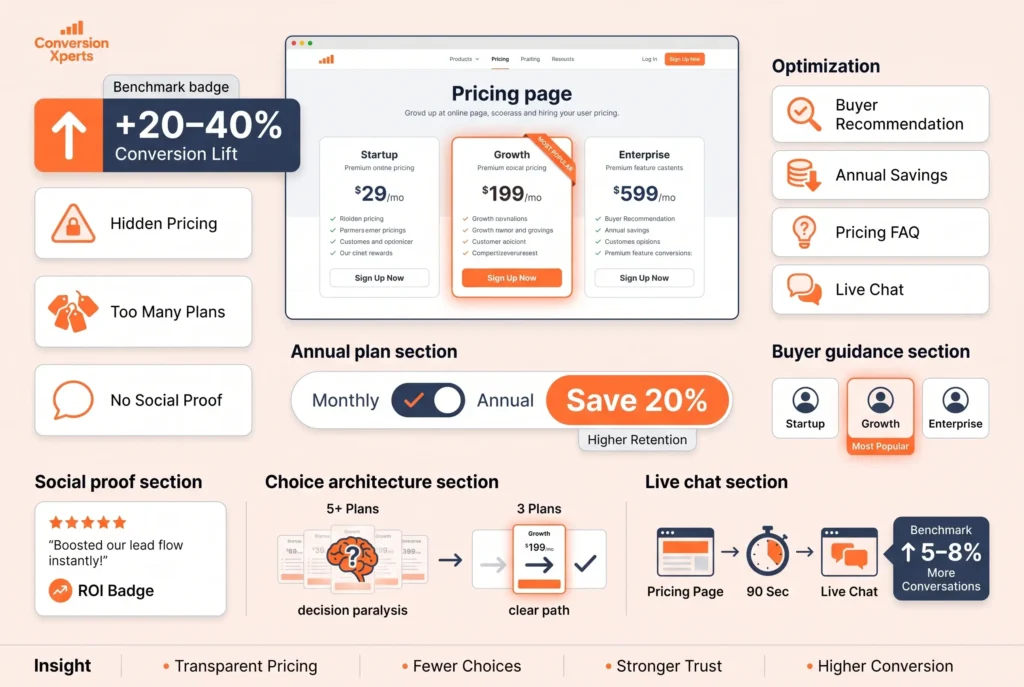
According to a 2024 SaaS pricing study by Price Intelligently, companies that actively test and optimize their pricing page see conversion rate improvements of 20 to 40 percent over a 90-day period compared to companies that treat it as a static page. The page itself is rarely the problem. What is on it almost always is.
The most common conversion-killing mistakes on B2B pricing pages fall into a predictable set of patterns that are worth understanding because they show up in company after company regardless of industry or deal size.
Hiding the price entirely is the first major mistake. Many B2B companies, especially those with complex enterprise pricing, choose to show no pricing at all and replace the pricing page with a “contact us for a quote” message. This approach feels safe from a sales strategy perspective but is catastrophic for conversion. Buyers who cannot get a sense of whether a product is in their budget will not book a demo to find out. They will go to a competitor who gives them enough information to self-qualify. According to Gartner’s 2024 B2B Buyer research, 77 percent of buyers describe their most recent purchase as difficult or very complex, and opaque pricing adds friction that pushes already-overwhelmed buyers toward vendors who make decisions easier.
Too many tiers confusing the buyer is the second mistake. SaaS pricing pages with more than four tiers consistently underperform those with two to three tiers. More options create more decision paralysis. The psychological principle of choice overload is well established in behavioral economics research, and it applies directly to B2B pricing pages. The best-converting pricing pages make one option obviously right for a specific buyer type and use the others to anchor value or handle upsells.
Missing social proof at the moment of pricing consideration is the third major gap. The pricing page is where the buyer is asking “is this worth it?” That is the exact moment where a customer quote about measurable ROI is most powerful. A logo wall at the top of the homepage does nothing for a buyer staring at a $2,000 per month line item and trying to justify it internally. A specific quote from a customer in the buyer’s industry saying “we recovered the cost in 60 days” placed directly next to the pricing tier converts that hesitation into action.
Here are the specific elements that top-performing B2B pricing pages consistently include and that directly move conversion rates in a measurable way.
A clear recommendation for each buyer type. Something as simple as “Most popular for teams of 10 to 50” or “Best for companies scaling past $5M ARR” eliminates decision paralysis and tells buyers which option is right for them without a sales call.
An annual vs. monthly pricing toggle with a visible savings amount. Showing “Save 20 percent annually” in a clear label increases annual plan selection by an average of 35 percent and improves overall conversion because annual customers churn at lower rates, which means sales teams spend less time on renewals.
A FAQ section that addresses the top pricing objections directly on the page. The three most common B2B pricing objections are “what happens if we outgrow this plan,” “is there a lock-in contract,” and “can we add more users later.” Answering these directly on the pricing page removes the need for a sales conversation to handle them, which reduces friction and accelerates the path to a demo or signup.
A live chat trigger for visitors who spend more than 90 seconds on the pricing page without converting. This single trigger, properly configured in a tool like Intercom or Drift, consistently converts 5 to 8 percent of previously unconverted pricing page visitors into conversations that turn into demos. The visitor is already interested. They are not converting because they have a question they have not found the answer to yet. Live chat gives them a frictionless way to get that answer without abandoning the page.
Account-Based Marketing and Its Effect on B2B Conversion Benchmarks
Account-based marketing has moved from a strategic buzzword to a core conversion driver for mid-market and enterprise B2B companies over the last three years. When it is implemented properly, it fundamentally changes the conversion benchmarks that are realistic and achievable because you are no longer optimizing for the average visitor. You are building targeted experiences for the specific companies most likely to become your best customers.
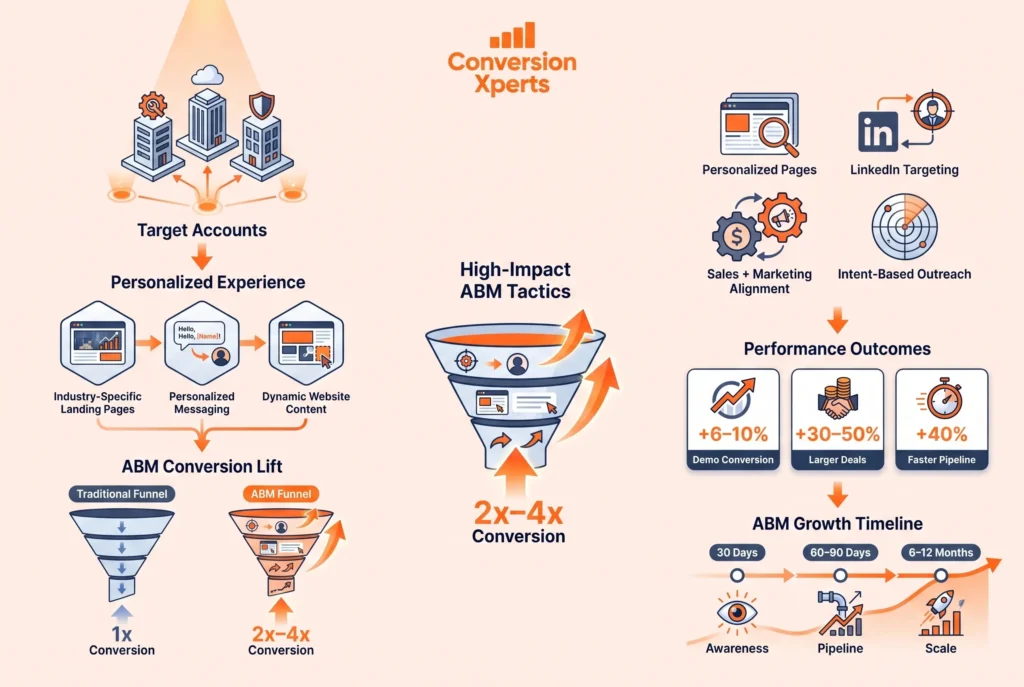
The premise of ABM is straightforward. Rather than casting a wide net and hoping that enough relevant buyers are in the resulting traffic, you identify a list of target accounts that match your ideal customer profile and then build your marketing and sales efforts specifically around those companies. The conversion rates that result from well-executed ABM programs are consistently 2 to 4 times higher than those from broad inbound programs because every touchpoint is designed for a much more specific audience.
According to the 2024 ITSMA ABM Benchmark Study, 87 percent of B2B marketers report that ABM outperforms other marketing investments in terms of ROI. Among companies running mature ABM programs, visitor to demo conversion rates from target accounts average 6 to 10 percent compared to the 1.5 to 3 percent baseline from general inbound traffic. The deal sizes closed through ABM programs also tend to be 30 to 50 percent larger because the target account selection process is built around companies with the budget and organizational fit to support larger contracts.
The conversion mechanics of ABM work differently from traditional inbound. Rather than waiting for target accounts to find you organically, ABM uses a combination of personalized paid advertising on LinkedIn and programmatic display platforms, personalized website experiences that change based on the visiting company’s IP address, direct outreach from sales development representatives timed to coincide with marketing touchpoints, and content specifically created for the target account’s industry and known business challenges.
Here is how these specific ABM tactics translate into measurable conversion improvements.
Personalized landing pages built for specific target account industries convert at 3 to 5 times the rate of generic landing pages when those accounts arrive. Tools like Mutiny and Intellimize allow B2B marketing teams to dynamically change headlines, social proof, and case study references based on the visitor’s company or industry without requiring a developer to build separate pages.
LinkedIn Matched Audiences targeting contacts from a named account list converts at 4 to 7 percent on Lead Gen Form campaigns compared to 2 to 4 percent for broad audience campaigns. The difference is entirely attributable to relevance. When a VP of Operations at a company on your target account list sees an ad that references a problem specific to their industry and company size, the cognitive match is stronger and the conversion intent follows.
Sales and marketing touchpoint coordination in ABM programs is the difference between annoying prospects with disconnected outreach and building a coherent presence that moves accounts through the buying journey. Research from Demandbase’s 2024 ABM Impact Report found that accounts receiving coordinated marketing and sales touches convert to pipeline 40 percent faster than those receiving either marketing or sales outreach alone.
The realistic timeline for ABM to show meaningful conversion rate improvements is 60 to 90 days for initial pipeline contribution and 6 to 12 months for the full benchmark improvement to stabilize. Companies that abandon ABM programs after 30 days because they are not seeing immediate results miss the compounding effect that comes from building familiarity and trust with target accounts over multiple coordinated touchpoints across a longer timeframe.
Mobile Conversion Rates in B2B and Why Most Teams Ignore Them
Mobile traffic in B2B is routinely dismissed as low-intent browsing that does not convert into pipeline. This assumption was defensible five years ago. It is no longer accurate and acting on outdated assumptions about mobile is costing B2B companies a measurable share of conversions every single month.
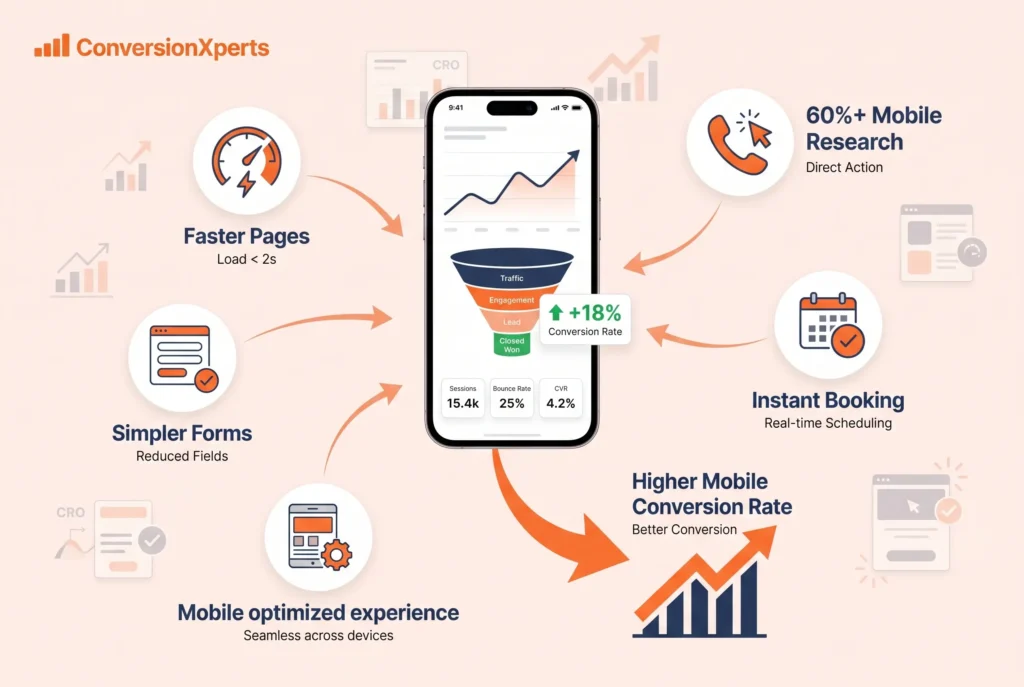
According to a 2024 BCG research report on B2B digital behavior, more than 60 percent of B2B buyers use their mobile device as part of their research and evaluation process. They are reading case studies on their phones during commutes, checking competitor pricing pages during meetings, and even starting free trial signups from mobile browsers. The conversion rates from this traffic are lower than desktop on most B2B sites, but the gap is almost entirely explained by how poorly optimized those sites are for mobile experiences rather than any fundamental difference in mobile buyer intent.
The average B2B website converts mobile visitors at roughly 0.5 to 1 percent compared to 2 to 3 percent for desktop. But companies that have specifically optimized their mobile experience narrow that gap dramatically. Top-performing B2B companies with mobile-optimized conversion paths see mobile conversion rates of 1.5 to 2.5 percent, still below desktop but no longer negligible given the volume of mobile traffic most sites receive.
The specific friction points that kill B2B conversion on mobile are consistent across industries and are all fixable without a complete website rebuild.
Forms with more than three fields on mobile convert at dramatically lower rates than the same forms on desktop. The physical effort of tapping through multiple form fields on a small keyboard is a meaningful psychological barrier that disappears when you reduce the field count to name, email, and company. Progressive profiling, where you collect additional information in subsequent interactions, recovers the data quality without sacrificing mobile conversions.
Page load speed is even more critical on mobile than desktop. Google’s 2024 Core Web Vitals data shows that mobile pages loading in under 2.5 seconds convert at 3 times the rate of pages loading in over 5 seconds. Most B2B websites are loading unoptimized images, running multiple tracking scripts simultaneously, and serving desktop-sized assets to mobile users, all of which compound into load times that lose buyers before a single word of copy is read.
Click-to-call functionality on mobile pricing and contact pages recovers a segment of buyers who prefer phone conversations over form submissions. B2B buyers in certain industries, particularly manufacturing, financial services, and professional services, have strong preferences for phone-based initial contact. A visible click-to-call button on mobile pages serving these audiences consistently adds 15 to 25 percent to the total conversion rate by capturing buyers who would otherwise leave without converting through any other channel.
Calendar booking tools optimized for mobile are one of the highest impact additions any sales-led B2B company can make to its mobile experience. Calendly and similar tools are designed to work seamlessly on mobile browsers, and embedding them directly on demo request confirmation pages means a prospect who just submitted a form can immediately book a specific time without switching devices or waiting for a follow-up email.
The conversion opportunity in mobile B2B traffic is real and growing. Teams that continue to treat mobile as a secondary consideration in their CRO programs are leaving an increasingly large portion of qualified buyer intent unaddressed.
How to Use Conversion Rate Data to Build a Better Revenue Forecast
Most B2B revenue forecasts are built on gut feel dressed up as data. A sales manager looks at the current pipeline, applies a mental discount for deals that seem unlikely to close, and arrives at a number that is usually wrong in either direction. The reason is not a lack of effort. It is a lack of reliable conversion rate benchmarks applied consistently across funnel stages.
When you know your actual conversion rates at every stage of your funnel and how they compare to the benchmarks for your industry and company size, you can build revenue forecasts that are genuinely predictive rather than aspirationally optimistic. This matters not just for hitting quarterly targets but for making smart decisions about hiring, marketing investment, and product development based on what the data actually supports.
The mechanics of a benchmark-informed revenue forecast are straightforward. You start with your current top-of-funnel inputs, meaning total monthly website visitors and the traffic volume from each channel. You then apply your actual stage-by-stage conversion rates to model how many visitors become MQLs, how many MQLs become SQLs, how many SQLs reach demo stage, and how many demos close. Where your actual rates fall below industry benchmarks, you model the revenue impact of closing those gaps over 30, 60, and 90 day improvement scenarios.
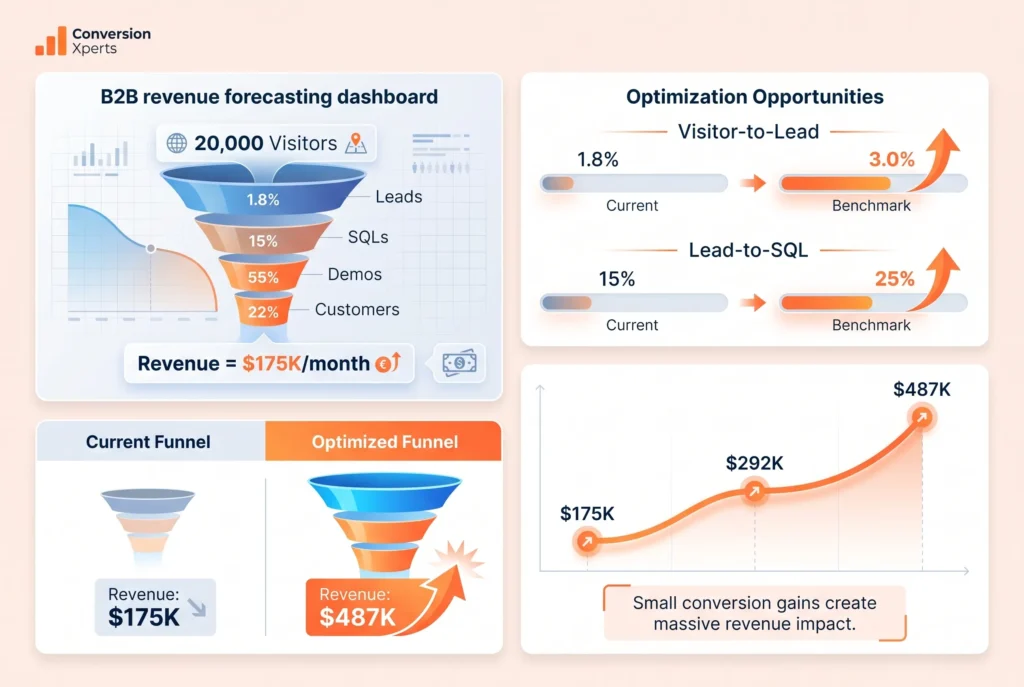
Here is what that looks like in practice for a mid-market B2B SaaS company receiving 20,000 monthly visitors with an average contract value of $24,000.
At current conversion rates of 1.8 percent visitor to lead, 15 percent lead to SQL, 55 percent SQL to demo, and 22 percent demo to close, the monthly closed revenue from website traffic alone works out to roughly $175,000.
If that same company moves its visitor to lead rate to the industry benchmark of 3 percent through landing page and form optimization without changing anything else, monthly closed revenue rises to approximately $292,000. That single improvement at the top of the funnel is worth $117,000 in additional monthly revenue, compounding across every subsequent stage.
If the company also improves its lead to SQL rate from 15 to 25 percent by tightening its MQL definition and improving response time, the monthly revenue number climbs further to roughly $487,000. Two improvements. No increase in traffic spend. Nearly three times the original revenue output from the same funnel.
This kind of modeling is what separates B2B marketing teams that get budget and influence from those that are perpetually defending their existence to finance and leadership. When you can show specifically which conversion rate improvement will generate which revenue outcome and within what timeframe, the conversation about where to invest stops being a debate about opinion and becomes a decision about priorities.
The benchmarks in this guide give you the comparison points you need to identify which stages of your funnel have the most room to improve. The forecast modeling approach described here gives you the business case to prioritize them in the right order and communicate that case clearly to everyone who controls the resources needed to execute.