Automotive Conversion Rate Optimization: The Complete Playbook to Turn More Visitors Into Buyers
Introduction
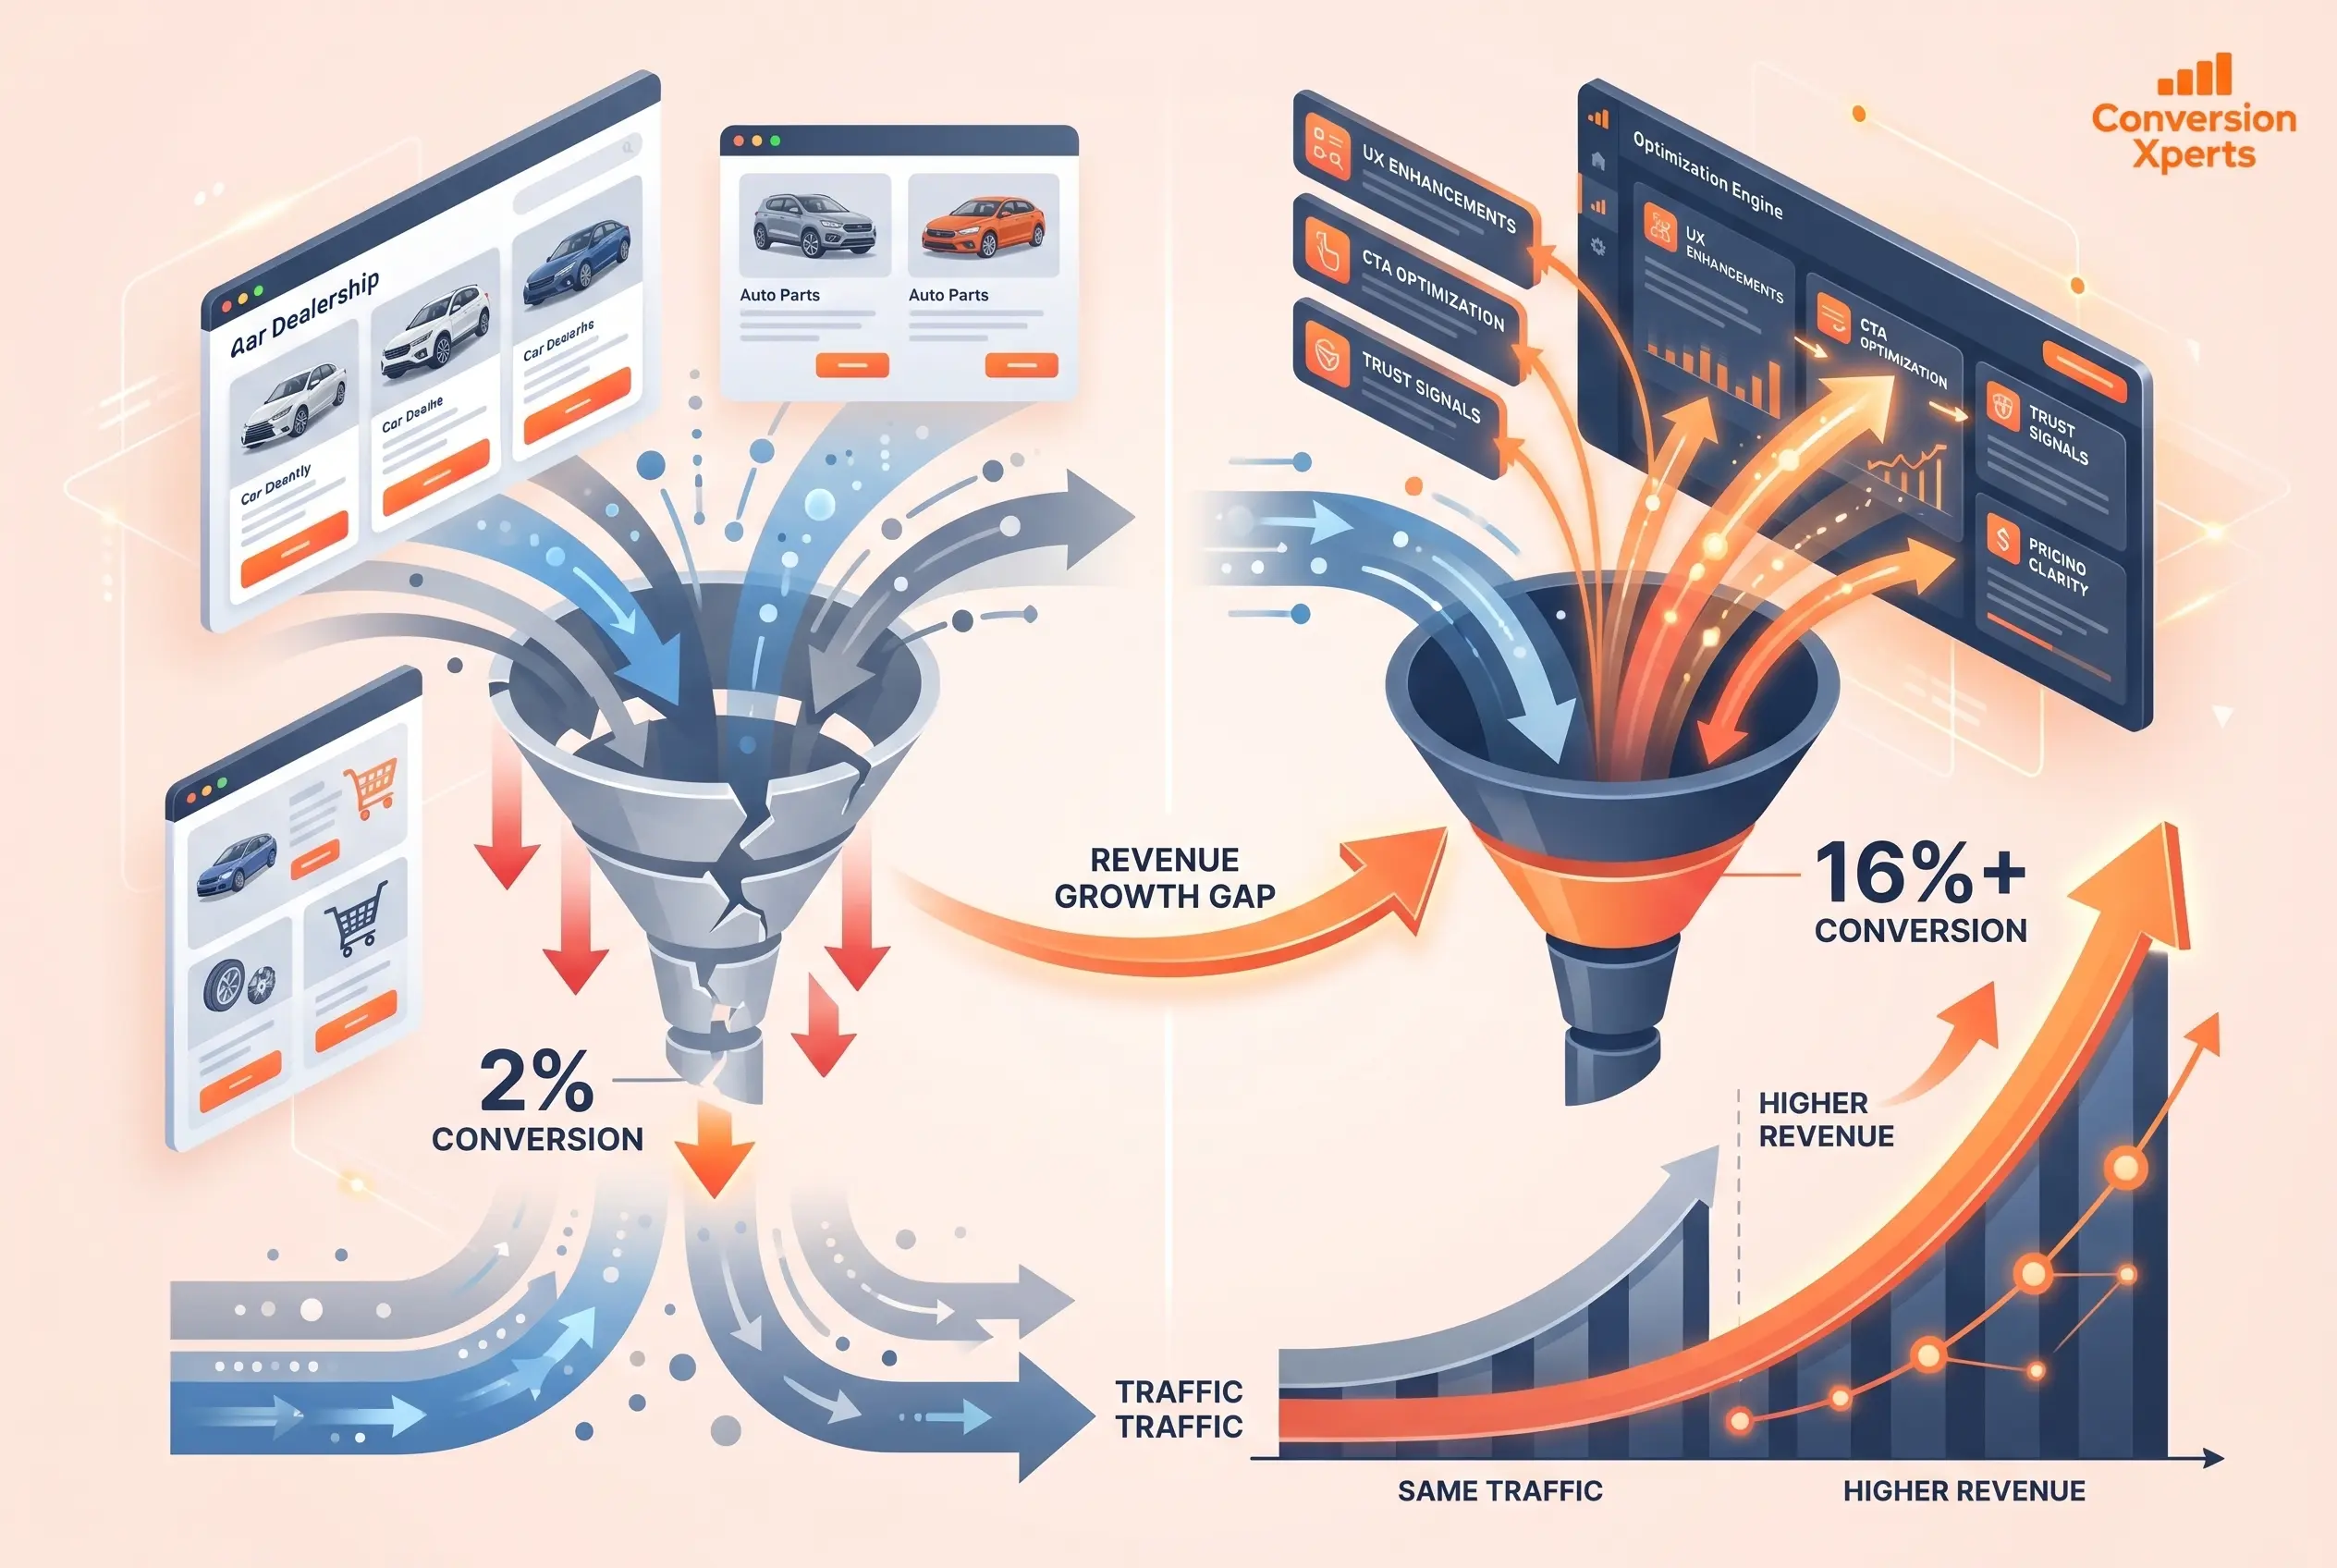
Most automotive websites are quietly bleeding money every single day. The average automotive website converts just 2% of its visitors, yet the top 10% of performers regularly hit 16% or higher. That is an 8x gap in revenue from the exact same traffic.
If you run a dealership, an auto parts ecommerce store, or a B2B automotive supplier, automotive conversion rate optimization (CRO) is the single highest-leverage activity you can invest in right now. Rather than spending more on ads to bring in new traffic, CRO fixes the leaks in your existing funnel so every visitor is worth more to your business.
In this guide you will learn:
- What automotive conversion rate optimization is and why it is different from other industries
- The exact CRO tactics that work for dealerships, ecommerce stores, and B2B automotive companies
- Real data benchmarks so you know where you stand versus your competitors
- A step-by-step optimization process you can start this week
- Common mistakes that silently destroy conversion rates in the auto industry
Let’s get into it.
What Is Automotive Conversion Rate Optimization and Why Does It Matter
Automotive conversion rate optimization is the systematic process of increasing the percentage of website visitors who take a desired action, such as submitting a lead form, booking a test drive, requesting a quote, or completing a purchase.
Unlike general ecommerce or SaaS businesses, automotive CRO operates in a high-stakes, high-consideration environment. A car is one of the biggest purchases most people will ever make. An auto part ordered incorrectly can mean a wasted return and a frustrated customer. A B2B parts supplier losing a fleet buyer could mean losing a contract worth six figures annually.
This is why automotive CRO requires a different level of precision compared to industries where a visitor can make an impulse buy.
The True Cost of a Poor Conversion Rate
Here is how to think about the financial impact. Say your dealership website gets 10,000 visitors per month. At the industry average of 2%, you generate 200 leads. If you improve your conversion rate to just 4%, you get 400 leads from the same traffic budget. That doubles your lead volume without spending one extra dollar on ads.
According to data published by Ruler Analytics in 2024, the average conversion rate across 14 major industries sits at 2.9%. Automotive, at roughly 2%, sits below that average. Closing that gap is not a technical luxury. It is a revenue priority.
Why Automotive Buyers Behave Differently Online
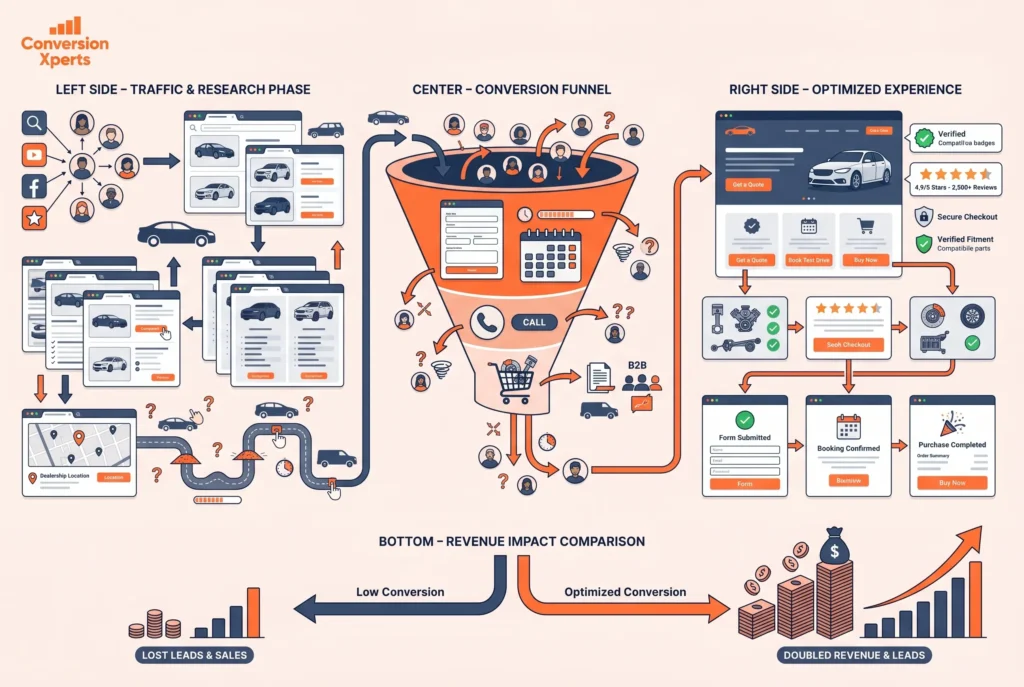
Car buyers typically spend 14 or more hours researching online before they ever contact a dealership, according to Cox Automotive’s 2024 Car Buyer Journey Study. That research happens across review sites, manufacturer pages, YouTube videos, and social media. By the time someone lands on your website, they are not beginning their journey. They are often near the end of it.
This changes everything about how you should design your conversion funnel. Your job is not to educate them from scratch. Your job is to remove doubt, answer the last few specific questions, and make it easy to take the next step.
For auto parts ecommerce, the dynamic is slightly different. Shoppers are highly technical. They need to confirm fitment before they buy. They scan specifications obsessively. Your conversion rate optimization for this segment is about eliminating technical friction and building fitment confidence fast.
For B2B automotive buyers, the decision involves multiple stakeholders, procurement processes, and longer sales cycles. B2B optimization here is about capturing and nurturing interest across a longer period rather than expecting a single visit to convert.
Automotive CRO Benchmarks: What Is a Good Conversion Rate
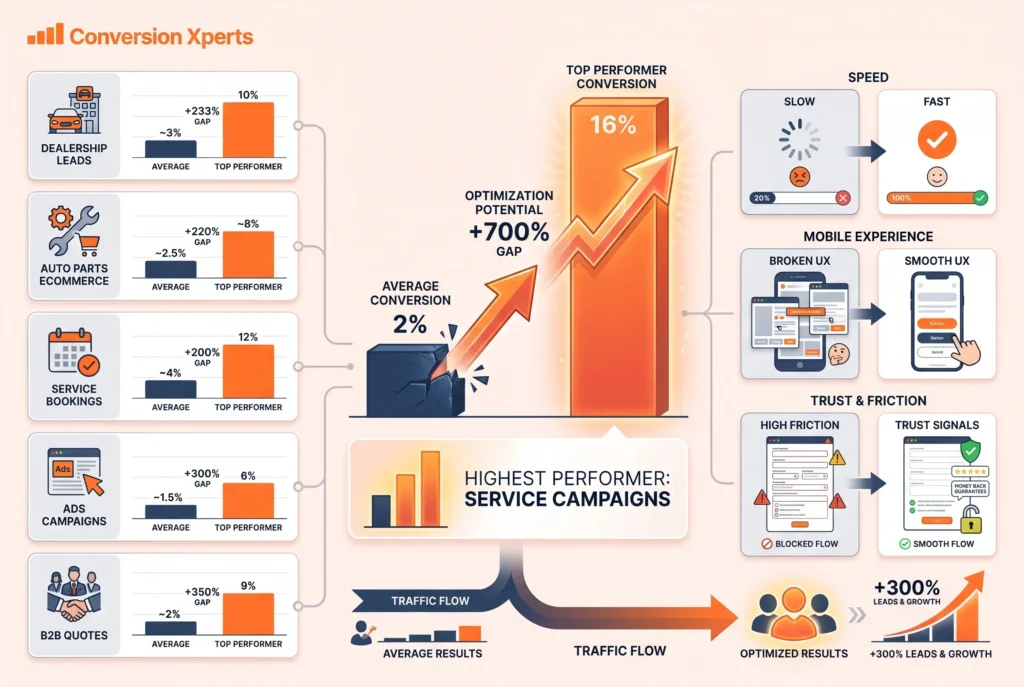
A good automotive conversion rate depends on the type of conversion you are measuring. For vehicle sales leads, industry benchmarks suggest 2 to 4% is average, while top performers reach 8 to 16%. For automotive ecommerce (parts and accessories), the average sits at 2.1%.
Understanding these numbers matters because setting the wrong benchmark leads to wrong conclusions about your site’s performance.
Conversion Rate Benchmarks by Automotive Segment
| Segment | Average Conversion Rate | Top Performers |
Dealership Lead Forms | 2 to 4% | 8 to 16% |
Auto Parts Ecommerce | 2.1% | 5 to 8% |
Service Department Booking | 4 to 6% | 10 to 14% |
Google Ads (Service Campaigns) | 14.67% | Up to 20% |
Google Ads (Vehicle Sales) | 7.76% | 12%+ |
B2B Automotive Quote Requests | 1 to 3% | 5 to 7% |
Sources: Ruler Analytics 2024, DemandLocal 2025, Scube Marketing 2025
One figure stands out in that table. Google Search campaigns for automotive service departments convert at 14.67% according to 2025 data from DemandLocal. That is nearly double the rate for vehicle sales campaigns. Service departments are an underutilized conversion goldmine in most dealership marketing strategies.
Why the Gap Between Average and Top Performers Is So Wide
The gap between 2% and 16% is not explained by different traffic quality alone. It comes down to three things:
First, page speed. Research consistently shows that a one-second delay in page load time reduces conversions by roughly 7%. Automotive sites, loaded with high-resolution vehicle photos and complex inventory databases, are especially vulnerable to speed issues.
Second, mobile experience. As of 2025, mobile devices account for 58 to 60% of all web traffic globally, according to web design statistics from Loopex Digital. In automotive, nearly 70% of consumers check online reviews on their smartphones rather than speaking to a salesperson in person. If your mobile experience is clunky or slow, you are losing those buyers silently.
Third, trust and friction. Automotive is a high-anxiety purchase category. Buyers worry about making the wrong choice, overpaying, or being pressured. Every friction point, every confusing form, every missing piece of information amplifies that anxiety. Top performers have systematically eliminated every unnecessary step between interest and action.
Website Optimization for Dealerships
Dealership website optimization means designing every page element, from vehicle detail pages to contact forms, to guide high-intent visitors toward scheduling a test drive, calling the showroom, or submitting a lead within the fewest possible steps.
Most dealership websites were not designed with CRO in mind. They were designed to look impressive. The result is beautiful pages that convert poorly. Here is how to change that.
Optimizing Vehicle Detail Pages (VDPs)
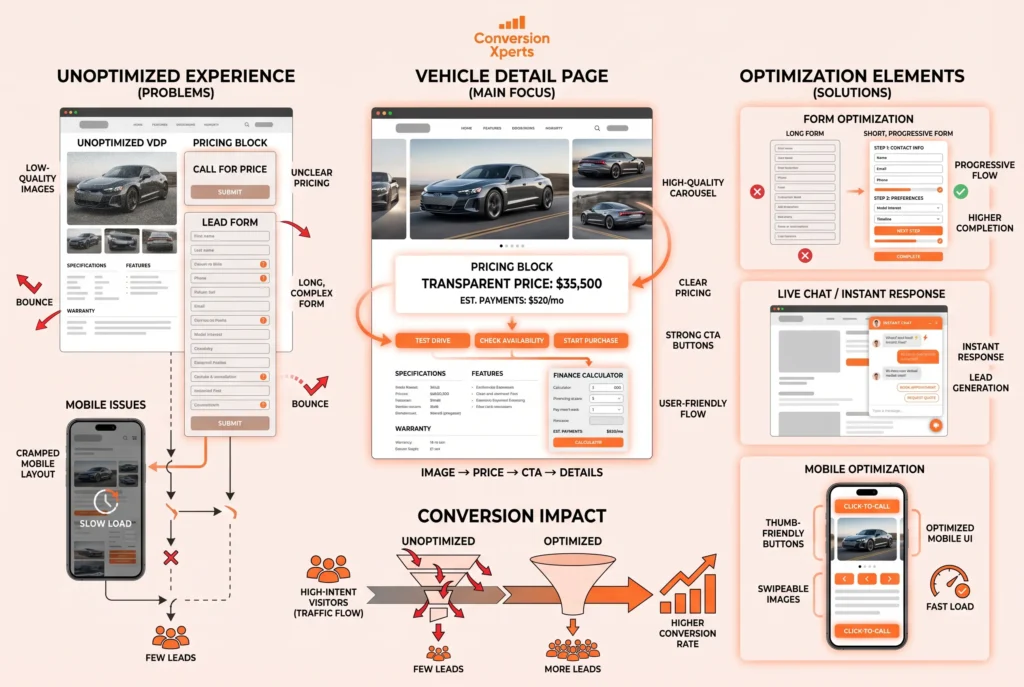
The Vehicle Detail Page is the most important conversion page on any dealership website. It is where in-market buyers arrive after clicking on a specific vehicle from search results or inventory listings. Your VDP is your highest-leverage CRO opportunity.
What a high-converting VDP must include:
Photos matter enormously. Dealerships using high-quality, multi-angle photos (at least 20 per vehicle) see significantly higher engagement than those using 5 to 8 stock images. Buyers want to see the actual car they will buy, not a representative photo from a manufacturer catalog.
Pricing transparency is non-negotiable in 2025. Buyers who encounter opaque pricing or “call for price” listings bounce at dramatically higher rates. Research from Spyne’s 2025 analysis of dealership conversion patterns shows that pricing transparency directly correlates with lead form submission rates.
The call to action on a VDP should be specific and low-commitment. “Schedule a Test Drive” outperforms generic “Contact Us” buttons because it describes exactly what happens next. A buyer knows what they are agreeing to, which reduces hesitation.
Financing calculators embedded directly on VDPs reduce the cognitive work of imagining affordability. When a buyer can immediately see that monthly payments fit their budget, the path to conversion shortens.
Reducing Form Friction
Long forms kill conversions in automotive just as they do in every other industry. The standard practice of asking for name, email, phone, address, preferred contact time, message, and four other fields on a single form is a conversion killer.
The best approach is progressive profiling. Collect the minimum information needed for the first micro-conversion (a name and email, or a name and phone number), then gather additional information through follow-up communications. A dealership running a progressive form capturing just three fields consistently outperforms one running a seven-field form, even though both ultimately collect the same information over time.
Dynamic forms that appear based on user behavior perform even better. If a visitor has spent significant time on a specific vehicle’s page, a form offering to check availability for that exact vehicle converts at a higher rate than a generic contact form.
Live Chat and Instant Response
Speed of response is a documented conversion factor in automotive. Studies consistently show that lead response time under five minutes produces dramatically higher contact rates than responses delivered an hour or more later.
Live chat covers the critical gap between form submission and human response. For dealerships without 24/7 staffing, AI-powered chat tools handle initial inquiries, qualify intent, and schedule callbacks. The key is that the chat widget must be proactive, not passive. Triggered messages based on time on page or specific page type (like a VDP) outperform generic chat bubbles that just sit in a corner.
Mobile Optimization for Dealership Sites
A poorly optimized mobile site does not just result in lost conversions during a single visit. According to a Google study cited in Shopify’s 2024 CRO report, visitors who have a negative mobile experience are 62% less likely to purchase from that brand in the future. The damage is compounding and long-term.
For dealership mobile sites, the specific issues to address are:
Load time. Mobile pages that take more than four seconds to load lose 63% of their visitors before they see any content. Six-second load times push that abandonment rate to 66% according to 2026 web design statistics from Loopex Digital.
Navigation simplicity. The vehicle search experience on mobile needs to function like a native app, not a condensed version of a desktop interface. Filters must be thumb-friendly. Photos must swipe naturally. CTAs must be large enough to tap without pinching.
Click-to-call placement. On mobile, a prominently placed click-to-call button is one of the highest-converting elements on a dealership site. Buyers who are close to a decision and browsing on their phone often prefer a direct call to filling out a form.
Ecommerce CRO for Auto Parts and Accessories
Ecommerce CRO for auto parts means systematically removing the technical, fitment, and trust barriers that prevent shoppers from completing purchases on parts and accessories websites.
The auto parts ecommerce space is fundamentally different from general retail ecommerce. Shoppers are not buying on impulse or aesthetics. They are buying based on compatibility and technical confidence. This creates a specific and predictable set of conversion barriers that, once addressed, can lift your conversion rate significantly above the industry average of 2.1%.
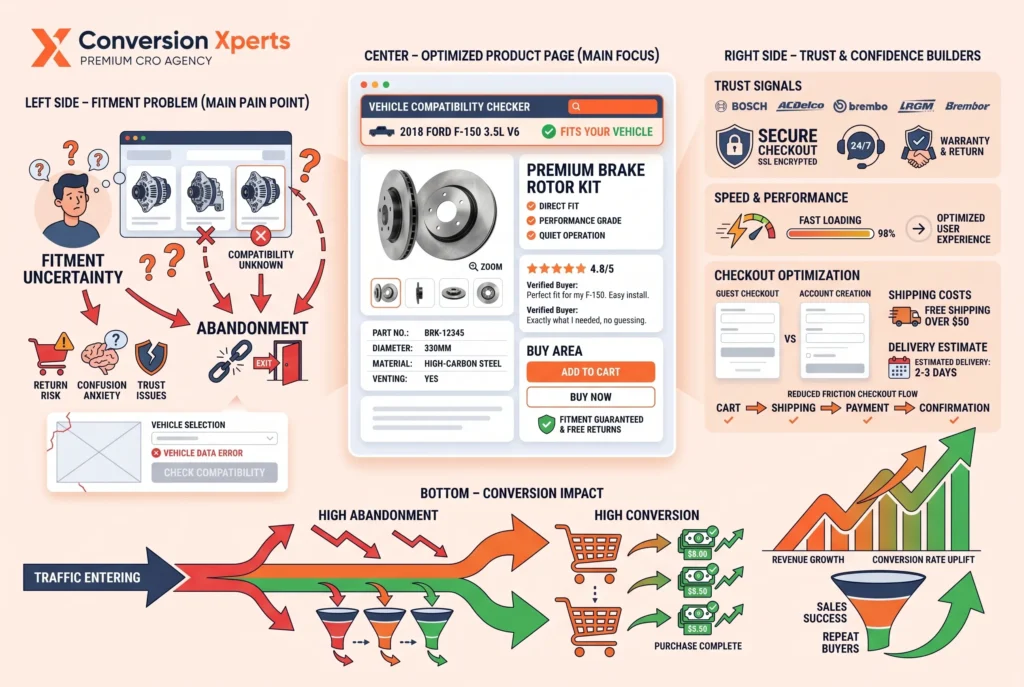
The Fitment Problem: Your Biggest Conversion Barrier
The number one reason automotive ecommerce shoppers abandon without purchasing is fitment uncertainty. They are not sure the part will fit their vehicle. They do not want to deal with a return. So they leave to research more, and many of them never come back.
A vehicle compatibility checker at the top of every product page, above the fold, is the single highest-impact CRO change most auto parts sites can make. According to Scube Marketing’s 2025 analysis of automotive ecommerce optimization, this element directly impacts whether a customer continues toward purchase or bounces.
The compatibility checker should do two things: display a clear green checkmark with “Fits your [Year Make Model]” when the part is compatible, and display an equally clear indicator with alternative suggestions when it is not. Ambiguity in compatibility messaging is a conversion killer.
Product Page Optimization for Parts
Auto parts shoppers do not read product descriptions top to bottom. They scan for the specific information that matters to their decision. That means your product pages need to be structured around scannable hierarchies, not dense paragraphs.
The elements high-converting parts product pages always include:
Compatibility confirmation at the very top, before anything else. If a shopper has entered their vehicle, this confirmation should be persistent and obvious throughout the page.
High-resolution images from multiple angles. Many parts purchases fail because buyers cannot tell from one photo whether the part is the right style, finish, or orientation. An OEM alternator and an aftermarket one can look very similar but be packaged differently. Show this clearly.
Technical specifications formatted as a scannable table, not a paragraph. Part number, material, finish, dimensions, weight, warranty, included hardware. Buyers check these against their existing parts or manufacturer specs.
Real reviews from verified buyers who specify their vehicle make and model. A review that says “Fits my 2019 Ford F-150 XLT perfectly, installed in under an hour” is worth ten generic five-star ratings.
Return and fitment guarantee information near the buy button. Not at the bottom of the page in a footer link. Right next to the purchase action. Fitment anxiety is highest at the moment of the purchase decision. Address it there.
Site Speed for Parts Ecommerce
Auto parts sites face specific speed challenges. Large image libraries, complex fitment databases, and inventory management systems all add to page weight. According to data from Shopify’s 2024 CRO statistics report, every one-second delay in mobile load time reduces conversions by up to 20%.
The practical priorities for an auto parts site are: lazy loading for images below the fold (especially important for long product pages), server-side rendering or caching for inventory and compatibility data, and content delivery networks for image assets.
Trust Signals Specific to Automotive Ecommerce
Auto parts buyers are risk-averse. They worry about buying a counterfeit or substandard part. They worry about ordering the wrong thing. They worry about getting stuck with an item that cannot be returned.
Trust signals that move the needle in automotive ecommerce specifically include: OEM or brand logos prominently displayed, secure checkout indicators, clear and specific return policies (not vague “easy returns” language), phone number or chat support visible throughout the checkout process, and real-time inventory status so buyers do not find out a part is backordered after submitting payment.
Checkout Optimization for Parts and Accessories
Cart abandonment in automotive ecommerce sits around the industry ecommerce average of 70 to 80%. A significant portion of this is recoverable through checkout optimization.
The three most impactful checkout improvements for auto parts sites are: a guest checkout option (many parts buyers are not interested in creating an account to purchase one sensor), transparent shipping costs shown before the payment step (unexpected shipping costs are the top reason for cart abandonment across all ecommerce), and a clear estimated delivery date at checkout rather than just a shipping method name.
B2B Optimization for Automotive Suppliers and Wholesalers
B2B optimization for automotive businesses means building digital funnels that capture and nurture professional buyers, fleet managers, and procurement teams across longer sales cycles with higher order values.
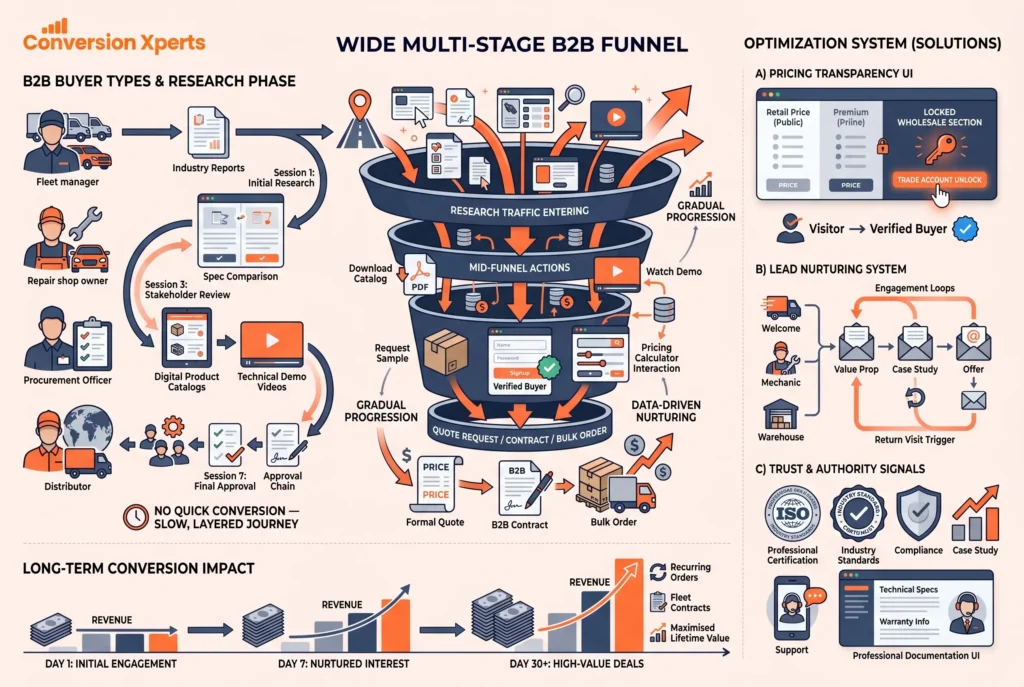
B2B automotive is a distinct market from retail dealerships or consumer parts ecommerce. Your buyers are fleet managers, repair shop owners, purchasing managers at manufacturing facilities, and wholesale distributors. They evaluate vendors differently, make decisions through committees, and have procurement processes that a single optimized landing page cannot shortcut.
This does not mean B2B optimization is less important. It means it requires a different approach.
Understanding the B2B Automotive Buyer Journey
B2B automotive purchases almost never happen in a single session. A fleet manager evaluating a new tire supplier will research across multiple sessions over days or weeks. They will compare pricing, check references, review certifications, and possibly request a sample order before committing to a volume contract.
Your B2B optimization strategy must account for this extended journey. The most common mistake B2B automotive sites make is optimizing only for immediate conversion (requesting a quote, calling now) while neglecting the middle and upper funnel actions that move buyers toward readiness.
Mid-funnel conversion actions that B2B automotive sites should track and optimize include: downloading a product catalog or specification sheet, requesting a sample or trial order, signing up for a trade account application, watching a product demonstration video, and using an order quantity calculator to estimate pricing.
The B2B Pricing Transparency Challenge
Many B2B automotive suppliers resist showing pricing on their websites, preferring to capture leads with a “request a quote” model. This is often a mistake. According to research on B2B buying behavior, modern B2B buyers are self-directed. They want to qualify a vendor before investing time in a conversation.
A better approach is tiered pricing transparency. Show retail pricing clearly, indicate that trade/wholesale pricing is available, and create a simple trade account application that captures the buyer’s business information in exchange for access to wholesale rates. This filters for serious buyers while respecting their preference for self-service research.
Lead Nurturing for B2B Automotive Funnels
Email marketing generates between $20 and $30 returns for every dollar invested in automotive-specific campaigns, according to 2025 data from DemandLocal. For B2B automotive, this channel is even more valuable because buyers re-enter the funnel periodically as needs arise.
The B2B automotive email nurture sequence should do three things: educate the buyer about your product advantages and use cases, demonstrate social proof from similar businesses or fleet operators, and make it easy to re-engage with a specific next step when the buyer is ready.
Segmenting your B2B email list by vehicle type, fleet size, or product category dramatically improves relevance and therefore conversion rates from email. A fleet manager running diesel trucks does not want content about passenger car components.
B2B Website Trust and Authority Signals
B2B automotive buyers conduct extensive vendor due diligence. Your website needs to signal institutional trustworthiness, not just product quality.
The highest-impact trust signals for B2B automotive include: manufacturer certifications and OEM approvals displayed prominently, named case studies from recognizable fleet operators or repair networks, a dedicated trade account section with a visible application process, phone support staffed by product specialists (not general customer service), and downloadable compliance documents, safety data sheets, or technical certifications for each product category.
SaaS CRO Lessons Applied to Automotive Lead Funnels
SaaS CRO principles, particularly the focus on reducing friction in trial or sign-up flows, translate directly to automotive lead generation when applied to test drive booking, financing applications, and trade-in valuation tools.
The automotive industry has been slow to adopt digital conversion techniques that software companies have perfected over the past decade. SaaS companies optimize every single step of their trial or onboarding flow, treating each click as a measurable conversion event. Applying this same discipline to automotive lead funnels produces significant results.
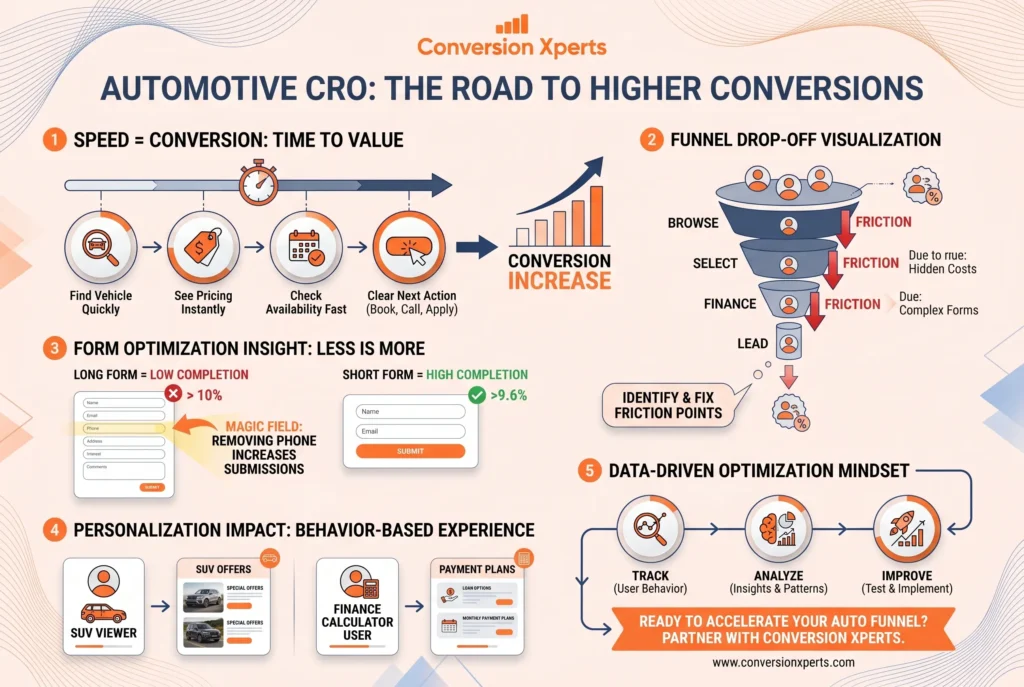
The SaaS Concept of “Time to Value” in Automotive
SaaS companies obsess over time to value, meaning how quickly a trial user experiences the core benefit of the software. In automotive, time to value means how quickly a website visitor gets to information that moves them closer to a buying decision.
For a dealership, time to value might be: how quickly a visitor finds the right vehicle, sees transparent pricing, confirms availability, and is presented with a clear next step. Every extra click between arrival and that moment costs conversions.
Mapping this journey and measuring drop-off at each stage is standard practice in SaaS and should be standard in automotive. Use session recording tools like Microsoft Clarity or Hotjar to identify exactly where visitors abandon your conversion funnel. The data is almost always surprising.
Applying Conversion Rate Principles from SaaS to Automotive Forms
SaaS sign-up forms have been A/B tested by thousands of companies over decades. The accumulated knowledge is clear: shorter forms convert more visitors initially. Lead nurturing then collects additional information over time.
The specific SaaS insight that dealerships underutilize is the concept of a “magic field.” Research in SaaS CRO consistently shows that removing the phone number field from initial forms increases form completion rates dramatically, even though buyers often provide their phone number voluntarily in a follow-up message once they trust the business enough to do so.
For dealerships concerned about lead quality, the solution is not to ask for more information upfront. It is to qualify leads through the follow-up conversation rather than the initial form.
Personalization in Automotive Lead Funnels
SaaS companies use behavioral data to personalize onboarding flows based on what a user has done in the app. The automotive equivalent is personalizing follow-up communications and website experiences based on what a visitor has browsed.
A visitor who has spent time on three different SUV VDPs and used the payment calculator should receive follow-up content about SUV financing options, not a generic “thanks for contacting us” email. This level of personalization, made possible by CRM tools and marketing automation, consistently produces higher engagement and conversion rates in automotive.
According to data from Unbounce cited in Shopify’s 2024 CRO statistics, ecommerce marketers using AI-powered personalization tools convert up to 30% more visitors than those without personalization. Automotive brands applying the same principle to their follow-up sequences see comparable improvements.
A/B Testing and Data-Driven CRO for Automotive Sites
A/B testing in automotive CRO means running controlled experiments on individual page elements to measure which version produces higher conversion rates, using data rather than opinion to guide optimization decisions.
More than 60% of companies across industries use A/B testing to evaluate landing pages, according to Startup Voyager’s 2025 CRO research. In automotive, A/B testing is particularly valuable because the stakes of each conversion are high and the margin for error is low.
What to Test First on Automotive Sites
Not all A/B tests deliver results. Research from AppSumo found that only 1 in 8 A/B tests produces a conclusive winning variation. This makes the prioritization of what to test critically important. You want to start with high-traffic, high-impact pages where even a small conversion lift produces meaningful revenue change.
For dealerships, the priority testing order is: VDP hero section and primary CTA, main navigation and search filters, form length and field order, homepage hero offer and messaging, and pricing display format.
For auto parts ecommerce, the priority order is: compatibility checker placement and design, product page image layout, add-to-cart button copy and placement, checkout form length and field arrangement, and trust signal placement near the purchase action.
How to Run a Valid Automotive CRO Test
A valid A/B test requires sufficient traffic volume to reach statistical significance. For most automotive sites, this means running tests for a minimum of two weeks, regardless of how quickly one variation starts to lead. Traffic varies significantly by day of week in automotive (weekend traffic spikes are common at dealerships) and by season.
The correct process for each test is:
First, identify a specific hypothesis. Not “let’s test a new button color” but rather “changing the primary CTA from ‘Contact Us’ to ‘Check Availability’ will increase VDP lead form submissions because it sets clearer expectations for what happens next.”
Second, run the test with a 50/50 split until you reach 95% statistical significance or a minimum of two weeks, whichever is longer.
Third, document the result, implement the winner, and move to the next hypothesis. CRO is cumulative. Each winning test compounds on the previous ones.
Key Metrics to Track Beyond Conversion Rate
Tracking only raw conversion rate misses important context. A change that increases form submissions but decreases appointment show rates has not actually improved your business outcome.
The metrics automotive CRO teams should track alongside conversion rate include: lead quality score (often measured by appointment set rate or lead-to-sale rate), cost per qualified lead, time on page before conversion, bounce rate on entry pages, and mobile versus desktop conversion rate split (a wide gap here almost always signals a mobile experience problem).
Tools for Automotive CRO Measurement
The foundational analytics setup for automotive CRO includes Google Analytics 4 with properly configured conversion events, Microsoft Clarity or Hotjar for session recordings and heatmaps, and a dedicated A/B testing platform such as Google Optimize alternatives (VWO, Optimizely, or Convert) since Google Optimize was discontinued in 2023.
For automotive ecommerce specifically, ensuring your analytics correctly tracks the full funnel from product view through fitment check through add-to-cart through purchase is non-negotiable. Many auto parts sites track only final purchases, missing critical data about where shoppers abandon the funnel earlier.