Amazon Conversion Rate Optimization: Proven Data-Driven Strategies That Actually Work in 2026
What Is Amazon Conversion Rate Optimization and Why It Matters More Than Traffic
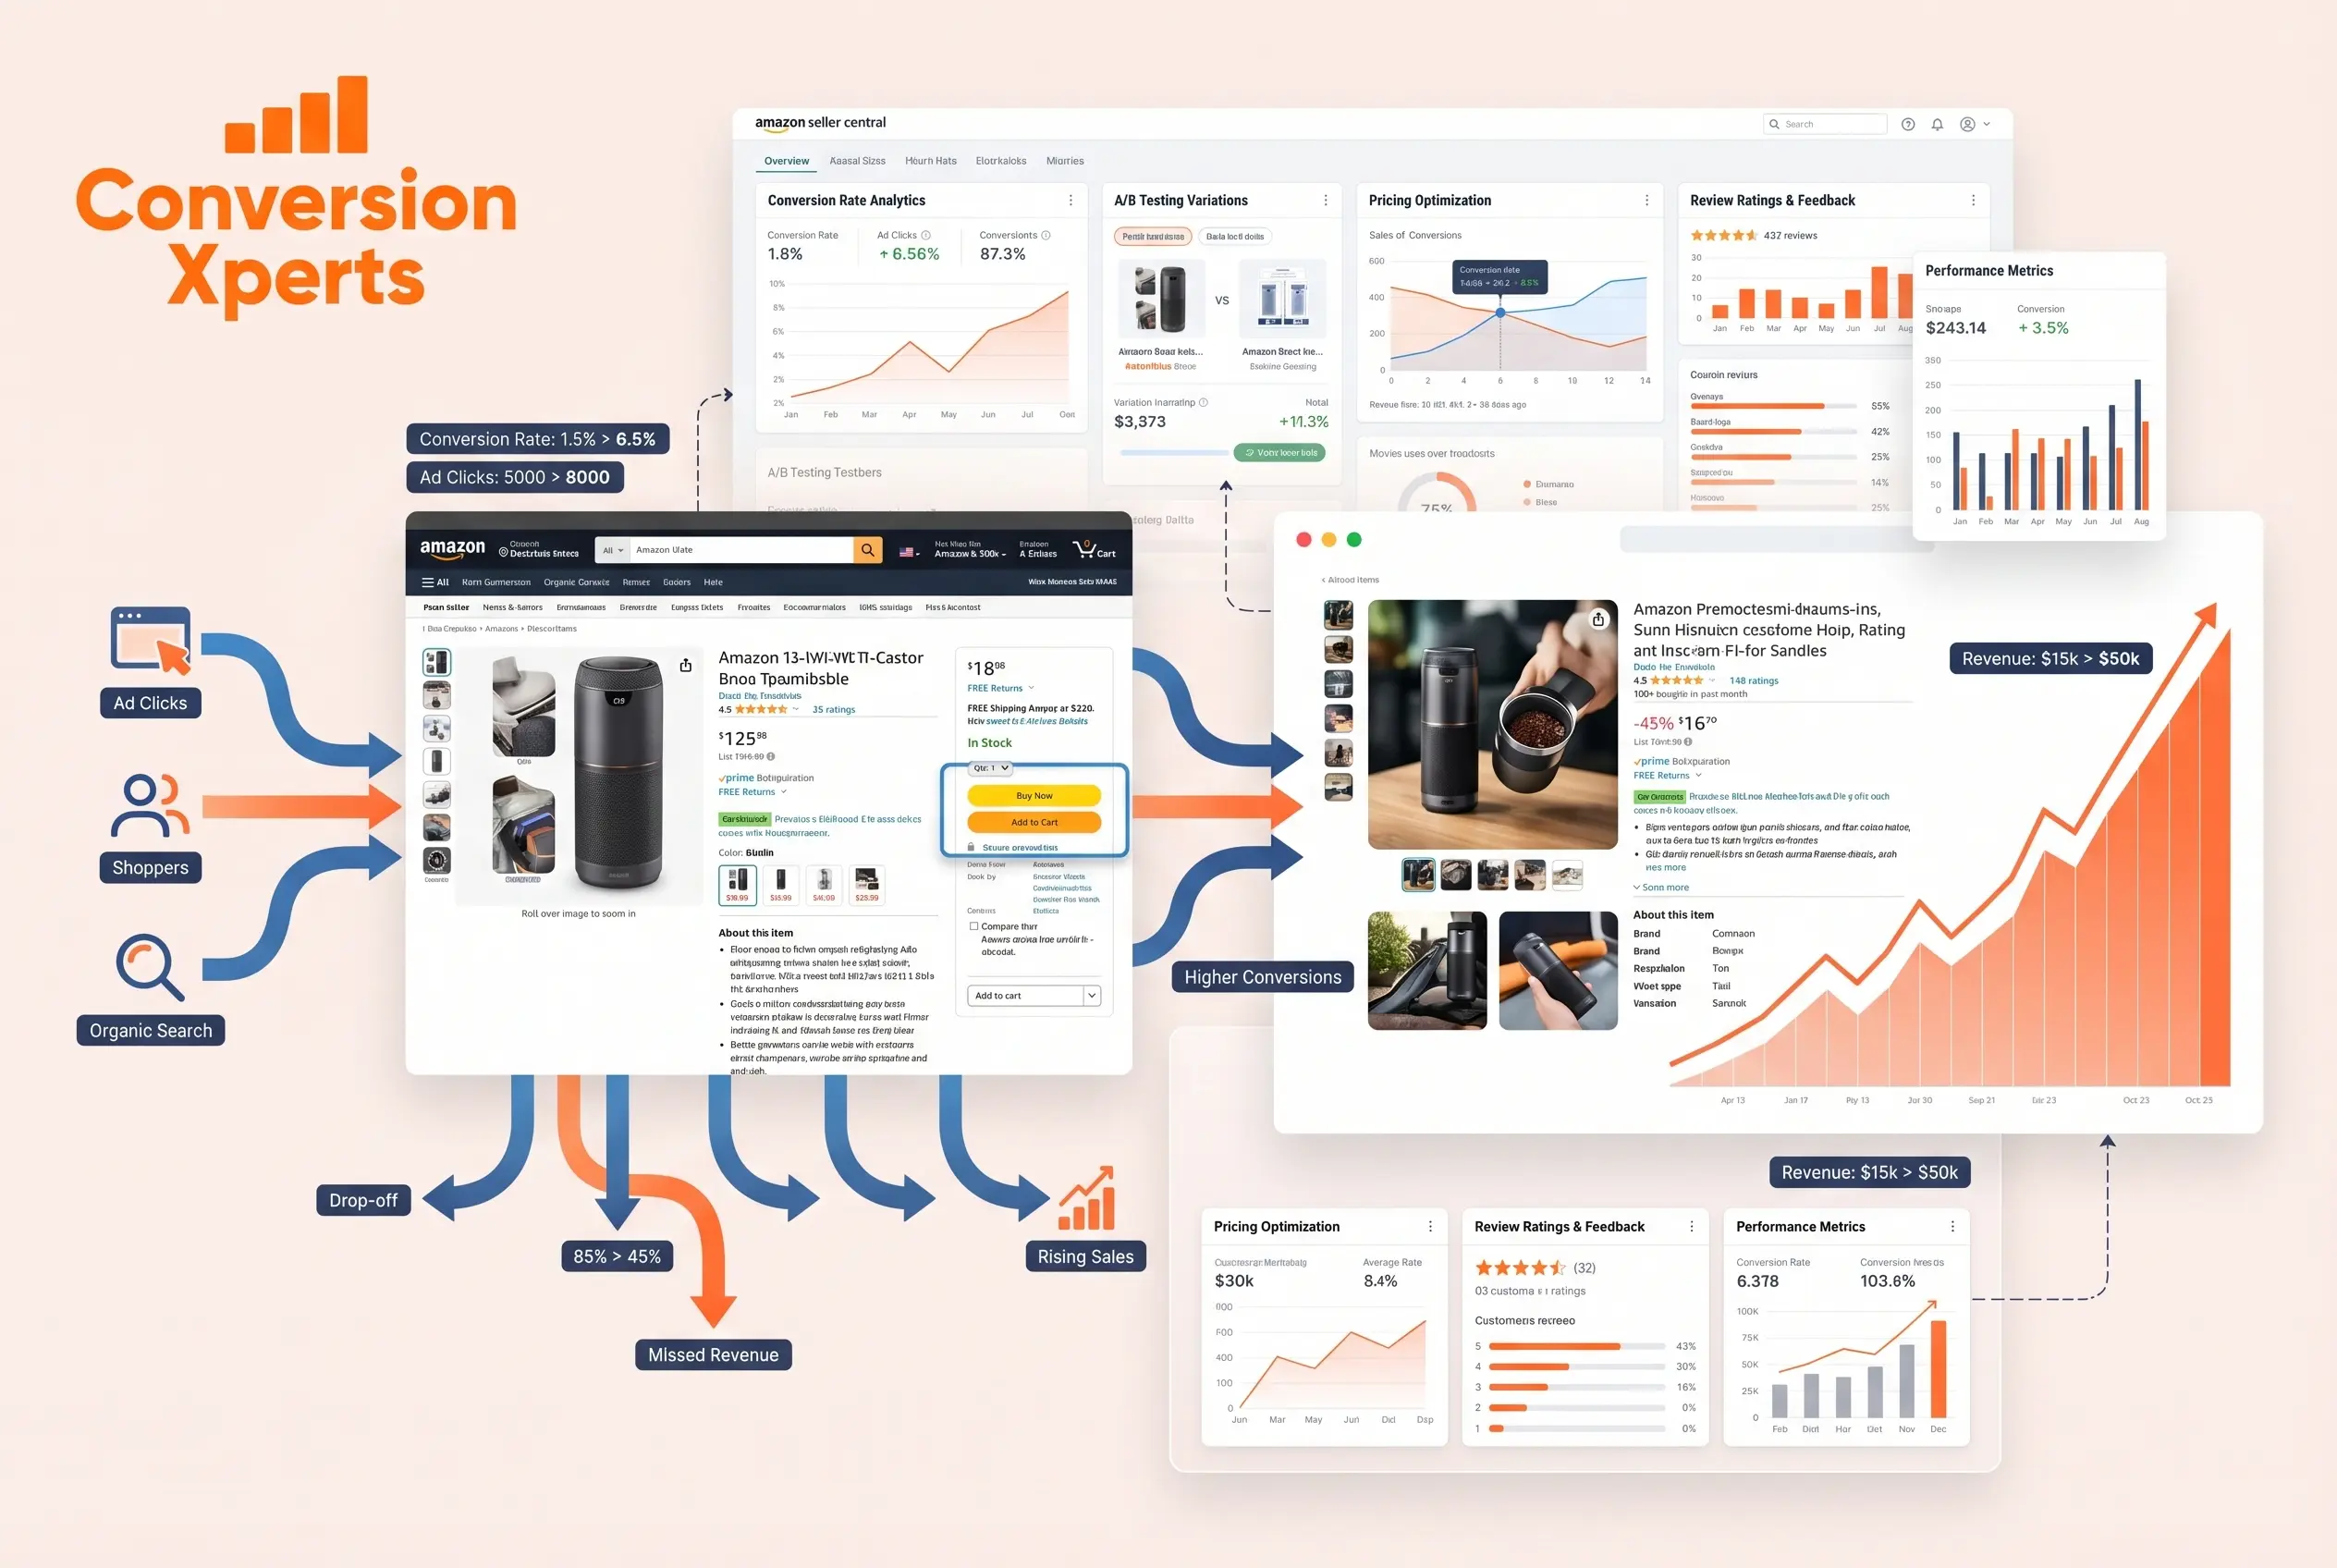
Amazon conversion rate optimization, often abbreviated as CRO, is the ongoing practice of refining every element of your product detail page to convert a higher percentage of visitors into paying customers. Unlike generic website CRO, Amazon CRO operates inside a closed, algorithm-driven ecosystem where your conversion rate does not just reflect your sales performance. It determines your visibility.
Most sellers pour money into sponsored ads, chasing more clicks and more sessions. But if your listing does not convert those sessions into purchases, you are essentially paying Amazon to show you to people who leave without buying. That is expensive and self-defeating.
Here is the structural reason this matters so deeply on Amazon specifically.
Amazon’s ranking algorithm, commonly referred to as A9 or A10, relies on a combination of data-driven factors to determine where your product appears in search results. The better your conversion rate, the faster your product ranks. A strong CVR indicates that customers find your product valuable and purchase it frequently.
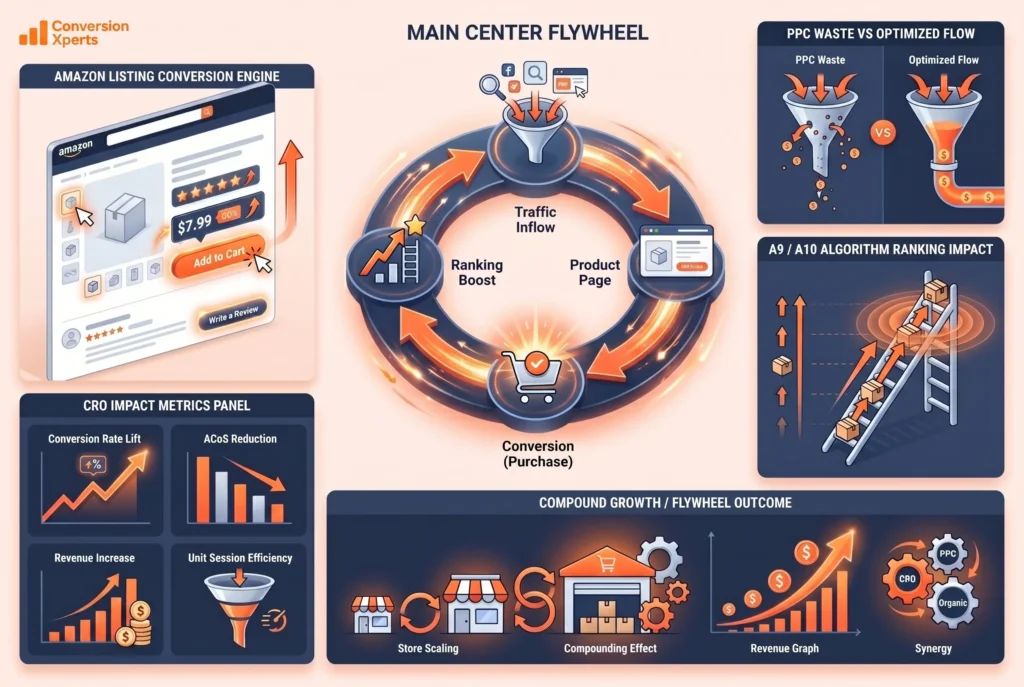
So improving your conversion rate does two things simultaneously. It increases the revenue you earn from your current traffic, and it signals to Amazon’s algorithm that your product deserves better placement in organic search results. That improved placement brings more traffic, which, if your listing is optimized, produces more conversions, which in turn lifts your rank even further. This is what sophisticated Amazon brands call the flywheel.
Effective conversion rate optimization is the engine that transforms paid clicks into profitable sales and, crucially, improved organic rankings, the holy grail of Amazon success. Every percentage point gained in your conversion rate directly impacts your unit session percentage, a key factor in Amazon’s A9 algorithm.
The sellers who treat CRO as a one-time task, or worse, as an afterthought after advertising setup, consistently underperform the sellers who treat it as an always-on growth engine. The data is unambiguous on this point.
Why Most Sellers Ignore CRO Until It Is Too Late
The most common failure pattern we see at ConversionXperts.com is the “traffic-first” trap. A seller launches a product, turns on PPC, drives sessions to the page, and then watches the conversion rate sit at 4% or 5% while wondering why ACoS is out of control. The fix they reach for is usually more spend, better keywords, or lower bids. None of those fixes address the root problem, which is that the listing itself is not persuasive enough to convert the traffic it is already getting.
A 1% lift in conversion rate on a product doing 1,000 sessions per day means 10 additional sales every day. At a $40 average order value, that is $400 in incremental daily revenue from zero additional ad spend. Compounded over a year, a single percentage point of CVR improvement is worth more than most sellers realize.
The Relationship Between CVR, ACoS, and Organic Rank
When your conversion rate improves, your advertising efficiency improves automatically. A higher conversion rate directly lowers your ACoS and increases overall profitability. Every sale generated from a strategically targeted PPC campaign performs double duty: it delivers immediate revenue while simultaneously strengthening the organic foundation of your business.
This is the interconnected nature of modern Amazon strategy. Listing quality, pricing, reviews, PPC, and inventory health are not separate levers. They are one system. When they are all aligned and optimized together, the results compound in ways that no single tactic can replicate on its own.
How to Calculate Your Amazon Conversion Rate and Find Your Benchmarks
Amazon conversion rate, officially called the Unit Session Percentage Rate inside Seller Central, measures the percentage of sessions on your product detail page that resulted in at least one unit being purchased.
The formula is straightforward:
Conversion Rate = (Total Orders Divided by Total Sessions) Multiplied by 100
So if your product detail page received 500 sessions in a given week and generated 35 orders, your conversion rate is 7%.
Where to Find Your CVR Data in Seller Central
Finding this data is straightforward. Log into your Amazon Seller Central account. Navigate to the Reports tab and select Business Reports. From there, access the Detail Page Sales and Traffic report for a specific ASIN or your entire catalog.
Inside that report you will see columns for Sessions, Unit Session Percentage, and Units Ordered. The Unit Session Percentage is your conversion rate. Track this at the individual ASIN level, not just at the account level. A product with 3% CVR needs a completely different intervention than one sitting at 8%.
You should pull this report weekly and build a simple tracking sheet that shows CVR trends over time. Seasonal fluctuations, pricing changes, new review counts, and A/B test results all show up in this data. Without tracking it consistently, you are flying blind.
What Is a Good Amazon Conversion Rate? Category Benchmarks for 2025
The answer varies significantly by category, price point, and whether you are measuring organic traffic, sponsored traffic, or blended. Here is a practical benchmark table based on 2024 and 2025 industry data:
Performance Tier and Corresponding CVR Ranges by Traffic Type:
Below Average: Organic CVR below 8%, Sponsored CVR below 6%, Blended CVR below 5%
Average: Organic CVR between 10% and 15%, Sponsored CVR between 8% and 12%, Blended CVR between 6% and 10%
Strong: Organic CVR between 15% and 25%, Sponsored CVR between 12% and 18%, Blended CVR between 10% and 15%
Exceptional: Organic CVR above 25%, Sponsored CVR above 18%, Blended CVR above 15%
Good Amazon ads conversion rates fall between 8% and 12% for average performance and 13% to 15% or higher for excellent performance, with seasonal products often hitting 30% to 50%.
It is worth noting that average ecommerce conversion rates are around 2.5% to 3% according to industry leaders, which means Amazon as a platform already converts at a far higher baseline than most standalone websites. This is because shoppers arrive on Amazon with high purchase intent. They are not browsing casually the way they might on a brand website. That high intent is an advantage, but it also means that a subpar listing will waste a disproportionate share of that intent.
Clicks Versus Sessions: An Important Distinction
Many sellers confuse sessions and clicks. On Amazon, a session counts all page views from a single user within a 24-hour window as one session, regardless of how many times they visit. Clicks in your advertising reports count individual ad clicks and can be significantly higher than sessions if the same shopper clicks an ad multiple times. Always use sessions for your organic CVR calculation and advertising clicks for your ad-specific conversion rate calculation.
Data-Driven Listing Optimization Strategies That Move the Needle
Your product detail page is a sales page. Every element on it either moves a shopper closer to clicking “Add to Cart” or pushes them toward the back button. Data-driven Amazon conversion rate optimization means you make decisions about that page based on evidence, not assumptions.
Here are the specific elements that have the highest proven impact on CVR, ranked roughly by their influence on purchase decisions.
Main Product Image: Your Single Highest-Leverage Asset
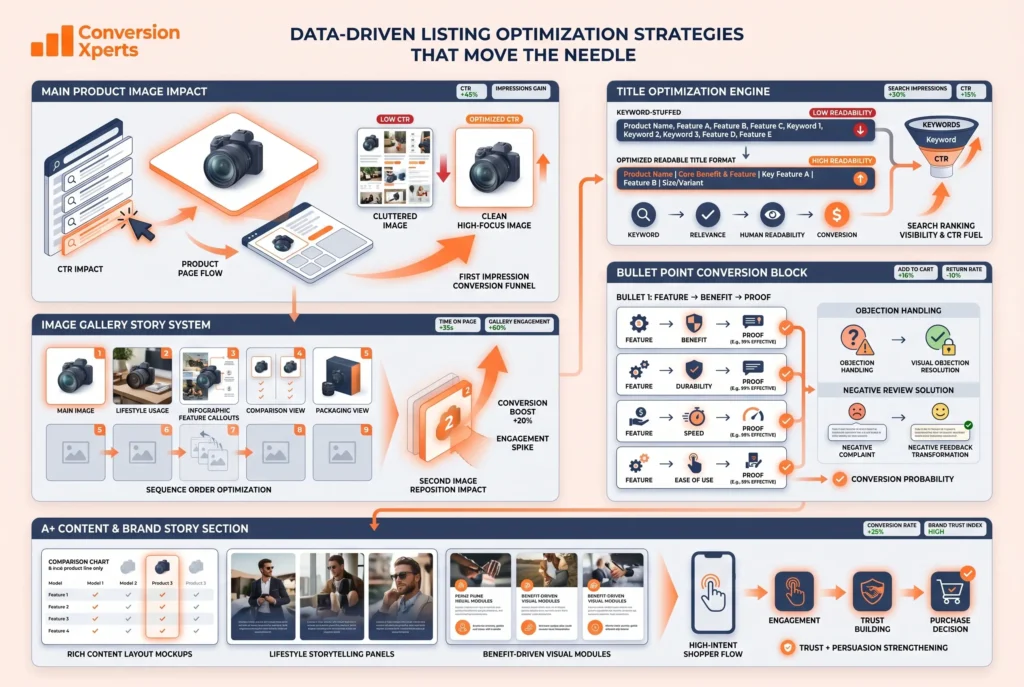
When a shopper lands on your product page, they make a buying decision in seconds. Your main image must be crisp, high-resolution, and immediately communicative. Avoid clutter. The product should occupy 85% of the frame on a white background. Test variations using Amazon’s A/B testing tool, Manage Your Experiments, to determine which version drives the most clicks and conversions.
The main image is the only element that appears in search results before a shopper ever visits your page. It influences click-through rate, which is the first step in the conversion funnel. A main image that fails to communicate the product clearly, show its scale, or stand out against competitors is costing you sessions before they even begin.
Beyond the main image, your secondary gallery images should tell a complete visual story. Lifestyle images showing the product in use, infographic images that call out key features and dimensions, comparison images showing your product versus alternatives, and packaging images all contribute to reducing purchase anxiety. You can upload a total of 9 images on your Amazon listing’s product detail page. Your images should cover all angles and dimensions of your product, include lifestyle images, and showcase the problem-solving aspect of your product.
The data behind image sequence also matters. In our testing at ConversionXperts.com, moving a benefit-focused infographic image from the fourth position to the second position consistently produces measurable CVR lifts. Shoppers who do not scroll far enough to see your strongest selling point cannot be influenced by it.
Title Optimization: The Art of Balancing Discoverability and Persuasion
Your product title serves two masters simultaneously. It needs to contain the keywords that get your product found in search, and it needs to read in a way that convinces a human being your product is relevant to their need.
The first 80 characters of the title are most visible in search results and carry higher ranking weight. A well-optimized title plays a crucial role in improving visibility, ranking, and conversions.
The most effective title structure leads with the brand name, follows with the primary keyword or use case, then layers in the most important specification that differentiates your product. For example, rather than “Water Bottle Stainless Steel 32oz BPA Free Insulated Sports Flask Leak Proof” (keyword-stuffed and hard to read), a better structure would be “HydroFlow Insulated Water Bottle, 32oz Stainless Steel, Stays Cold 24 Hours, Leak-Proof for Gym, Hiking, and Travel.”
Notice that the second version includes the primary keyword naturally, answers the most common shopper questions (size, material, duration of insulation, leakproof status), and mentions use cases that are also searchable terms. It reads like a real product description, not a keyword list.
Bullet Points: Five Sentences That Need to Do Heavy Lifting
Bullet points are the most read text element on a product detail page, yet most sellers write them as feature lists rather than benefit statements. Features tell shoppers what a product is. Benefits tell shoppers what a product does for them.
The highest converting bullet structure follows this pattern: start with the primary benefit in all capitals, then explain the feature that delivers that benefit, and close with a proof point or specification that validates the claim.
For example, instead of “High-quality stainless steel construction,” write “STAYS COLD FOR 24 HOURS because double-wall vacuum insulation creates a thermal barrier that outperforms plastic bottles in independent testing.”
Each bullet should also address a common objection or question in your category. Review your negative reviews and your competitor’s negative reviews. The objections shoppers mention most often are the objections your bullets should preemptively neutralize.
A+ Content and Brand Story: The Conversion Multiplier Most Sellers Underuse
According to Amazon, using A+ Content in the right manner can lead to conversion rate increases of up to 10%, and if used strategically it can be a game changer especially for the most competitive niches on Amazon.
A+ Content (also called Enhanced Brand Content for legacy accounts) allows brand-registered sellers to replace the plain text product description with rich visual modules that include comparison charts, lifestyle photography, brand narrative, and detailed feature callouts. Shoppers who scroll past the bullet points and into the A+ section are high-intent buyers who are still evaluating. This is your chance to close the sale with deeper storytelling and social proof.
A+ Content and Brand Story modules move skimmers along by pairing benefit-led copy with clear visuals. Keep text in text fields when possible, use descriptive alt text, and design for mobile where most sessions happen. The goal is to remove hesitation without resorting to hype.
One consistently underused A+ module is the comparison chart. A well-designed comparison table that shows your product alongside your own product line (not competitor products, which Amazon’s policies restrict) helps shoppers who are deciding between your SKUs, increases average order value through upsells, and reduces the likelihood they leave to comparison shop on a competitor’s page.
Pricing, Reviews, and the Trust Signals That Seal the Deal
Even the most beautifully optimized listing will fail to convert if the price feels wrong or if the social proof is thin. These two elements, price and reviews, are often the final decision-making factors for a shopper who has already read your title, viewed your images, and scanned your bullets.
Pricing Strategy for Maximum CVR
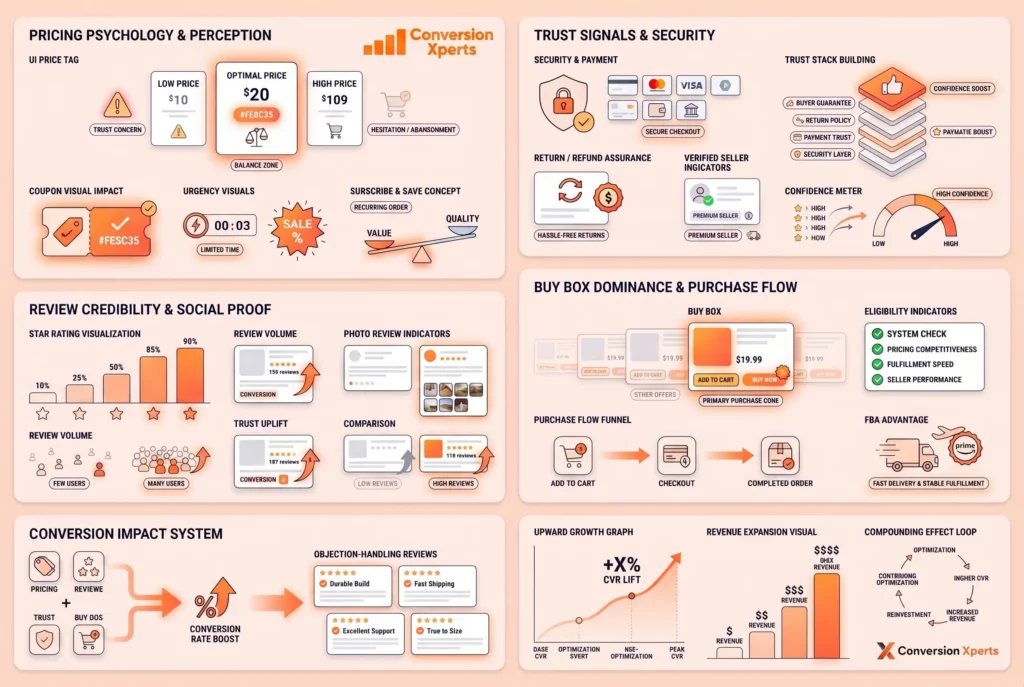
Price is not just a number. It is a signal. A price that is too low relative to competitors can actually reduce conversion by triggering quality concerns. A price that is too high without sufficient social proof to justify it leads to cart abandonment. The optimal price sits in the “perceived value sweet spot” for your category, a range where the price confirms rather than challenges the quality story your listing tells.
Several pricing tactics have demonstrated reliable CVR impact:
Charm pricing (ending in .99 or .97) consistently outperforms round numbers in most commodity categories. In premium or artisan categories, round numbers actually signal higher quality to price-sensitive shoppers.
Coupons displayed on the search results page (the green badge that shows “Save 15% with coupon”) increase click-through rate before a shopper even visits your page, and they reduce purchase hesitation at the decision point. Our data at ConversionXperts.com shows that even modest coupons (10% to 15%) can lift CVR by 8% to 14% for products in competitive categories.
Subscribe and Save eligibility signals long-term product confidence. A shopper who sees the Subscribe and Save option knows the product is popular enough to justify a recurring delivery. That social signal increases trust.
Lightning Deals and Prime Exclusive Discounts create urgency, which is one of the most powerful psychological triggers for conversion. The combination of price reduction and time pressure consistently produces CVR spikes during promotional windows.
Review Strategy: The Social Proof Foundation
Reviews remain a conversion pillar and they come with policy. If your product qualifies, Amazon Vine can seed credible reviews, but budget for the enrollment fee that Amazon charges once the first Vine review posts. Beyond Vine, use the Request a Review feature exactly once per order within Amazon’s timing window. The FTC’s 2024 rule against fake reviews adds real penalty risk, so keep outreach compliant and never incentivize ratings.
The relationship between review count, star rating, and conversion rate is well documented. Generally speaking, products below 4.0 stars face significant CVR drag, while the jump from 3.9 to 4.1 stars produces a disproportionately large conversion lift. Here is a practical benchmark:
Star Rating and Typical CVR Impact:
Below 3.5 stars: CVR severely suppressed, typically 40% to 60% below category average
3.5 to 3.9 stars: CVR moderately below category average, approximately 15% to 25% gap
4.0 to 4.3 stars: CVR at or near category average
4.4 to 4.7 stars: CVR above category average, typically 10% to 20% uplift
4.8 stars and above: CVR at premium level, can be 25% to 40% above category average depending on review volume
Review count matters as much as rating for high-ticket products. A product with 4.8 stars and 12 reviews converts significantly worse than one with 4.5 stars and 1,200 reviews. Volume creates credibility that a small sample of perfect ratings cannot match.
Review quality also matters in ways most sellers overlook. Reviews that mention specific use cases, that contain photos, that address common objections, and that compare favorably to alternatives all contribute to conversion lift beyond the raw star rating. Encouraging photo and video reviews through your post-purchase communication (compliant with Amazon’s policies) should be a standard part of your review strategy.
The Buy Box: The Gatekeeper Nobody Talks About Enough
Your conversion rate is essentially zero if you do not own the Featured Offer (formerly called the Buy Box). Eligibility for the Featured Offer matters because most shoppers add to cart from that buy box. Confirm you meet Amazon’s eligibility criteria, then protect fast delivery and price parity so you actually surface as the Featured Offer.
Buy Box eligibility depends on a combination of price competitiveness, seller metrics (order defect rate, late shipment rate, valid tracking rate), and fulfillment method. FBA sellers have a structural advantage because Amazon controls the fulfillment experience, which removes variance from the equation.
Amazon PPC and the CRO Flywheel That Drives Organic Growth
Amazon PPC and conversion rate optimization are not separate disciplines. They are two parts of the same growth system, and the most sophisticated brands treat them as inseparable.
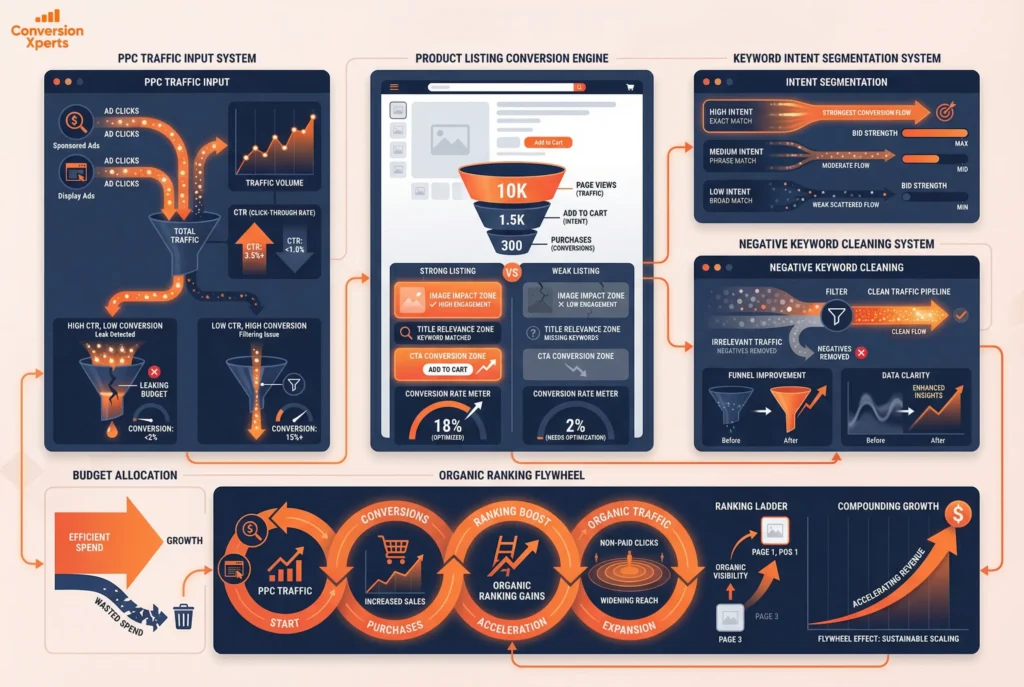
Here is the core logic: your sponsored ads drive sessions to your product detail page. The quality of your listing determines what percentage of those sessions convert. Your conversion rate from those ad-driven sessions influences your organic keyword ranking for those search terms. Better organic ranking brings more organic sessions. More organic sessions at a high conversion rate produce more organic sales velocity, which further lifts your ranking. This is the flywheel.
Using PPC Data to Diagnose Listing Problems
Your advertising reports contain diagnostic signals that most sellers never read for listing insights. They read them for bid optimization and keyword expansion. But there is much more information in there.
If your sponsored product ads have a strong click-through rate (CTR above 0.35%) but a low conversion rate (below 6%), the problem is not your targeting or your main image. The problem is your listing page. Shoppers find the product relevant enough to click, but the detail page fails to close the sale. That is a listing quality problem, not an advertising problem.
If your CTR is low (below 0.20%) but your conversion rate for sessions that do reach the page is strong (above 12%), your main image or title is filtering out shoppers prematurely. You are losing the funnel before people even visit the page.
Each of these diagnostic patterns suggests a different intervention, and knowing the difference saves you significant testing time and ad spend.
Keyword Intent Segmentation for Higher-Quality Traffic
When your campaigns are structured to attract high-intent buyers, you improve upon this already strong baseline. A higher conversion rate directly lowers your ACoS and increases overall profitability.
Not all keywords drive equal-quality traffic. A shopper searching for your exact product name converts at a dramatically higher rate than a shopper searching a broad category term. Structuring your campaigns to separate exact match, phrase match, and broad match traffic into distinct ad groups allows you to analyze conversion rates by keyword specificity and adjust bids accordingly.
High-intent, high-converting keywords deserve higher bids because each click has a higher probability of generating a sale. Low-intent, low-converting keywords might still be worth running for discovery and data gathering, but they should not receive the same investment per click.
Negative keyword management is the other side of this coin. Aggressively adding negative keywords for irrelevant search terms prevents budget waste and, more importantly, prevents low-intent traffic from diluting your conversion rate metrics. A listing with a strong natural CVR can have that metric pulled down by a flood of irrelevant ad-driven sessions. Clean traffic produces clean data, which produces better optimization decisions.
Mobile-First Optimization and the New Reality of Amazon Shopping
Over 70% of Amazon’s traffic now comes from mobile devices. That means your listing has to be thumb-friendly: scannable, visually engaging, and concise.
This is not a future consideration. It is the current reality, and most Amazon listings are not built with mobile as the primary experience. Sellers design their listings on desktop, upload images at desktop resolution, and write bullet points that look fine in a desktop browser but become walls of text on a phone screen.
What Mobile Shoppers See That Desktop Tests Miss
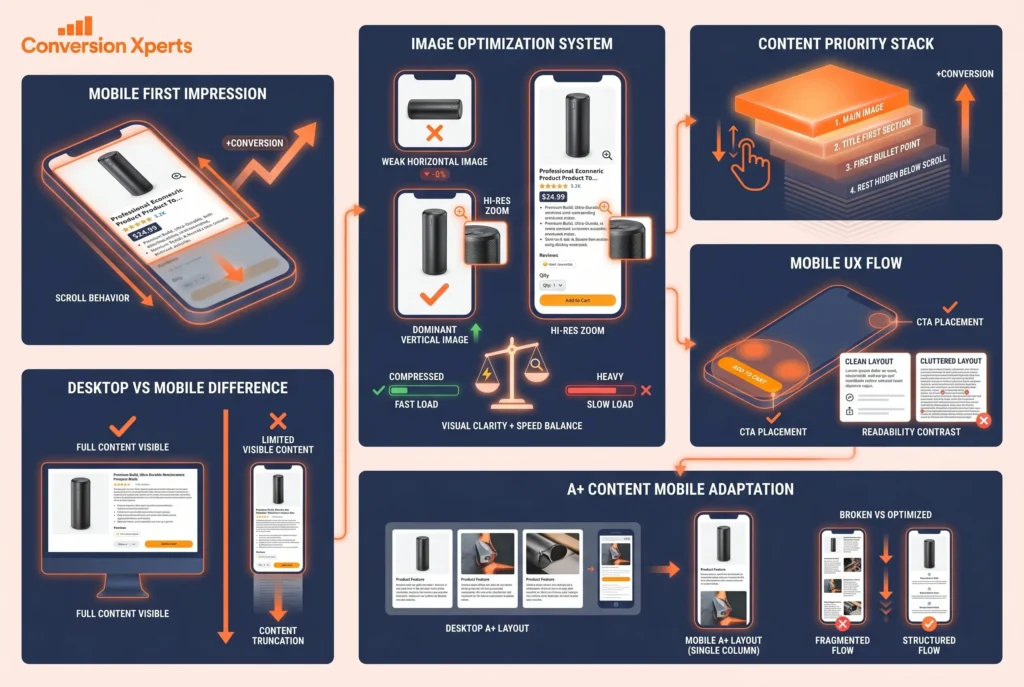
On a mobile device, a shopper sees your main image, your title (truncated to approximately 80 characters), your star rating and review count, your price, and possibly a small preview of your first bullet point. That is the entire first impression. Everything below the fold requires a deliberate scroll.
This means your most persuasive content needs to live in those first few elements. The main image needs to communicate the product at thumbnail scale. The title needs to deliver its most important information within the first 80 characters. The first bullet point needs to address the most common objection or deliver the most compelling benefit.
Vertical images take up more screen space on mobile devices, making them appear larger and more eye-catching. Horizontal images look smaller on mobile, potentially reducing product visibility and CTR.
Testing your listing on an actual mobile device before and after any optimization is non-negotiable. What looks compelling in Seller Central’s desktop preview often looks cluttered or hard to read on a phone.
Mobile Page Speed and Image Optimization
Amazon controls the underlying page speed, but you control the file quality and format of your images. High-resolution images that are also appropriately compressed for fast loading help mobile shoppers who are on slower connections. Amazon’s recommendations call for images at 1500 by 1500 pixels minimum, which provides zoom functionality on desktop while loading efficiently on mobile.
A+ Content on mobile renders in a single-column format rather than the multi-column grid you design in the module editor. Always preview your A+ Content in the mobile view before publishing. Modules that look balanced and professional on desktop can appear fragmented or confusing on mobile if you have not accounted for the column collapse.
A/B Testing on Amazon: How to Run Experiments That Give You Real Answers
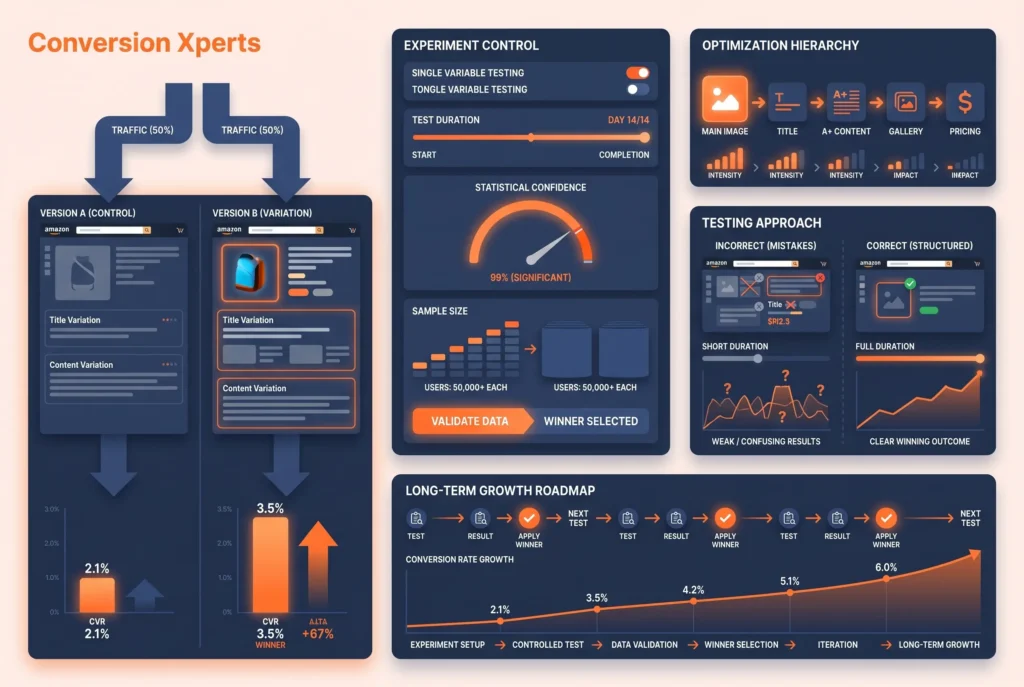
A/B testing is the methodical process of eliminating guesswork. It is a controlled experiment where you compare two or more versions of a single variable, such as a product title, main image, or A+ Content module, to determine which one drives more revenue.
Amazon’s native testing tool, called Manage Your Experiments, is available to brand-registered sellers and allows you to run statistically valid tests on titles, main images, bullet points, and A+ Content simultaneously against your live traffic.
How to Run Manage Your Experiments Correctly
The most common testing mistakes on Amazon are running tests for too short a period, testing multiple variables at once, and drawing conclusions from insufficient sample sizes.
Run tests for at least 4 to 6 weeks to reach statistical significance. Even small improvements can compound into massive sales gains over time.
Manage Your Experiments now supports scheduling and automatic run to significance, which makes iteration fast once you have eligible ASINs. Prioritize the main image first, then title, then A+ Content, then secondary gallery and Brand Story. Read the results the same day they reach significance and roll out winners to all live variants.
The prioritization order matters. Main image impacts both CTR (which determines who visits) and CVR (which determines who buys). It has the broadest potential impact of any single element. Title affects CTR and keyword relevance. A+ Content primarily affects CVR for shoppers who scroll past the bullet points. Test in that order so each experiment builds on clean, uncontaminated data from the previous test.
Building a Testing Roadmap
A structured testing roadmap transforms sporadic experimentation into a systematic program of improvement. ConversionXperts.com builds these roadmaps for clients by auditing current performance, identifying the biggest CVR gaps versus category benchmarks, prioritizing the elements with the highest estimated impact, and scheduling tests in a sequence that allows for clean data interpretation.
A typical 12-month testing roadmap for an actively managed ASIN might include 8 to 12 experiments across image creative, title structure, bullet point framing, A+ module configuration, and pricing structure. Each experiment generates data that informs the next one, and the compounding effect of systematic testing is genuinely dramatic when maintained consistently.
How ConversionXperts.com Builds Data-Driven Amazon CRO Systems
ConversionXperts.com is a specialized Amazon conversion rate optimization agency that works with brands who understand the difference between driving traffic and converting it. The work at ConversionXperts.com is built on a simple philosophy: your listing data tells you exactly what to fix, if you know how to read it.
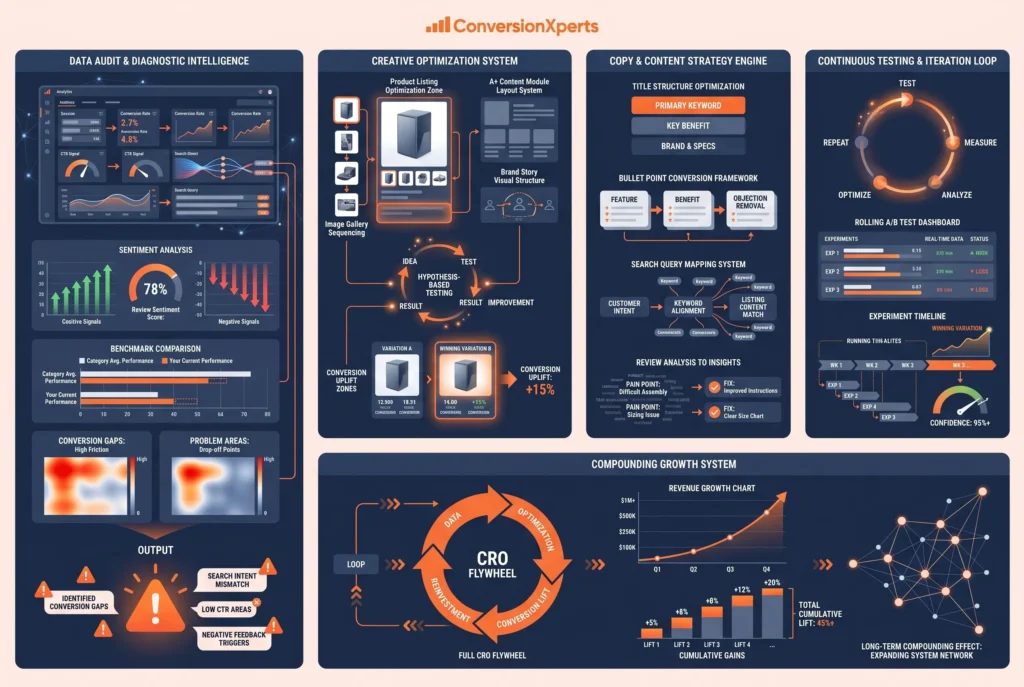
The ConversionXperts.com methodology begins with a comprehensive conversion audit that goes far beyond surface-level listing review. The audit pulls session data, Unit Session Percentage trends, click-through rates from ad campaigns, search query performance reports, customer review analysis (including sentiment mapping of both positive and negative reviews), and category benchmark comparisons. This data portrait tells a precise story about where conversions are being lost and why.
The ConversionXperts.com CRO Framework
The ConversionXperts.com framework operates across four interconnected pillars:
The first pillar is Diagnostic Intelligence. Before any optimization work begins, ConversionXperts.com builds a complete performance baseline using Brand Analytics data, Business Reports, Search Query Performance reports, and competitive benchmarking. This diagnostic phase typically surfaces 5 to 8 specific, high-priority conversion gaps that represent the largest revenue opportunity.
The second pillar is Creative Optimization. This covers the full visual stack of your listing, including main image testing, secondary gallery sequencing, A+ Content design and module selection, Brand Story development, and video content strategy. Creative work at ConversionXperts.com is always hypothesis-driven. Each creative decision is tied to a specific shopper behavior or objection identified in the diagnostic phase.
The third pillar is Copy and Content Strategy. Title structures, bullet point frameworks, A+ copy, and product description language are all refined based on actual search query data, review analysis, and competitive gap assessment. ConversionXperts.com does not write generic “benefit-led copy.” Every word is chosen based on what real shoppers in your category are searching for and what questions they consistently ask before purchasing.
The fourth pillar is Continuous Testing and Iteration. The ConversionXperts.com team runs Manage Your Experiments tests on a rolling basis, builds external testing frameworks for elements that Amazon’s native tool does not cover, and reviews performance data weekly to identify emerging opportunities or emerging problems before they significantly impact revenue.
Brands that work with ConversionXperts.com typically see measurable CVR improvements within the first 60 to 90 days, with the most significant compounding gains accumulating over the first 6 to 12 months as testing data accumulates and the optimization flywheel builds momentum.
To learn more about how ConversionXperts.com works with Amazon brands, visit conversionxperts.com.