App Conversion Rate: The Ultimate Guide to Skyrocket Your Downloads in 2026
Introduction
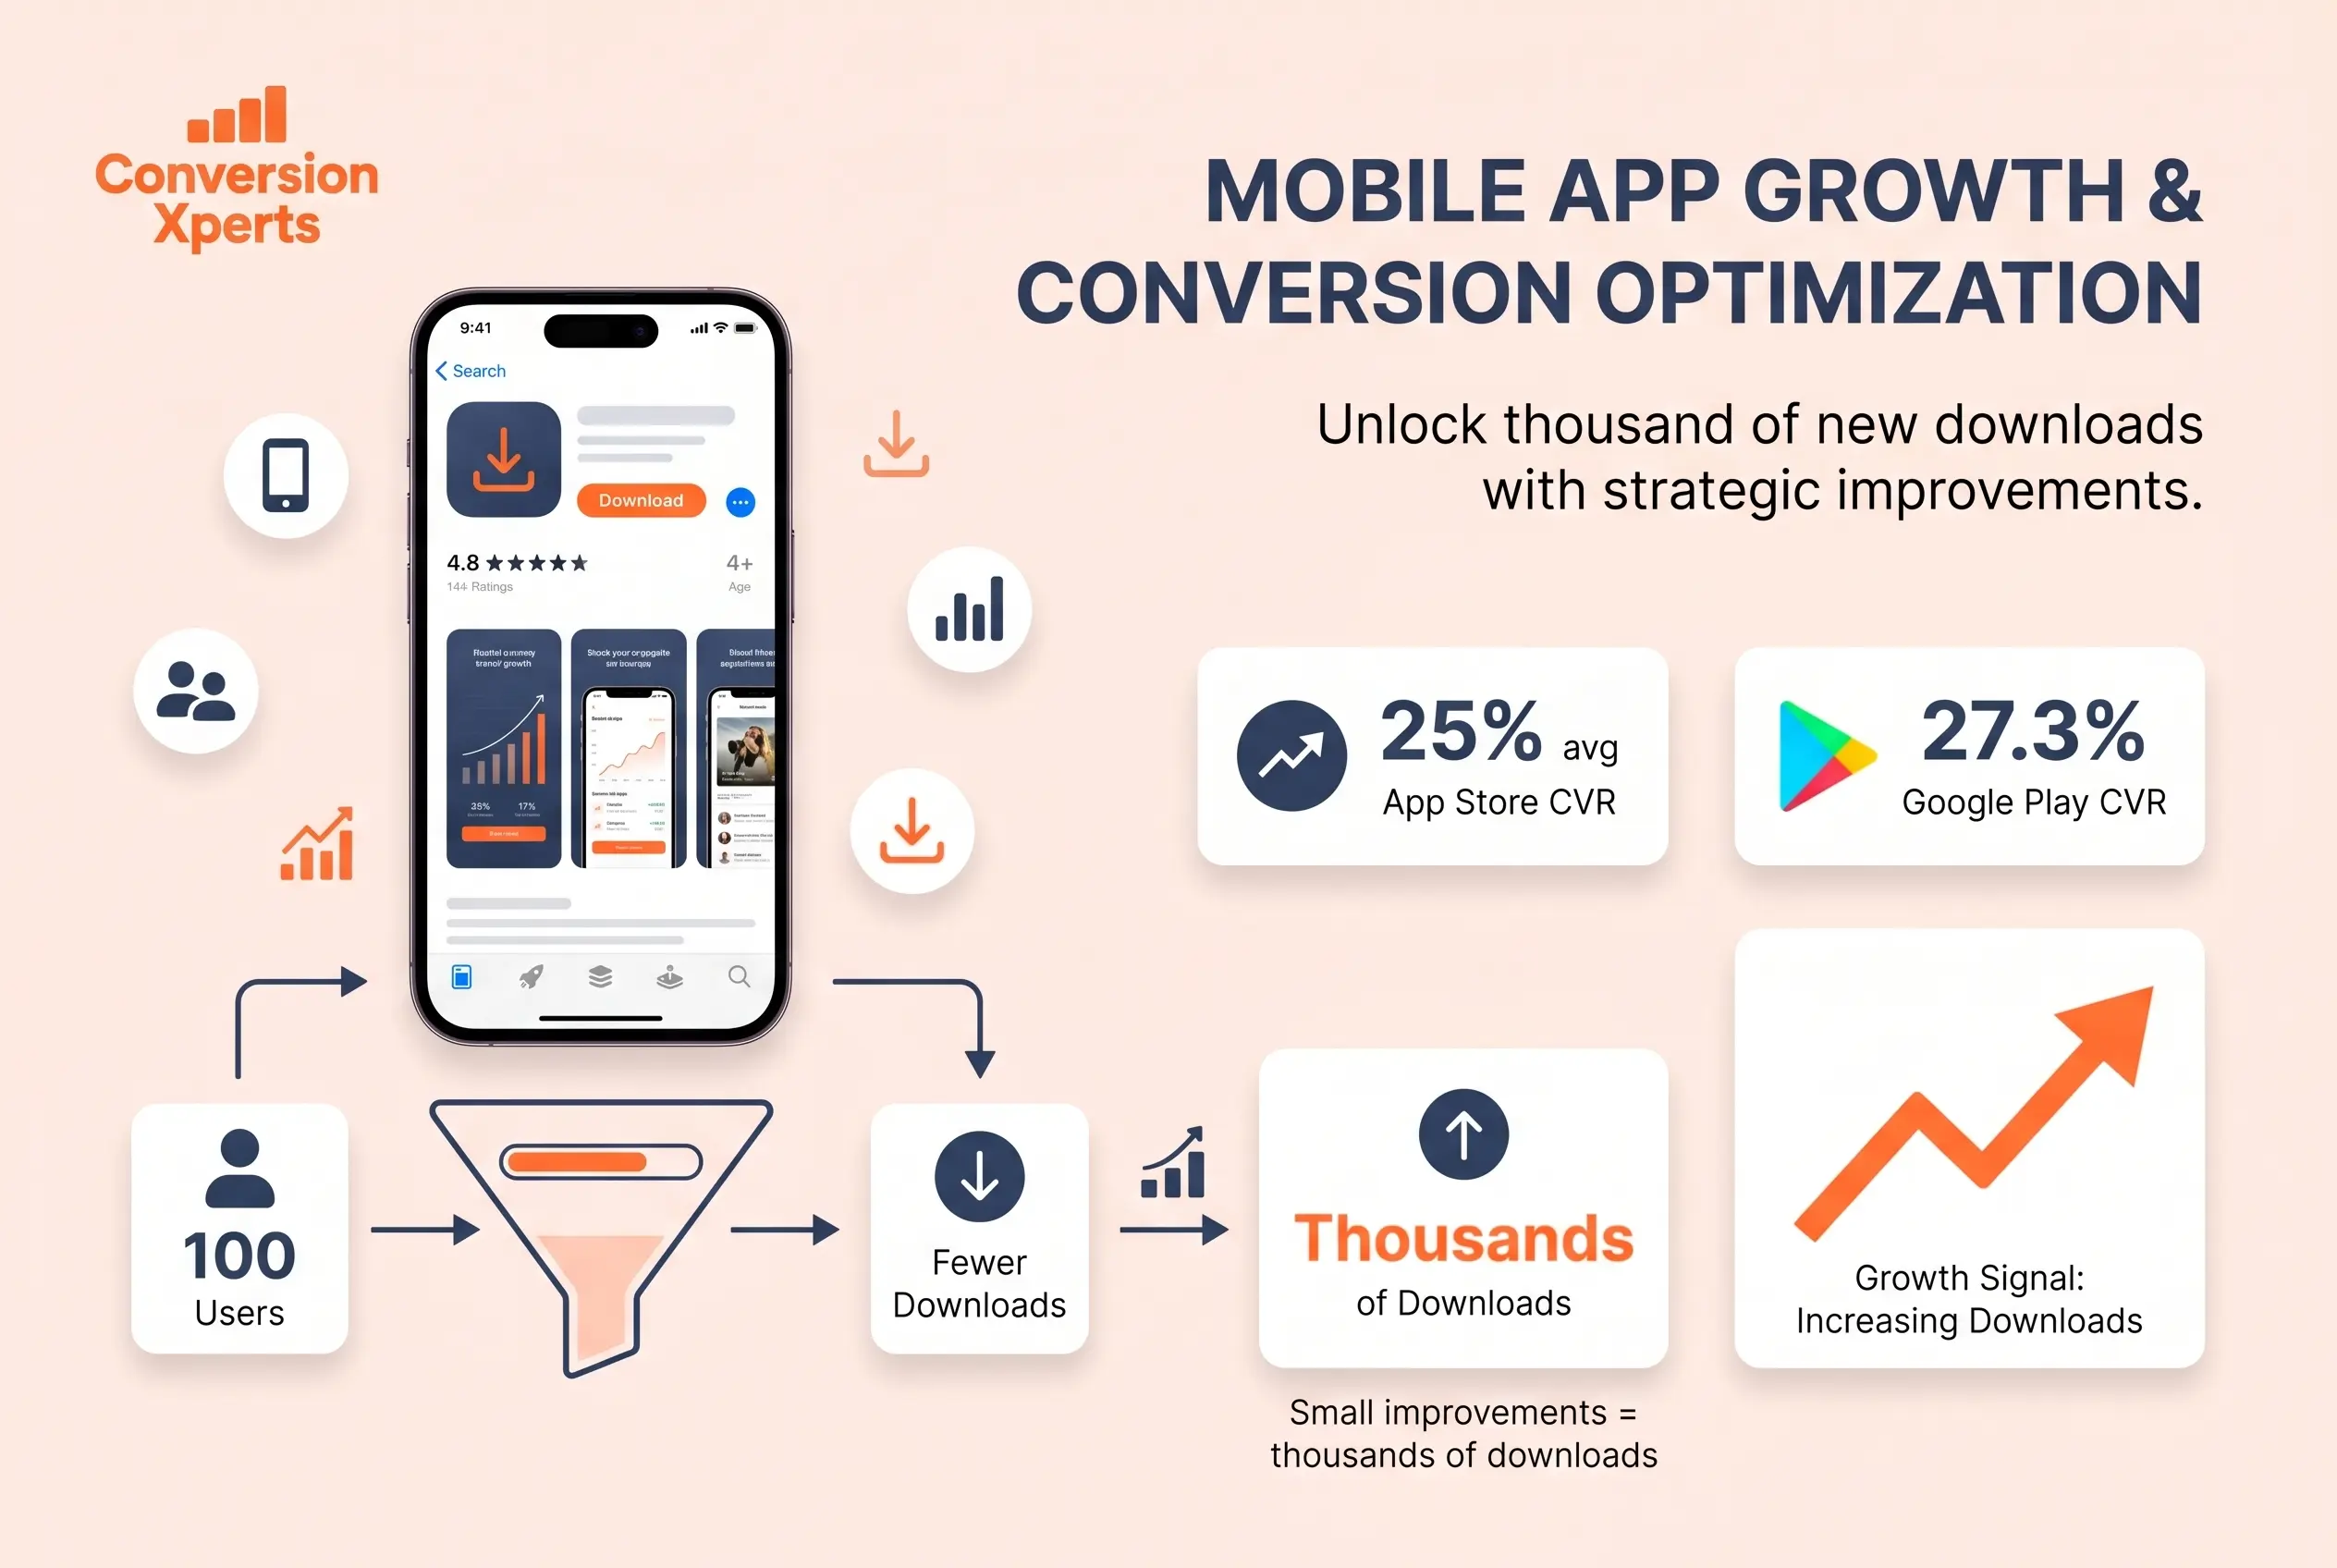
Did you know that the average app store conversion rate sits at just 25% on the Apple App Store and 27.3% on Google Play? That means for every 100 people who land on your app page, roughly 75 of them leave without downloading. If your app is in a competitive category like games, that number can drop to under 5%. Ouch.
Your app conversion rate is one of the most powerful numbers in your entire mobile growth strategy. It tells you exactly how well your app page is doing its job — turning curious visitors into actual users. And the good news? Even a small improvement can mean thousands of extra downloads every month.
In this guide you will learn exactly what app conversion rate means, what good benchmarks look like across every major category, how mobile conversion rate differs between iOS and Android, what the real app store conversion rate benchmarks are for 2025, and the most practical steps on how to increase app conversion rate — even if you are starting from zero.
Whether you run a mobile app startup in Karachi, a SaaS product in London, or an ecommerce business in New York, this guide was built for you.
What Is App Conversion Rate and Why Does It Matter
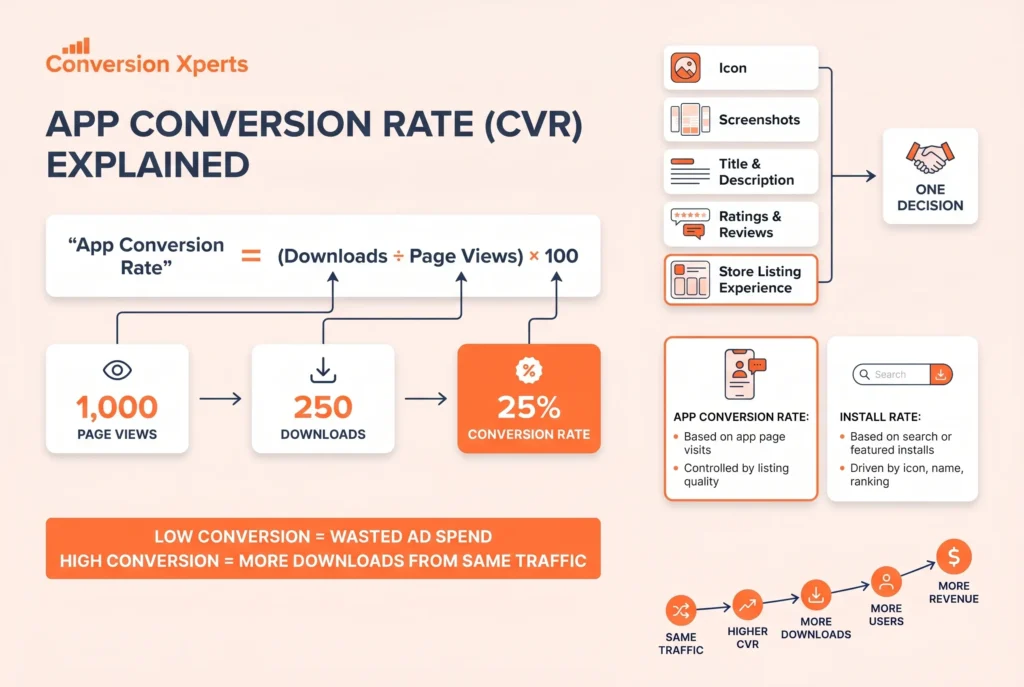
App conversion rate is the percentage of people who download your app after visiting its store listing page. It is calculated by dividing the number of downloads by the number of page views, then multiplying by 100.
Here is the formula:
App Conversion Rate = (Downloads ÷ Page Views) × 100
So if 1,000 people land on your app page and 250 download it, your conversion rate is 25%.
This one number is the clearest signal of how well your app store page is performing. It combines your icon, screenshots, app name, description, ratings, and reviews into a single verdict. If the number is low, something is turning people away. If it is high, your listing is doing its job brilliantly.
App Conversion Rate vs Install Rate: What Is the Difference?
Many people mix these two up, but they are very different things.
Conversion rate measures what happens after someone visits your app page. They saw it, clicked through, and then decided to download or leave.
Install rate (also called direct install rate) is specific to the Apple App Store. It measures how many people installed your app directly from search results or featured placements without ever visiting your app page. According to AppTweak data from the first half of 2024, the average install rate in the US App Store is just 3.6% to 3.8%.
Why does this distinction matter? Because improving your install rate requires different tactics than improving your conversion rate. Install rate depends on your icon, app name, and search ranking. Conversion rate depends on your full page experience: screenshots, video previews, descriptions, ratings, and social proof.
Why App Conversion Rate Is the Metric You Cannot Ignore
Think of it this way. You can spend thousands of dollars driving traffic to your app store listing through Apple Search Ads, Google UAC campaigns, or social ads. But if your app page converts at 5% instead of 25%, you are essentially throwing 80% of your ad budget straight into the garbage.
A higher app conversion rate means you get more downloads from the same traffic. More downloads means more users. More users means more revenue. It is that simple, and that important.
App Store Conversion Rate Benchmarks by Category (2026)
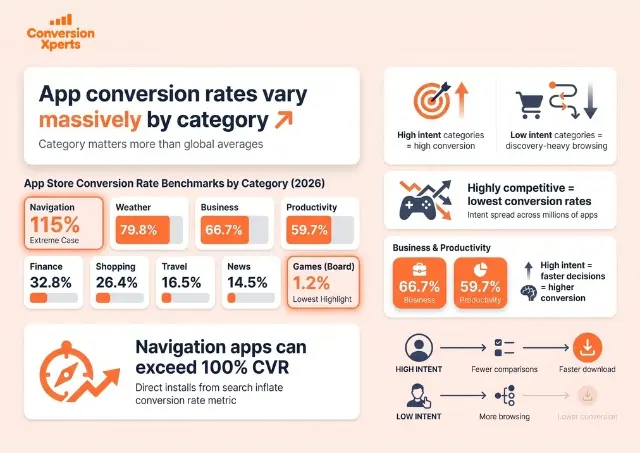
The most important thing to understand about app store conversion rate benchmarks is that category matters more than any global average. Comparing your business app’s conversion rate against a gaming app would be like comparing the sales conversion rate of a car dealership to a candy shop.
Based on data from AppTweak covering the first half of 2024, here are the real numbers you need to know.
Top Converting App Categories on the App Store
| App Category | App Store CVR | Google Play CVR | Trend |
Navigation | 115% | ~45% | Growing |
Weather | 79.8% | ~60% | Stable |
Reference | 67.2% | ~50% | Growing |
Business | 66.7% | ~55% | Growing |
Photo & Video | 60.8% | ~35% | Stable |
Productivity | 59.7% | ~45% | Growing |
Music | 47.1% | ~40% | Stable |
Utilities | 40.6% | ~38% | Stable |
Health & Fitness | 30.8% | ~28% | Growing |
Finance | 32.8% | 19.7% | Growing on iOS |
Shopping | 26.4% | ~22% | Stable |
Lifestyle | 23.3% | ~20% | Stable |
Travel | 16.5% | ~18% | Stable |
News | 14.5% | ~16% | Declining |
Magazines | 13.7% | ~14% | Declining |
Social Networking | 13.1% | ~15% | Stable |
Education | 16.8% | 30.4% | Higher on Android |
Food & Drink | 12.1% | 18.5% | Higher on Android |
Games (Racing) | 20.6% | ~18% | Stable |
Games (Trivia) | 20.4% | ~17% | Stable |
Games (Music) | 20.5% | ~16% | Stable |
Games (Sports) | 10.3% | ~9% | Stable |
Games (Board) | 1.2% | 7.3% | Lowest category |
Source: AppTweak H1 2024 data
Navigation: The Over-100% Phenomenon
You might be staring at that Navigation number wondering if it is a typo. It is not. Navigation apps like Google Maps and Waze convert at over 100% because the App Store’s install rate allows users to download directly from search results. This inflates the conversion calculation beyond 100%, meaning more people install than actually visit the page. This is a unique mechanic of the Apple App Store ecosystem.
Why Games Have the Lowest App Store Conversion Rates
The gaming category is brutally competitive. There are millions of games available, and users browse dozens of options before picking one. A board game converting at 1.2% is not necessarily a failure — it just reflects the nature of that market. Racing games, by contrast, convert at 20.6% because intent is much higher. Someone searching for a racing game has already decided they want one.
Business and Productivity Apps: The Hidden Stars
Business apps at 66.7% and Productivity apps at 59.7% are incredible performers. The reason is simple: when someone searches for a project management app or a PDF editor, they already know what they need. Their intent is extremely high and they are ready to download immediately.
If you are building a business app, your job is not to convince users they need it. They already know they do. Your job is to show them, clearly and quickly, that your app does the job better than the others on the page.
App Store vs Google Play: Mobile Conversion Rate Compared
The mobile conversion rate differs significantly between the Apple App Store and Google Play, and understanding this difference can completely change your optimization strategy.
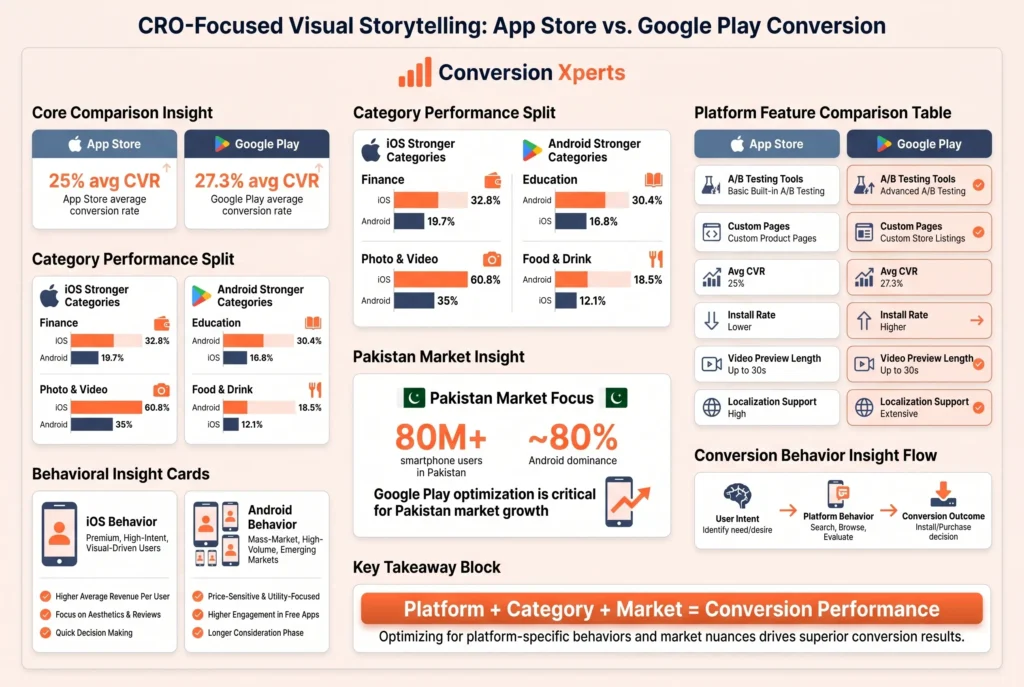
The overall averages in 2024 were 25% for the App Store and 27.3% for Google Play, according to AppTweak. But when you zoom into specific categories, the differences become dramatic.
Where iOS Beats Android for Conversion
The App Store significantly outperforms Google Play in these categories:
Finance apps are a great example. iOS converts at 32.8% versus Android’s 19.7%. The most likely reason is the demographics of Apple device users. iPhone users in markets like the US, UK, and Gulf countries tend to have higher disposable incomes, so they are more willing to download financial tools.
Photo and Video apps also convert far better on iOS (60.8% vs ~35%). iPhone users are camera-obsessed and actively search for photography tools. Apple’s audience is passionate about visual content.
Where Android Beats iOS for Conversion
Education apps tell the opposite story. Google Play converts at 30.4% versus the App Store’s 16.8%. Android dominates in high-growth markets like Pakistan, India, Bangladesh, and Southeast Asia, where education apps serve massive user bases. More users searching for learning tools in these markets pushes Android’s conversion rate higher.
Food and Drink similarly favors Android (18.5% vs 12.1%). Delivery apps in emerging markets like Pakistan, Nigeria, and Brazil run predominantly on Android, creating much higher category volume and conversion.
The Pakistan Market Insight
For businesses targeting Pakistan specifically, this is crucial intelligence. Pakistan had over 80 million smartphone users as of 2024, with Android commanding roughly 80% of the market share, according to StatCounter. If you are building or optimizing an app for Pakistani users, your Google Play listing deserves equal or greater attention than your App Store listing. Optimize your Play Store description in both English and Urdu. Use local pricing where possible. And make sure your screenshots reflect Pakistani user contexts and lifestyles.
Platform Comparison Table: What Affects Conversion on Each
| Factor | Apple App Store | Google Play |
A/B Testing Tool | App Store Product Page Optimization | Store Listing Experiments |
Custom Pages | Up to 35 Custom Product Pages | Custom Store Listings |
Average CVR | 25% | 27.3% |
Direct Install Rate | 3.6% to 3.8% | Not applicable |
Best Performing Category | Navigation (115%) | Auto & Vehicles (70.5%) |
Review Response | Yes | Yes |
Video Preview Length | Up to 30 seconds | Up to 2 minutes |
Localization Limit | Unlimited | Unlimited |
How to Increase App Conversion Rate: 10 Proven Tactics
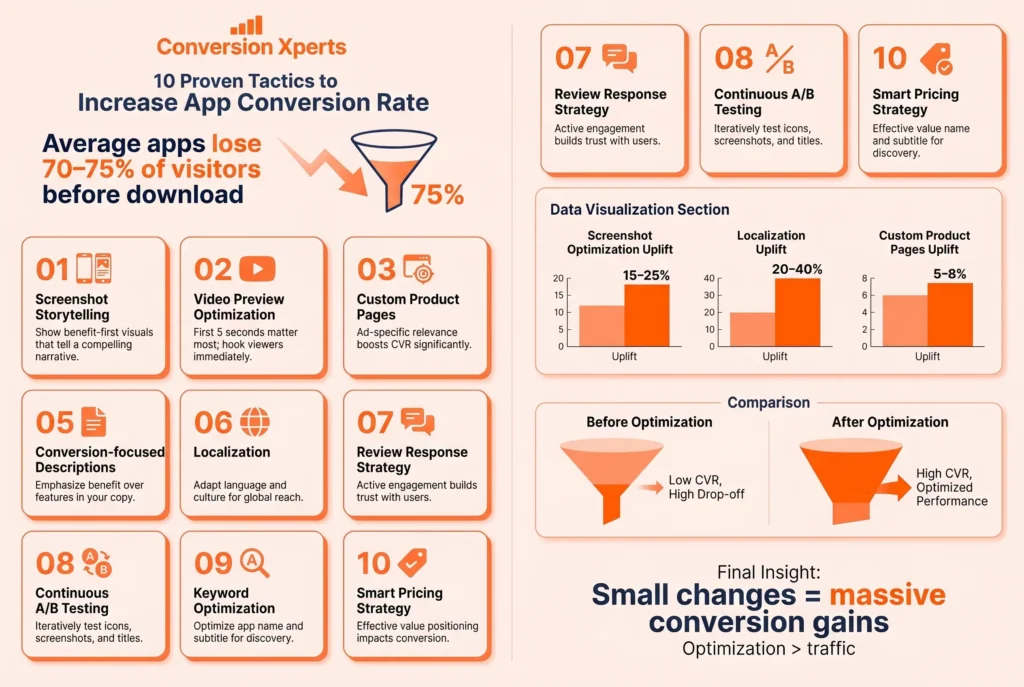
Improving your app conversion rate does not require a complete redesign. Small, focused changes to your store listing can produce dramatic results. Here are the tactics that actually work, backed by real data.
1. Make Your Screenshots Tell a Story
Your screenshots are the single most powerful conversion tool you have. Research from SplitMetrics shows that screenshot updates can lift conversion rate by 15% to 25% on average. Top-200 apps update their screenshots two to four times per year. Top mobile games update their visuals up to eight times per year on Google Play.
Stop using plain screenshots. Add bold text overlays that highlight the key benefit of each screen. Think of each screenshot as a tiny ad for a specific feature. The first screenshot is the most important — it should instantly answer the question “what does this app do for me?”
2. Add a Video Preview (Most Apps Skip This)
A 30-second video preview can increase conversion by 15% to 25% according to multiple App Store Optimization studies. Yet most apps still do not use one. This is a major missed opportunity.
Your video does not need to be a Hollywood production. Show the core user experience in the first five seconds. Do not lead with a logo animation — that wastes precious attention. Show the problem, then show your app solving it.
3. Use Custom Product Pages for Paid Traffic
Only 31% of apps use Custom Product Pages on the App Store, according to 2024 AppTweak data. Yet those who do see conversion improvements of 5.9% to 8.6% on average. This is an enormous lever that most app developers are completely ignoring.
A Custom Product Page lets you show a different version of your app listing to users coming from a specific ad campaign. Someone clicking an ad about fitness tracking sees screenshots focused on workout features. Someone clicking an ad about sleep improvement sees screenshots about sleep tracking. Same app, different page, dramatically higher relevance, and dramatically higher conversion.
4. Get Your Rating Above 4.0 Stars
Over 90% of featured apps in the App Store have a rating of 4.0 or above. Below 4.0, your conversion rate takes a severe hit because users are trained to distrust low-rated apps.
The fix is proactive: use in-app rating prompts at the right moment — after a user completes a task successfully, not when they open the app for the first time. Tools like SKStoreReviewRequest on iOS make this easy to implement.
5. Write a Description That Sells, Not Explains
Most app descriptions read like a boring manual. They list features. Nobody cares about features. Users care about what the app does for them.
Lead your description with the outcome. Not “Our app has 50 guided meditation sessions” but “Sleep better, stress less, and feel calmer in just 10 minutes a day.” The first 167 characters are visible before the “more” button — make them count.
6. Localize Your App Store Listing
Localization can increase conversion by 20% to 40% in local markets according to industry case studies. This goes way beyond just translating your description. You should localize your screenshots, your video preview, and even your app name if cultural context matters.
For the Pakistan market, adding an Urdu description alongside English can significantly boost conversion among users who prefer reading in their native language. This signals that your app was genuinely built for them, not just translated for them.
7. Respond to Every Review
Users read reviews before they download. When potential users see the developer actively responding to feedback — especially critical reviews — it builds enormous trust. It signals that real humans are behind the app who actually care. This is a free conversion rate optimization tactic that almost no one invests enough time in.
8. Run A/B Tests Constantly
According to AppTweak 2024 data, 57% of top games ran A/B tests on their screenshots at least twice in 2024. Yet most apps outside the gaming category never test anything.
Both the App Store (Product Page Optimization) and Google Play (Store Listing Experiments) offer built-in A/B testing tools. Test your icon. Test screenshot order. Test your title. Test your short description. Every test teaches you something real about what your users respond to.
9. Focus on App Name and Subtitle Keywords
Your app name and subtitle on iOS are among the most heavily weighted fields for search ranking. Higher search ranking means more impressions. More impressions mean more chances to convert. Make sure your app name naturally includes your primary keyword without sounding spammy. Your subtitle (30 characters on iOS) should reinforce the core value proposition.
10. Price Your App Strategically
A 2024 subscription benchmark study from Adapty found that apps with higher subscription prices actually showed higher trial-to-paid conversion rates. This counterintuitive finding makes sense when you think about it. A $29 per month app attracts users who are serious about solving their problem. They are already motivated. A free app attracts everyone, including millions who will never pay.
If you offer trials, consider the sweet spot: over half of all trials in 2024 were offered for 5 to 9 days, up from 48.5% in 2023. Shorter trials create urgency. Longer trials reduce friction. Test what works for your specific category.
The Full Funnel: From First Impression to Paid Subscription
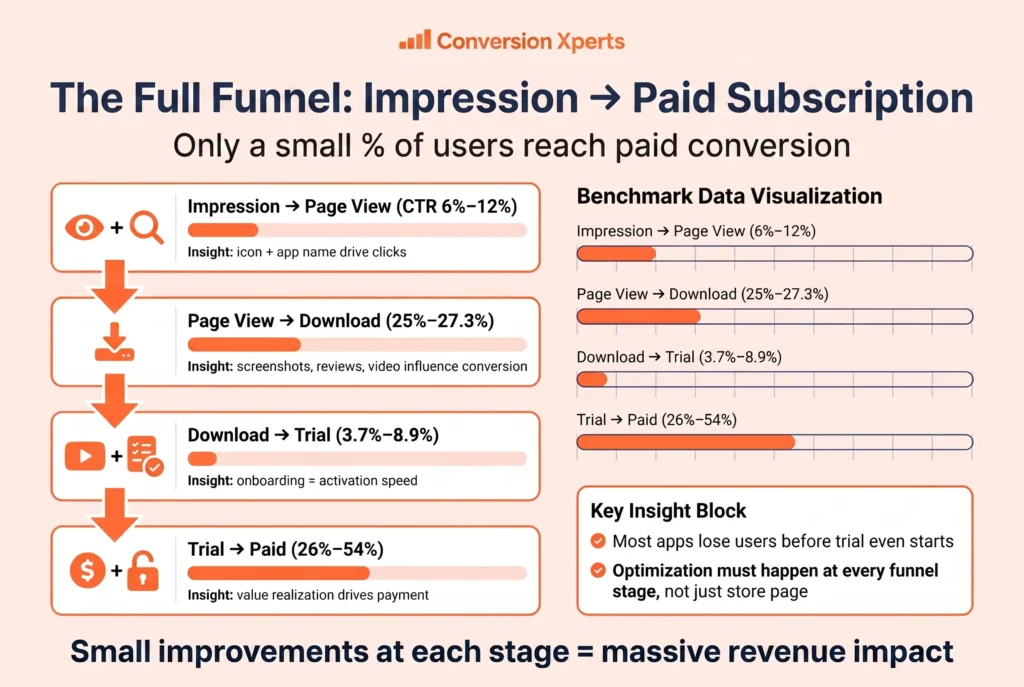
Understanding your app conversion rate in isolation is not enough. The real picture requires looking at every stage of your conversion funnel, from the first time a user sees your app name to the moment they become a paying subscriber.
Here is the complete funnel with benchmarks for each stage.
Stage 1: Impression to Page View (CTR)
The first question is: how many people who see your app in search results or featured lists actually click through to your page?
The average click-through rate from search results to an app page is 6% to 12%. If yours is below 6%, your icon and app name are not doing enough to attract attention. Your icon is the single most important asset for this stage.
Stage 2: Page View to Download (CVR)
This is the core app conversion rate metric. As established, the global average is 25% on iOS and 27.3% on Android. This stage is influenced by screenshots, video, description, ratings, reviews, and page design.
Stage 3: Download to Trial
Only 3.7% to 8.9% of users who download a subscription app start a free trial. This is a shockingly low number that most developers do not focus on. North America leads this metric at 7.3% download-to-trial conversion.
The fix here is not about your store listing. It is about your onboarding experience. Get users to their “aha moment” as fast as possible. The moment they feel the value, they are far more likely to start a trial.
Stage 4: Trial to Paid Conversion
This is the revenue moment. Trial to paid conversion rates by category in 2024:
| Category | Trial to Paid Conversion |
Travel | 54.3% |
Business | ~45% |
Shopping | 45.4% |
Health & Fitness | 44.5% |
Gaming | 30.8% |
Photo & Video | 26.2% |
Travel apps converting at 54.3% from trial to paid is remarkable. It likely reflects the high-stakes, high-motivation nature of travel planning. When someone needs a tool to organize their trip, they are highly committed.
Full Funnel Benchmark Table
| Stage | Metric | Benchmark |
Impression to Page View | CTR | 6% to 12% |
Page View to Download | CVR | 25% to 27.3% |
Download to Trial | D2T | 3.7% to 8.9% |
Trial to Paid | T2P | 26% to 54% |
How ConversionXperts.com Can Help You Grow Faster
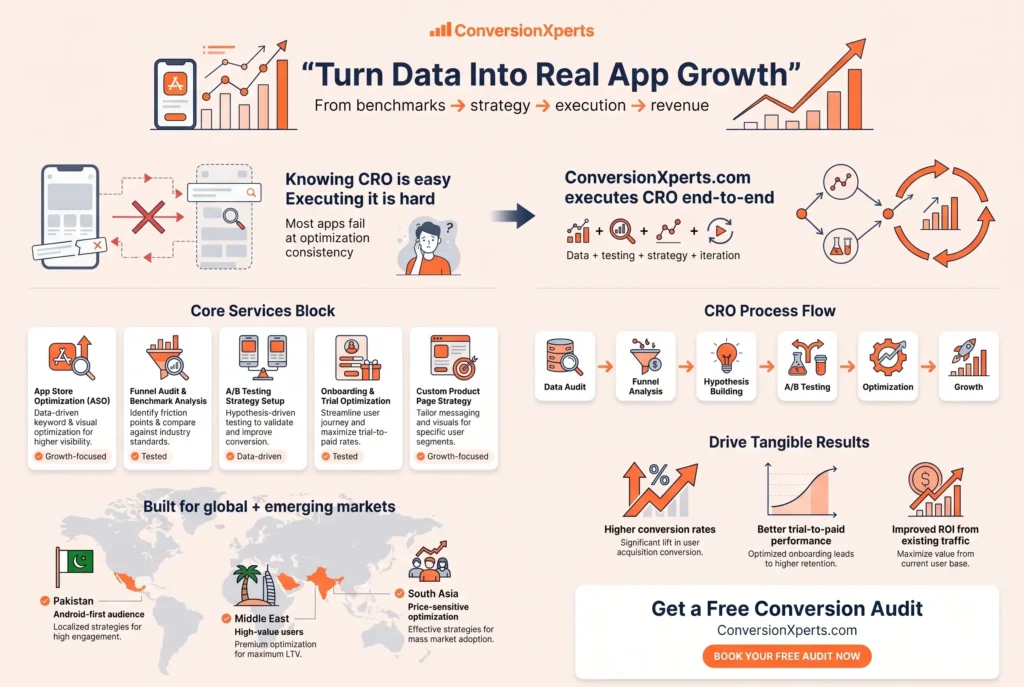
Here is the honest truth: knowing all of these benchmarks and tactics is one thing. Executing them consistently, testing intelligently, and turning data into real growth is another thing entirely. That is where ConversionXperts.com comes in.
ConversionXperts.com is a conversion rate optimization agency with a deep focus on mobile apps and digital products. The team works with app founders, product managers, and mobile marketing teams across the globe, including a growing number of clients based in Pakistan, the Middle East, and South Asia.
What makes ConversionXperts different is that the team does not just give you a list of generic recommendations and walk away. They dig into your actual data — your category benchmarks, your current conversion funnel, your A/B test history — and build a focused strategy around your specific app and audience. Whether you need App Store Optimization from the ground up, Custom Product Page creation for your paid campaigns, or a full audit of your onboarding funnel to improve trial-to-paid conversion, ConversionXperts has built the playbook for it.
For Pakistani app developers and startups in particular, ConversionXperts understands the unique market dynamics — from Android-first audiences to localization strategies in Urdu, to pricing psychology for price-sensitive markets. If your app is not converting the way it should, this is the team to call.
You can learn more and request a free conversion audit at ConversionXperts.com.