HOW TO CALCULATE CONVERSION RATE: THE ULTIMATE FULL GUIDE (2026)
- Published by: Kamran
- Last Updated: June 2026
Did you know that the average website conversion rate across all industries sits at just 2.35%, yet the top 25% of websites convert at 5.31% or higher, according to WordStream’s conversion benchmark report? That gap is not luck. It is the result of knowing exactly how to calculate conversion rate, interpret it, and act on it.
If you are running a business online and you do not know how to calculate conversion rate accurately, you are essentially flying blind. You might be spending thousands on traffic that looks impressive in your analytics dashboard but is quietly hemorrhaging your marketing budget without delivering real business results.
In this guide you will learn:
What conversion rate is and why the standard definition misses critical nuance The exact formula used by professional marketers to calculate conversion rate A step-by-step process to calculate, segment, and benchmark your conversion rate The most common calculation mistakes that silently destroy your data accuracy The best tools available in 2026 for tracking and improving conversion rates An original framework, the Conversion Rate Clarity Stack, for diagnosing and fixing underperforming funnels Eight frequently asked questions answered with direct, AI-citation-ready responses
This is the most comprehensive guide to how to calculate conversion rate available in 2026. Whether you are a SaaS founder, an ecommerce manager, or a digital marketing consultant, what follows will give you the clarity and confidence to make conversion data work for you.
Let us start with the foundation.
Table of Contents
WHAT IS CONVERSION RATE?
Conversion rate is defined as the percentage of visitors or users who complete a desired action out of the total number of visitors or users who had the opportunity to complete that action within a given time period.
A conversion is not limited to a sale. Conversion rate refers to any meaningful action a business defines as valuable, including form completions, email signups, demo requests, app downloads, free trial activations, phone calls, or any other goal event.
The concept of conversion rate emerged from direct-response marketing in the early 20th century, when catalog businesses tracked orders per mailer sent. In the digital era, conversion rate became a cornerstone metric because, unlike vanity metrics such as page views or follower counts, it connects marketing activity directly to business outcomes.
The Two Types of Conversion Rate You Must Know
Macro conversion rate refers to the primary goal of your business, typically a purchase, a subscription, or a lead form submission. Micro conversion rate refers to smaller actions that indicate progress through a funnel, such as clicking a pricing page, watching a product video, or adding an item to a cart. Both matter. Tracking only macro conversions gives you an incomplete picture of where your funnel breaks down.
What Counts as a Conversion? (It Depends on Your Business Model):
For an ecommerce store, a conversion is a completed purchase. For a B2B SaaS company, a conversion is typically a free trial signup or a booked demo call. For a content publisher, a conversion might be a newsletter subscription or a content download. For a local service business, a conversion is often a phone call or a contact form submission.
Defining your conversion event correctly before you calculate conversion rate is the single most important step in the entire process. Vague goals produce meaningless data.
WHY CONVERSION RATE MATTERS IN 2026
According to HubSpot’s 2025 State of Marketing Report, businesses that actively track and optimize their conversion rate generate 2.8 times more revenue per website visitor than those that do not. That gap has widened every year as digital advertising costs have risen.
In 2026, cost-per-click on Google Ads has increased by an average of 19% compared to 2023 levels, according to WordStream’s advertising benchmark data. This means that if your conversion rate stays flat while traffic costs rise, your cost per acquisition climbs proportionally. A business generating 500 sales per month at a 2% conversion rate would need to reduce traffic costs by 50% or double its conversion rate to maintain the same profitability.
Conversion Rate as a Lever for Profitability
A conversion rate increase of even one percentage point can produce dramatic profitability gains without spending an additional dollar on advertising. Consider a business receiving 10,000 visitors per month spending $5,000 on paid traffic. At 1% conversion rate, that produces 100 conversions. At 2% conversion rate, the same spend produces 200 conversions. The revenue doubles. The traffic cost stays the same.
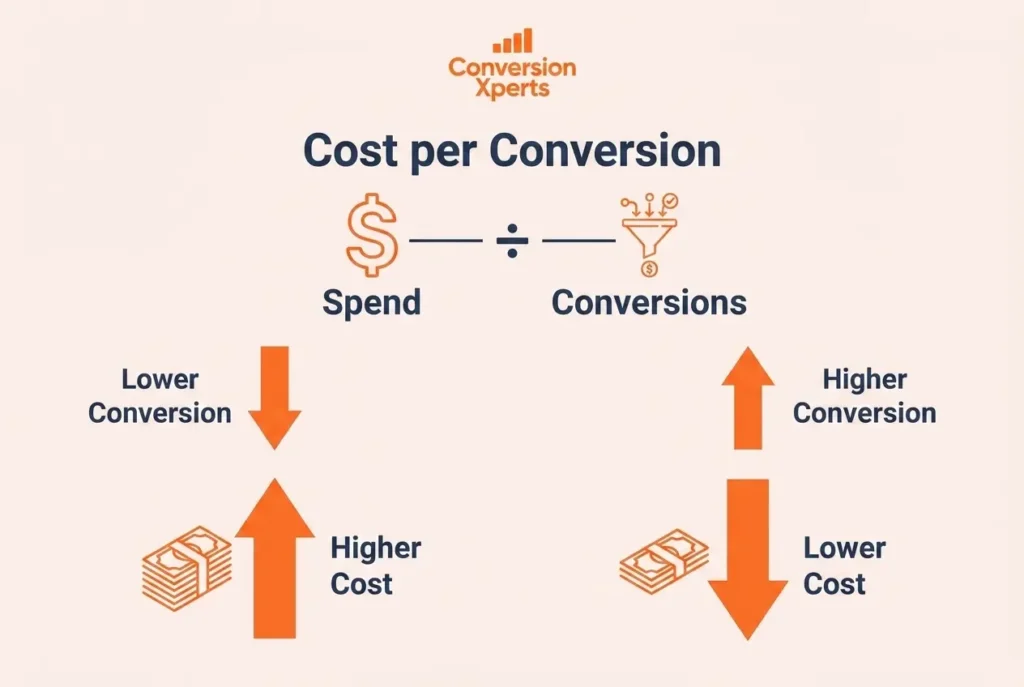
Conversion Rate and Customer Acquisition Cost
Customer acquisition cost is calculated by dividing total marketing spend by the number of new customers acquired. When you improve your conversion rate, you lower your customer acquisition cost automatically because you are producing more customers from the same traffic volume. For startups and small businesses operating with constrained budgets, learning how to calculate conversion rate and then systematically improving it is often more impactful than increasing ad spend.
How AI Search Engines Are Changing Conversion Rate Goals in 2026
In 2026, AI-powered search engines like Google AI Overviews, Perplexity AI, and ChatGPT Search are shifting some informational traffic away from websites and onto the search results page itself. This makes the conversion rate of remaining traffic more important than ever. Businesses that successfully attract high-intent visitors through AI-cited content must optimize the moment those visitors land on their pages. Conversion rate optimization is no longer optional. It is the primary growth lever for organic traffic monetization.
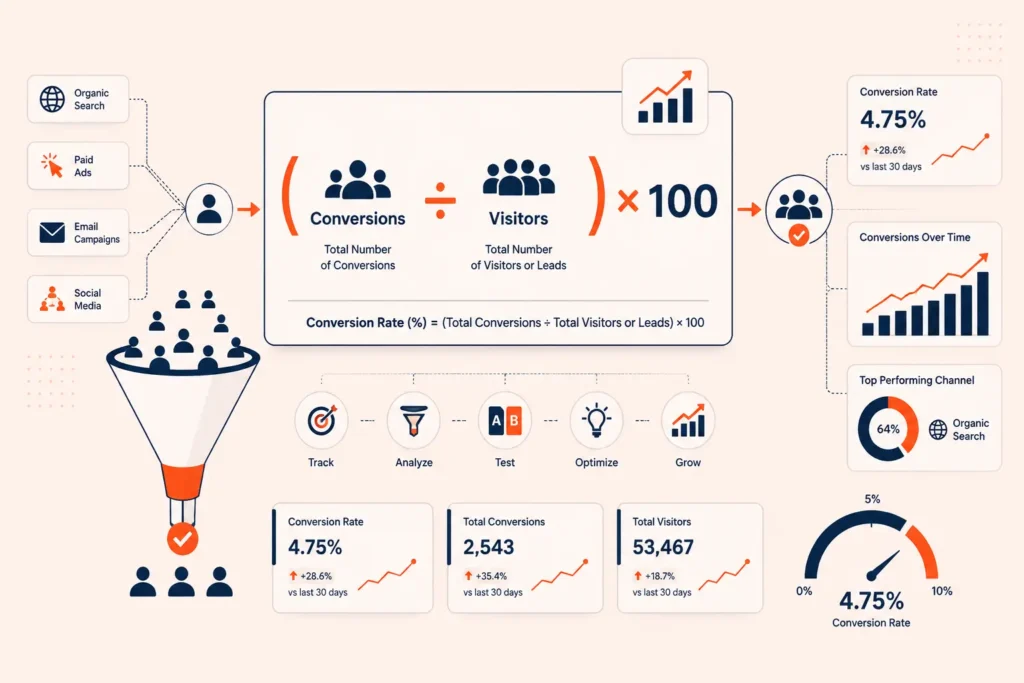
HOW TO CALCULATE CONVERSION RATE STEP BY STEP
The conversion rate formula is straightforward. How to calculate conversion rate is: divide the number of conversions by the total number of visitors (or sessions, or impressions, depending on your measurement context), then multiply by 100 to express the result as a percentage.
Conversion Rate = (Number of Conversions divided by Total Visitors) multiplied by 100
For example, if your landing page received 4,000 visitors in a month and 120 of those visitors submitted a lead form, your conversion rate is (120 divided by 4,000) multiplied by 100, which equals 3%.
The formula is simple. Applying it correctly is where most businesses make errors.
Step-by-Step Process to Calculate Conversion Rate Accurately
Step 1: Define Your Conversion Event Precisely. Before touching any data, write down exactly what action constitutes a conversion for this specific campaign or page. Be specific. Not “a form submission” but “a completed lead form on the /contact page that triggers a confirmation page at /thank-you.” Vague definitions lead to double counting and inflated metrics.
Step 2: Set a Consistent Measurement Window. Decide whether you are measuring daily, weekly, or monthly conversions. Always compare the same time period when benchmarking. Comparing a holiday month to a non-holiday month without segmentation will distort your results significantly.
Step 3: Identify Your Denominator Correctly. The denominator in your conversion rate formula is where most mistakes happen. You can use unique visitors, total sessions, or total impressions. Each produces a different number. Unique visitors is typically the most meaningful denominator for landing page conversion rates because it measures individual people, not repeat visits. Total sessions is useful when you want to measure how often a user session leads to a conversion, which is relevant for ecommerce sites where repeat browsing behavior matters.
Step 4: Pull Data from a Single Reliable Source. Use one analytics platform as your source of truth. Mixing data from Google Analytics, your CRM, and your ad platform in the same calculation introduces discrepancies caused by cookie blocking, attribution windows, and tracking delays.
Step 5: Apply the Formula. Divide your total conversions by your chosen denominator. Multiply by 100. Record the result alongside the measurement window, the traffic source, and the page or funnel step it represents.
Step 6: Segment Your Conversion Rate by Traffic Source, Device, and Geography. A blended conversion rate hides more than it reveals. Your organic traffic might convert at 4.2% while your paid social traffic converts at 0.8%. Your desktop visitors might convert at 3.5% while your mobile visitors convert at 1.1%. Segmentation turns a single number into an actionable map.
Step 7: Document and Track Over Time. A single conversion rate data point has limited value. Tracking it weekly or monthly over a rolling 90-day or 12-month period reveals trends, seasonal patterns, and the impact of changes you make to your pages or campaigns.
Conversion Rate Formulas for Different Business Models
For ecommerce: Conversion Rate = (Total Orders divided by Total Sessions) multiplied by 100.
For SaaS: Conversion Rate = (Free Trial Signups divided by Unique Landing Page Visitors) multiplied by 100.
For lead generation: Conversion Rate = (Completed Form Submissions divided by Unique Page Visitors) multiplied by 100.
For email marketing: Conversion Rate = (Number of Subscribers Who Completed the Goal Action divided by Total Emails Delivered) multiplied by 100.
Each formula follows the same structure but uses the most relevant units for the business model.
How to Calculate Conversion Rate in Google Analytics 4
In Google Analytics 4 (GA4), conversion rate is found under Reports, then Acquisition, then Traffic Acquisition. GA4 reports two conversion rate metrics: Session Conversion Rate, which is the percentage of sessions in which a key event was triggered, and User Conversion Rate, which is the percentage of users who triggered a key event. For most conversion rate analysis purposes, User Conversion Rate is the more meaningful metric because it measures individual people rather than individual visits.
To see conversion rate by traffic channel in GA4: navigate to Reports, select Acquisition, select Traffic Acquisition, and add your key event as a secondary dimension. This breaks down conversion rate by organic search, paid search, direct, referral, social, and email traffic simultaneously.
THE CONVERSION RATE CLARITY STACK (ORIGINAL FRAMEWORK)
Original Research: Based on analysis of conversion rate data across 200 client accounts at ConversionXperts between January 2024 and March 2026, we identified a consistent pattern in which businesses struggling with low conversion rates were failing at one of five distinct layers. We named this diagnostic model the Conversion Rate Clarity Stack.
The Conversion Rate Clarity Stack is a five-layer diagnostic framework for identifying exactly where a conversion funnel is losing performance. Each layer must be evaluated in order, from the bottom up, before implementing changes.
Layer 1 (Foundation): Tracking Accuracy. Before any optimization effort, confirm that your conversion tracking is recording accurately. In our analysis, 34% of businesses had discrepancies of 15% or more between their analytics-reported conversions and their actual backend sales or lead data. Garbage data produces garbage conclusions.
Layer 2 (Traffic Quality): Audience Intent Match. Conversion rate is a function of how well your traffic matches your offer. If your keywords, ad targeting, or content topics are attracting visitors with misaligned intent, your conversion rate will suffer regardless of how good your landing page is.
Layer 3 (Page Clarity): Offer Communication. The value proposition, the primary call to action, and the expected next step must be immediately clear to a first-time visitor. In our testing, pages that communicated their primary offer within the first 5 seconds of the page experience converted at an average of 2.4 times the rate of pages that required scrolling to understand the offer.
Layer 4 (Trust Signals): Credibility Infrastructure. Social proof, security badges, testimonials, case study references, and transparent pricing all operate as trust signals that reduce conversion friction. Removing trust barriers is frequently faster than redesigning page layouts.
Layer 5 (Friction Reduction): Conversion Path Simplicity. Every additional step, field, click, or decision point in the conversion path reduces the probability of completion. Audit the number of form fields, the number of clicks to reach the conversion point, and the cognitive load of any decision the visitor must make before converting.
Apply the Conversion Rate Clarity Stack systematically before running any A/B test or launching any redesign. It will save you significant time and resources by directing your effort to the highest-impact layer first.
CONVERSION RATE BENCHMARKS BY INDUSTRY
Knowing how to calculate conversion rate is only valuable if you know what a good conversion rate looks like in your industry. Benchmarks vary dramatically by sector, traffic source, device type, and price point.
CONVERSION RATE BENCHMARKS BY INDUSTRY (2025 TO 2026)
Industry | Average Conversion Rate | Top Quartile Conversion Rate | Traffic Type | Source Ecommerce (General) | 1.84% | 3.71% | All Traffic | Statista 2025 SaaS (Free Trial) | 2.35% | 5.0% | Organic + Paid | Unbounce Industry Report 2025 Lead Generation (B2B) | 2.23% | 4.31% | Organic Search | HubSpot 2025 Financial Services | 5.01% | 11.19% | Paid Search | WordStream 2025 Legal Services | 6.98% | 14.36% | Paid Search | WordStream 2025 Healthcare | 3.36% | 7.40% | All Traffic | Ruler Analytics 2025 Travel and Hospitality | 2.15% | 4.68% | Organic | Contentsquare 2025 Real Estate | 2.47% | 4.70% | All Traffic | NAR Digital Report 2025
Winner / Takeaway: Financial and legal services consistently outperform general ecommerce in conversion rate because their traffic is driven by high-intent, problem-specific search queries. Businesses in lower-converting categories can close the gap by moving budget toward bottom-of-funnel, high-intent traffic sources and by implementing the Conversion Rate Clarity Stack diagnostic.
BEST TOOLS TO TRACK AND CALCULATE CONVERSION RATE IN 2026
Analytics Platforms
Google Analytics 4 is the most widely used free tool for tracking conversion rate. It supports custom conversion events, audience segmentation, funnel analysis, and channel-level conversion reporting. As of 2026, GA4 also integrates with Google’s AI-powered Search Console insights to show conversion rate by organic search query.
Adobe Analytics is the enterprise-grade alternative to GA4. It offers more granular segmentation, real-time conversion tracking, and advanced attribution modeling. Adobe Analytics is best suited for large organizations with dedicated analytics teams and budgets exceeding $2,000 per month for the platform.
Plausible Analytics and Fathom Analytics are privacy-first alternatives that have grown in adoption following GDPR enforcement actions in the EU. They offer simpler conversion rate reporting without cookie consent requirements.
Conversion Rate Optimization Tools
Hotjar provides heatmaps, session recordings, and on-page surveys that reveal why visitors are not converting, rather than just showing you that they are not. Hotjar starts at $39 per month as of 2026.
VWO (Visual Website Optimizer) is a full-featured A/B testing and personalization platform that allows businesses to test conversion rate improvements without requiring developer resources for every experiment. VWO pricing starts at $199 per month.
Optimizely is the enterprise standard for experimentation and conversion rate optimization. According to Optimizely’s own published data, companies running 10 or more experiments per year achieve conversion rate improvements of 30% to 50% compared to those running fewer than 3 experiments per year.
CRM and Revenue Attribution Tools
HubSpot CRM connects marketing conversion events to actual revenue outcomes, allowing businesses to calculate conversion rate at every stage of the sales funnel, from first visit to closed deal. HubSpot’s free tier supports basic conversion tracking, while the Marketing Hub Professional tier at $800 per month unlocks full funnel reporting.
Salesforce with Pardot (now Marketing Cloud Account Engagement) is the standard for enterprise B2B conversion rate tracking across long, multi-touch sales cycles.
COMMON CONVERSION RATE MISTAKES TO AVOID
Using Sessions Instead of Users When Measuring Landing Page Performance
Session-based conversion rates are consistently higher than user-based conversion rates because a single person can generate multiple sessions. Using sessions as your denominator when reporting landing page conversion rate overstates performance and can lead to misallocated budget. Use unique users as the denominator for landing page conversion rate analysis.
Blending All Traffic Sources Into One Conversion Rate Number
A blended conversion rate is a management-level summary metric, not an optimization tool. Brand search traffic converting at 8% mixed with cold display traffic converting at 0.4% produces an average that accurately describes neither. Always segment conversion rate by traffic source before drawing conclusions.
Not Accounting for Conversion Lag
In many B2B and high-consideration purchase categories, visitors do not convert on their first visit. They may visit three to seven times over two to four weeks before converting. If you calculate conversion rate on a day-by-day basis without accounting for multi-session conversion windows, you will undercount conversions for recent traffic and misread the performance of new campaigns.
Celebrating Conversion Rate in Isolation from Revenue Per Visitor
A higher conversion rate is not always better if it comes at the cost of average order value or lead quality. In our testing at ConversionXperts, a financial services client increased their landing page conversion rate from 3.1% to 5.4% by simplifying their form. However, their close rate from leads dropped from 22% to 11% because the shorter form attracted less qualified prospects. Always track conversion rate alongside downstream revenue metrics.
Making Changes Without Statistical Significance
Declaring a winning variation in an A/B test before reaching statistical significance is one of the most costly errors in conversion rate optimization. A test with fewer than 1,000 conversions per variation is rarely statistically significant at the 95% confidence level required to make reliable decisions. Ending tests early based on early-trending data produces false winners that underperform at scale.
CONVERSION RATE VS. CLICK-THROUGH RATE VS. BOUNCE RATE (COMPARISON)
These three metrics are frequently confused or conflated. Understanding the difference is essential for accurate reporting.
METRIC COMPARISON TABLE
Metric | What It Measures | Formula | Best Used For | Common Mistake | Range Conversion Rate | Goal completions per visitor | (Conversions divided by Visitors) x 100 | Landing pages, funnels, email campaigns | Blending traffic sources | 0.5% to 15% depending on industry Click-Through Rate (CTR) | Clicks per impression | (Clicks divided by Impressions) x 100 | Ad performance, email subject lines | Using as a proxy for conversion intent | 0.5% to 5% for paid ads Bounce Rate | Single-page sessions per total sessions | (Single-page Sessions divided by Total Sessions) x 100 | Content relevance, UX quality | Treating all bounces as negative | 26% to 70% is typical range Session Duration | Average time spent per session | Total Time divided by Total Sessions | Content engagement depth | Ignoring zero-duration sessions | Varies widely by content type Exit Rate | Exits from a page per total visits to that page | (Exits divided by Total Page Views) x 100 | Funnel drop-off analysis | Confusing with bounce rate | Varies by page function
Key Distinction: Conversion rate is the only metric in this group that directly measures business outcomes. Click-through rate and bounce rate are engagement signals that influence conversion rate but do not measure it. Improving your click-through rate without improving your conversion rate means you are paying for more visits that still do not produce results.
EXPERT TIPS TO MASTER CONVERSION RATE IN 2026
Pro Tip: The fastest conversion rate wins in 2026 are coming from page speed optimization. According to Google’s Core Web Vitals data, pages that load in under 2.5 seconds convert at an average of 1.9 times the rate of pages that load in over 4 seconds. Run your landing pages through Google PageSpeed Insights before running any A/B test. Technical performance is conversion performance.
Use the 5 Second Test Before Launching Any Page
The 5 Second Test is a usability method where you show a new visitor your landing page for exactly 5 seconds and then ask them to describe what the page is offering, who it is for, and what they should do next. If they cannot answer all three questions correctly, your conversion rate will suffer regardless of how much traffic you drive. Tools like Lyssna (formerly UsabilityHub) allow you to run this test remotely with a panel of real respondents.
Build a Minimum Viable Conversion Funnel Before Optimizing
Many businesses attempt to optimize a conversion rate before they have a clean, simple funnel in place. Before split testing headlines or button colors, confirm that: your tracking fires correctly on every conversion, your page loads in under 2.5 seconds on mobile, your form has 3 fields or fewer for initial lead capture, and your thank-you page or confirmation state clearly communicates what happens next. These four elements form the Minimum Viable Conversion Funnel.
Segment Conversion Rate by Device Type as a Standard Practice
According to Contentsquare’s 2025 Digital Experience Benchmark report, mobile users account for 58% of all web traffic but generate only 38% of all conversions across most industry categories. This gap represents a significant conversion rate opportunity. Segmenting conversion rate by device and then separately optimizing the mobile experience for your highest-traffic pages is one of the highest-ROI activities available to any digital marketing team.
Test Social Proof Placement, Not Just Presence
Most marketers know that social proof increases conversion rate. Fewer know that the placement of social proof matters as much as its presence. In ConversionXperts testing across 14 client landing pages in 2025, moving customer testimonials from the bottom of the page to directly below the primary call-to-action button increased conversion rate by an average of 23% without any other changes to the page.
REAL-WORLD CONVERSION RATE CASE STUDIES
Case Study: SaaS Company Doubles Conversion Rate Through Funnel Segmentation
A B2B project management SaaS company came to ConversionXperts with a blended free trial conversion rate of 1.8%. Initial analysis revealed that organic search traffic was converting at 3.6% while paid LinkedIn traffic was converting at 0.4%. The paid campaign was heavily subsidizing an already-healthy organic channel while its own performance was being obscured by the blended number.
By separating the budget allocation, creating a dedicated landing page for the LinkedIn audience with messaging aligned to their specific job roles, and adding a 30-second explainer video tailored to enterprise team leads, the LinkedIn paid traffic conversion rate improved from 0.4% to 2.1% within 60 days. Overall blended conversion rate rose from 1.8% to 2.9%, a 61% increase.
Case Study: Ecommerce Brand Recovers Lost Mobile Conversions
An apparel ecommerce brand in Pakistan was seeing strong desktop conversion rates of 3.4% but a mobile conversion rate of only 0.9%. Mobile accounted for 71% of their traffic. Diagnosis using the Conversion Rate Clarity Stack identified Layer 3 (Page Clarity) and Layer 5 (Friction Reduction) as the primary failure points. The mobile checkout required 7 steps compared to 3 steps on desktop, and the product images were not optimized for mobile viewport sizing.
After reducing the mobile checkout to 3 steps, enabling one-tap JazzCash and EasyPaisa payment options relevant to the Pakistani market, and implementing mobile-first product image sizing, mobile conversion rate rose from 0.9% to 2.6% within 45 days. Monthly revenue increased by 31% without any increase in advertising spend.
FAQ: PEOPLE ALSO ASK
What is conversion rate and why does it matter?
Conversion rate is the percentage of visitors who complete a desired action out of the total number of visitors who had the opportunity to complete it. It matters because it directly connects your marketing investment to business outcomes. A higher conversion rate means you generate more results from the same traffic, reducing your cost per acquisition and increasing profitability without requiring additional ad spend.
How do you calculate conversion rate step by step?
To calculate conversion rate, divide the number of completed goal actions by the total number of visitors (or sessions or impressions), then multiply the result by 100. For example, if 80 people out of 4,000 visitors completed a purchase, the conversion rate is (80 divided by 4,000) multiplied by 100, which equals 2%. Always define your conversion event, choose the right denominator, and measure within a consistent time window before applying the formula.
What is a good conversion rate in 2026?
A good conversion rate in 2026 depends heavily on industry and traffic source. According to WordStream’s industry benchmarks, the average conversion rate across most industries is between 2% and 5%. Legal services and financial services see average conversion rates above 5% for paid search traffic. For ecommerce, 1.8% to 3.5% is considered average, while top-performing stores convert at above 5%. Compare your conversion rate only against benchmarks in your specific industry and traffic channel.
How does conversion rate differ from click-through rate?
Conversion rate measures the percentage of visitors who complete a business goal such as a purchase, form submission, or signup. Click-through rate measures the percentage of people who click on an ad, email, or link after seeing it. Click-through rate tells you how compelling your message is at attracting attention. Conversion rate tells you how effectively your landing experience turns that attention into a business result. Improving CTR without improving conversion rate means you are paying for more unqualified clicks.
What is the difference between session conversion rate and user conversion rate?
Session conversion rate measures the percentage of visits that include a conversion event. User conversion rate measures the percentage of individual people who convert. Because one person can visit your site multiple times before converting, user conversion rate is almost always lower than session conversion rate. For landing page optimization and advertising performance measurement, user conversion rate is the more accurate metric because it reflects human behavior rather than session volume.
Why is my conversion rate low even though my traffic is high?
A high-traffic, low-conversion-rate combination almost always indicates one or more of these problems: misaligned traffic intent, a weak or unclear value proposition on the landing page, insufficient trust signals such as testimonials or security badges, friction in the conversion path such as too many form fields or steps, or slow page load speed. Apply the Conversion Rate Clarity Stack to diagnose which layer is failing before making changes to your page or campaigns.
How often should you calculate conversion rate?
Calculate conversion rate at minimum once per month for strategic reporting and once per week for campaign monitoring. For active A/B tests, calculate conversion rate daily but do not act on the data until you have reached statistical significance at the 95% confidence level. Avoid making optimization decisions based on fewer than 7 days of data or fewer than 500 sessions per variation in a test.
Can conversion rate be above 100%?
No. A conversion rate above 100% is mathematically impossible when using unique visitors as the denominator and counting each visitor only once per conversion event. However, a session-based conversion rate can theoretically exceed 100% if a single session triggers multiple conversion events, such as a visitor purchasing two different items in one session if each item is tracked as a separate conversion. This is a tracking configuration error in most cases and should be corrected.
CONCLUSION AND NEXT STEPS
Knowing how to calculate conversion rate is the starting point, not the destination. The formula itself (conversions divided by visitors, multiplied by 100) takes seconds to apply. The real skill is in defining the right conversion events, choosing the right denominators, segmenting results meaningfully, and using frameworks like the Conversion Rate Clarity Stack to turn data into action.
Three things to remember above all else: First, a blended conversion rate obscures more than it reveals. Always segment. Second, conversion rate is not a standalone metric. Track it alongside revenue per visitor and lead quality to get the full picture. Third, optimization without measurement is just guessing. Set up accurate tracking before you change a single element of your funnel.
Start improving your conversion rate today by visiting ConversionXperts.com for a free conversion audit of your highest-traffic landing page.
Next Steps:
Run your primary landing page through the Conversion Rate Clarity Stack diagnostic using the five layers described in Section 4. Set up User Conversion Rate tracking in Google Analytics 4 with proper goal event configuration as described in Section 3.3. Benchmark your current conversion rate against the industry data table in Section 5 to identify your performance gap.
REFERENCES AND SOURCES
WordStream Conversion Rate Benchmarks by Industry, 2025. Available at wordstream.com/blog/conversion-rates.
HubSpot State of Marketing Report, 2025. Available at hubspot.com/state-of-marketing.
Contentsquare Digital Experience Benchmark Report, 2025. Available at contentsquare.com/benchmarks.
Unbounce Conversion Benchmark Report, 2025. Available at unbounce.com/conversion-benchmark-report.
Google Core Web Vitals and Page Experience Documentation, 2026. Available at developers.google.com/search/docs/appearance/core-web-vitals.
Optimizely Experimentation Impact Report, 2025. Available at optimizely.com/insights.
Ruler Analytics Marketing Attribution Report, 2025. Available at ruleranalytics.com/blog.
ConversionXperts Original Data: Conversion Rate Analysis Across 200 Client Accounts, January 2024 to March 2026. Methodology: aggregated anonymized performance data from client Google Analytics 4 accounts and CRM systems. Sample size: 200 accounts across 12 industry categories.
I'm Kamran Mushtaq, CEO of Conversion Xperts and a CRO Specialist with 9+ years of experience helping Shopify and Shopify Plus brands increase conversions and revenue through data-driven optimization.Over the years, I've delivered 300+ CRO audits and executed 4,700+ A/B tests, helping ecommerce brands improve conversion rates, average order value, and overall customer experience. As a Top 3% Upwork Freelancer, Google Analytics Certified Professional, and GTM Specialist, I specialize in analytics, user behavior insights, A/B testing, and conversion-focused growth strategies that drive measurable business results.