Conversion Rate Optimization Statistics: The Ultimate 2026 Guide
Introduction
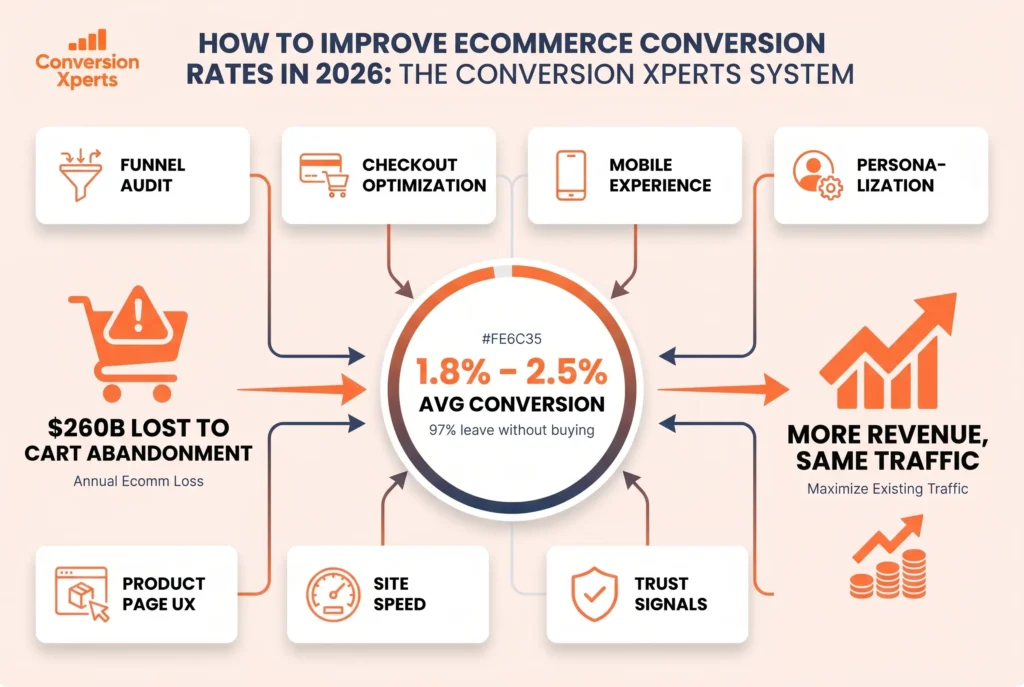
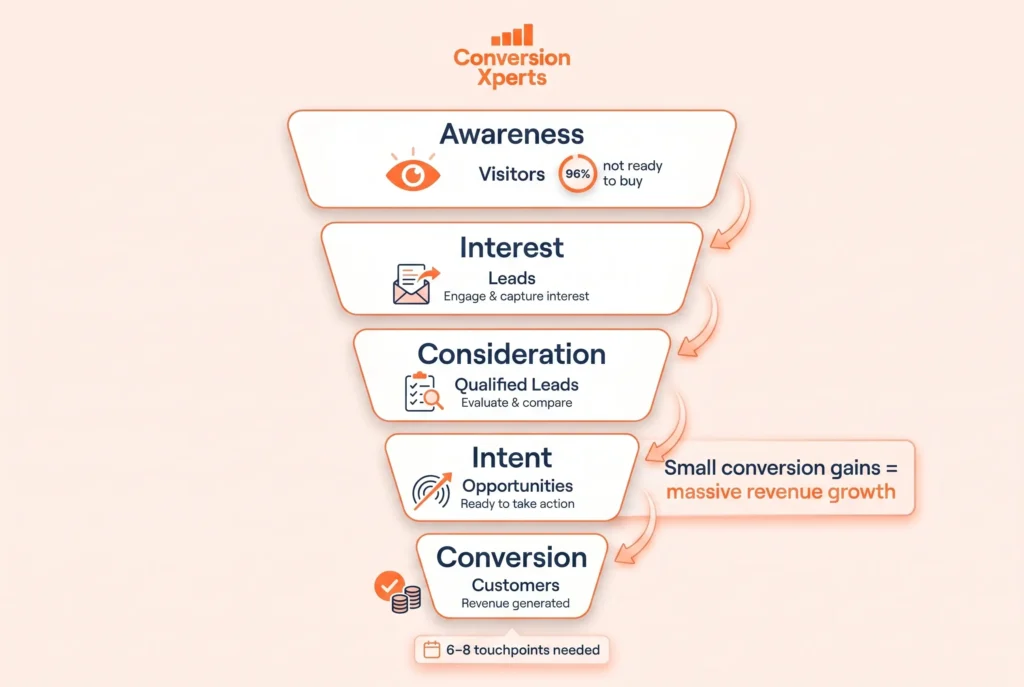
Did you know that most websites convert less than 3% of their visitors , meaning 97 out of every 100 people leave without taking action? That’s not just traffic lost. That’s revenue walking out the door.
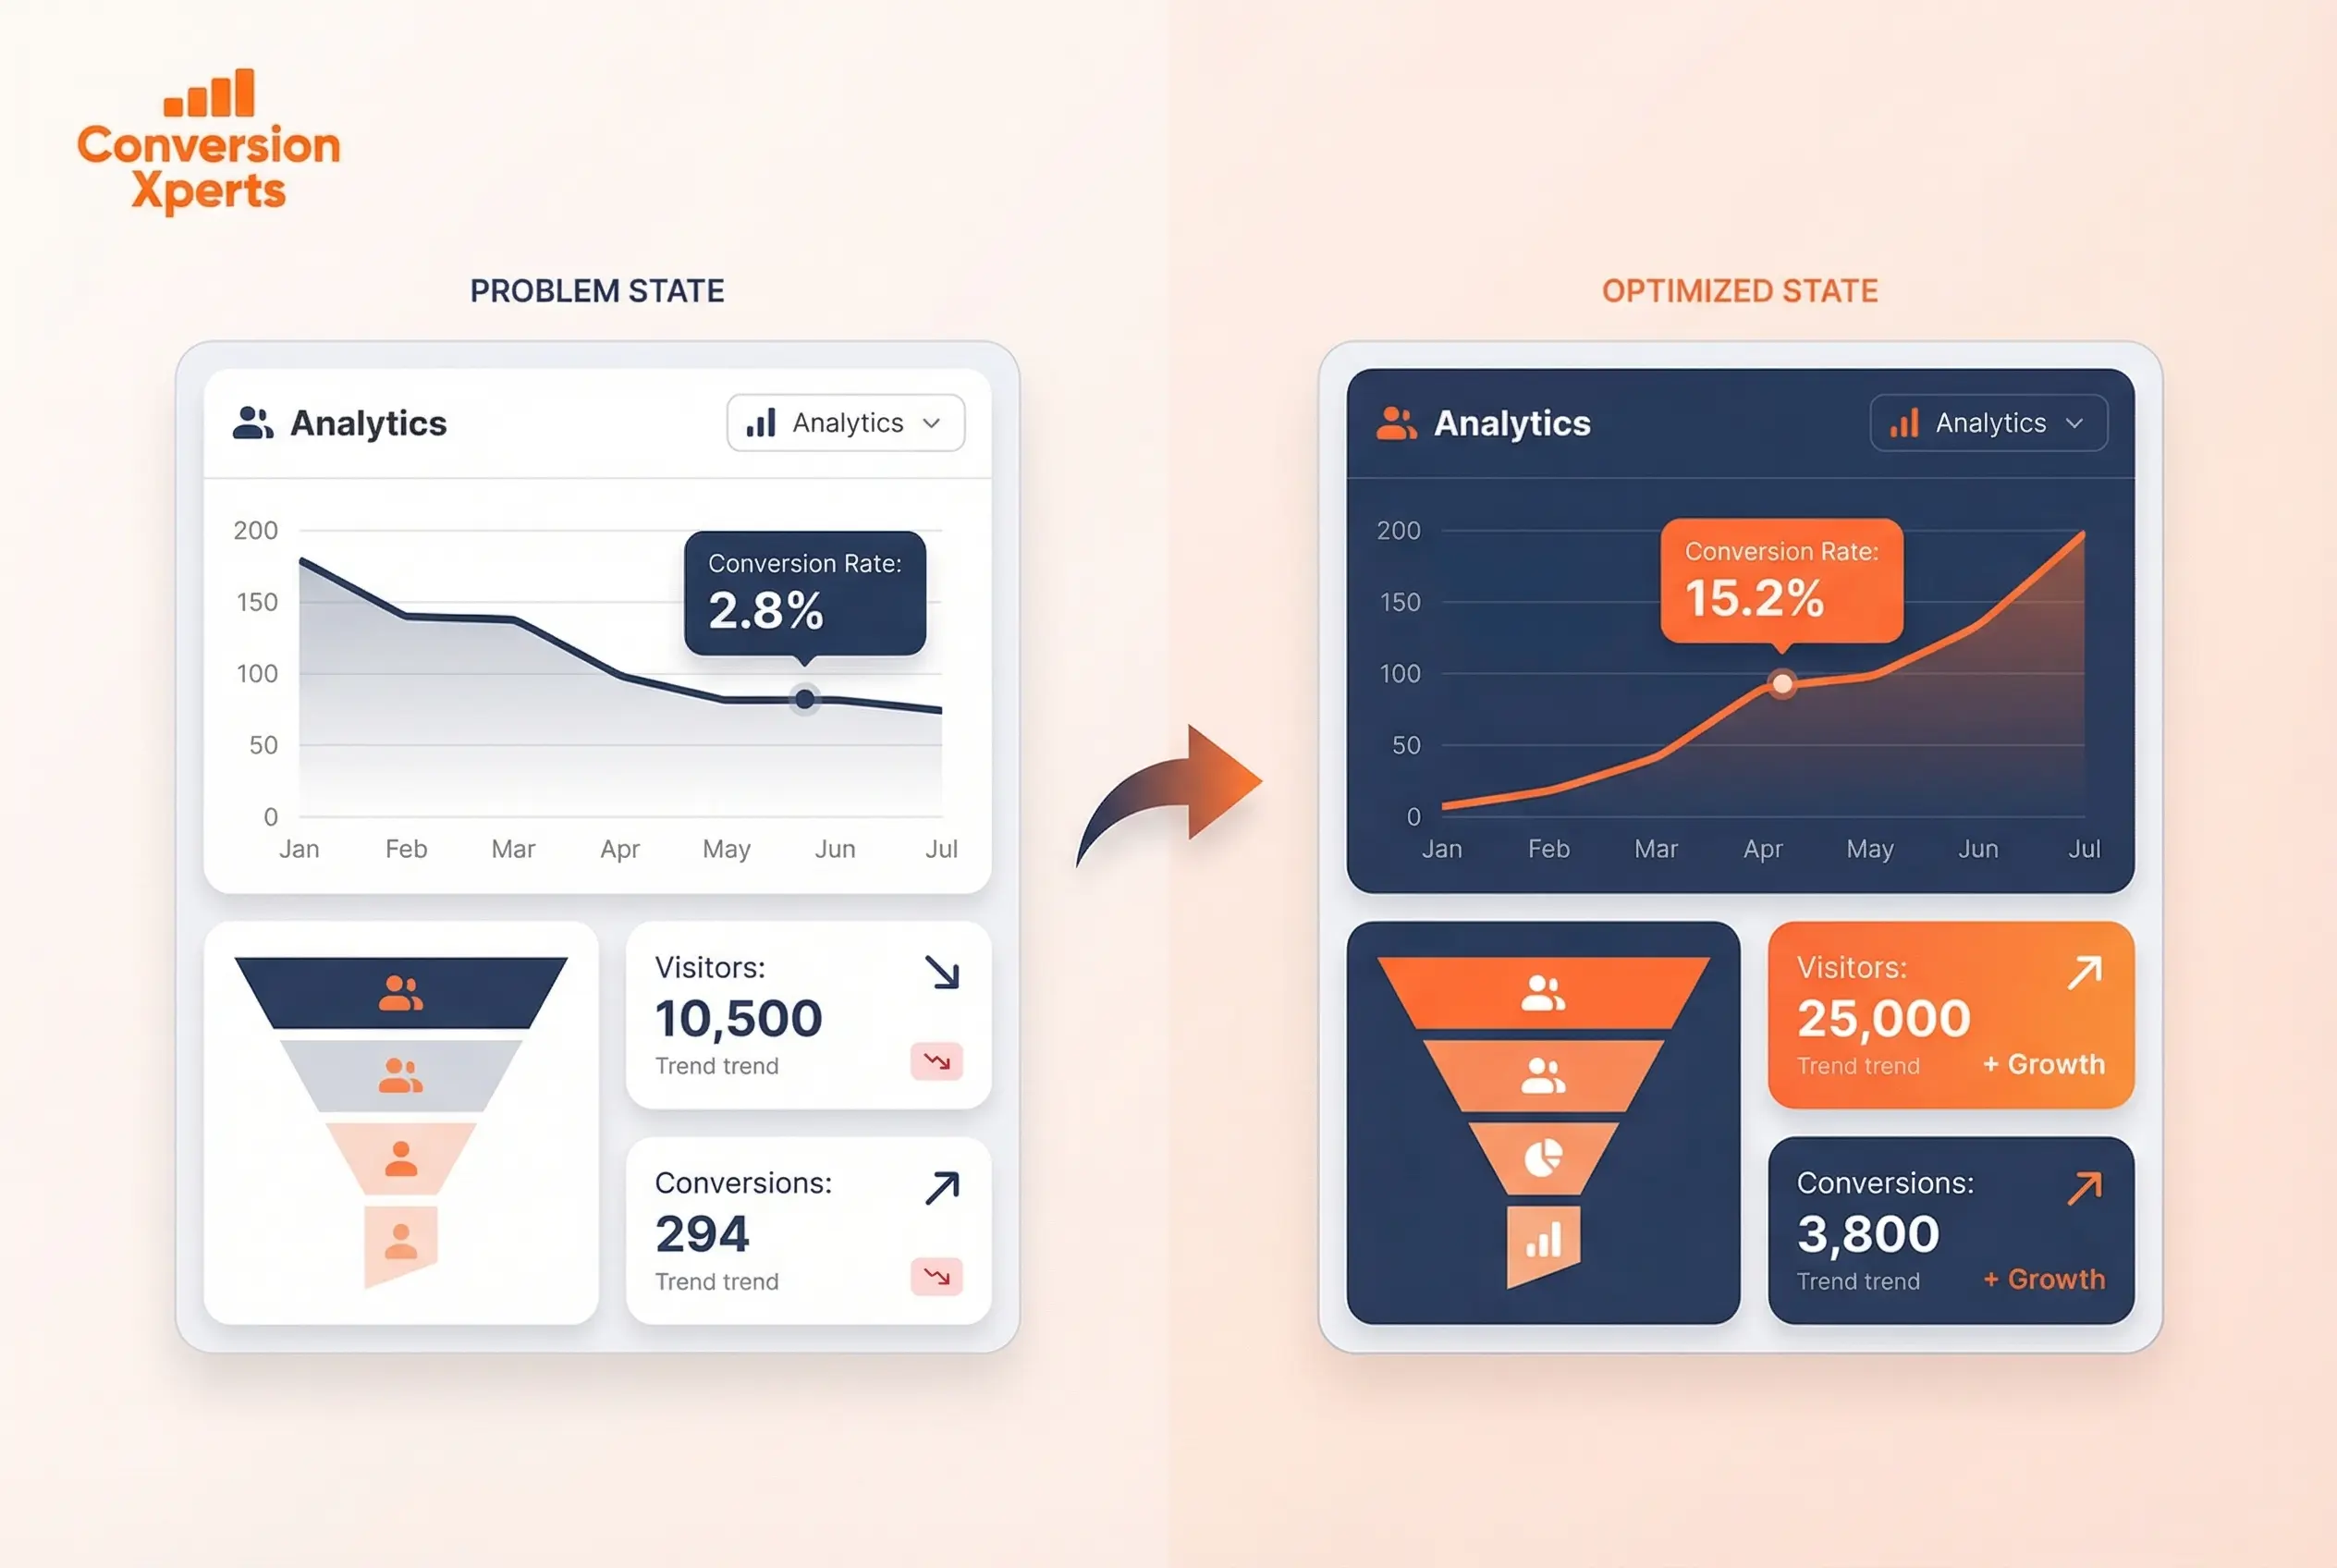
Conversion rate optimization statistics in 2026 tell a story every business owner, marketer, and digital strategist needs to hear: small, data-backed improvements to your website can dramatically increase sales without spending more on ads.
In this guide, you’ll learn:
- What CRO is and why it matters right now
- The latest conversion rate statistics across industries and channels
- Why mobile, speed, and personalization are dominating CRO results
- What the best companies are doing differently
- How to apply these stats to grow your business , and why ConversionXperts.com is the team to help you do it
Whether you’re a business owner in Pakistan, a global eCommerce brand, or an agency looking to benchmark performance, this guide gives you everything you need to turn your website from a digital brochure into a revenue-generating machine.
What Is CRO?
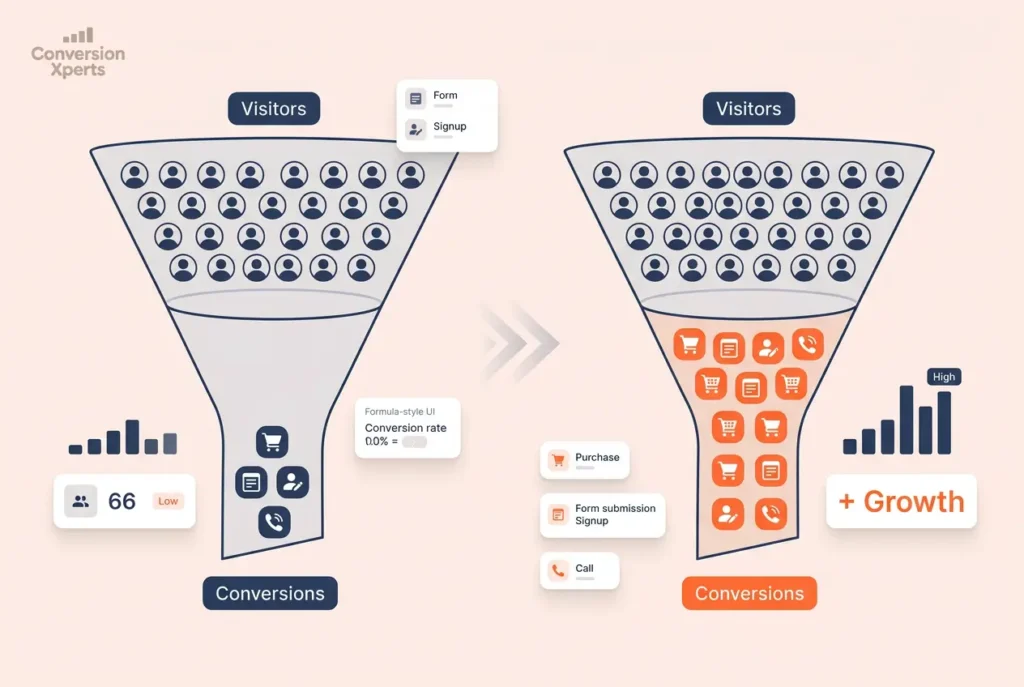
Conversion Rate Optimization (CRO) is the systematic process of increasing the percentage of website visitors who take a desired action, such as making a purchase, submitting a form, or booking a call, without increasing your ad spend.
Think of it this way. If 1,000 people visit your website every day and 20 of them buy, your conversion rate is 2%. CRO is the art and science of turning that 2% into 4%, 6%, or even higher by understanding why people leave and fixing those friction points.
A “conversion” can mean different things depending on your goals:
- eCommerce: A completed purchase
- B2B / Services: A form submission, quote request, or booked demo
- SaaS: A free trial sign-up or subscription
- Lead generation: An email opt-in or phone call
CRO combines data analytics, user behavior research, A/B testing, UX design, copywriting, and psychology to make your existing traffic work harder.
The CRO formula is simple:
Conversion Rate = (Conversions ÷ Total Visitors) × 100
If 5,000 people visit your site and 150 buy something, your conversion rate is 3%.
CRO is not guesswork. It’s a structured, repeatable process. And the statistics in this guide will show you exactly why it deserves to be at the heart of every digital marketing strategy in 2026.
General Conversion Rate Optimization Statistics 2026
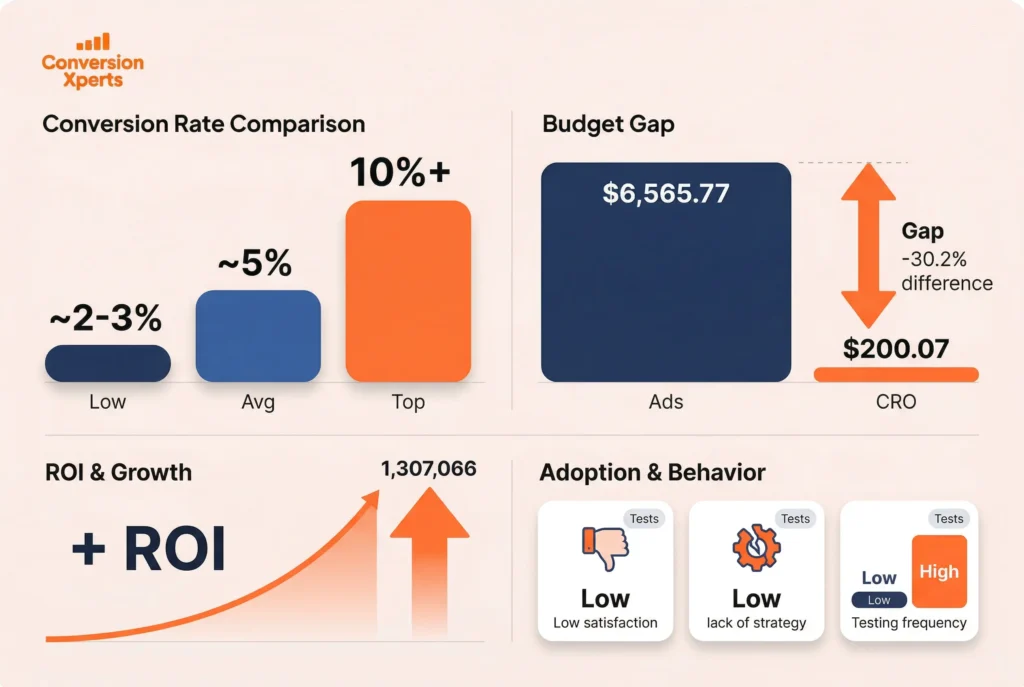
Understanding where the industry stands is the first step to knowing where you need to go. Here are the most important conversion rate optimization statistics you need to know right now.
Average Website Conversion Rates
- The average website conversion rate across all industries is 2.35%, with top-performing sites achieving 11% or higher. (Keywords Everywhere, 2026)*
- Top-quartile websites convert at 5.31% or above — more than double the average.
- The global average eCommerce conversion rate sits at approximately 2.58% in 2026. (Landbase, 2026)
- High-performing eCommerce stores consistently convert at 5–7% — two to three times the industry average. (Marketing LTB, 2026)*
- Companies that invest in CRO tools see a 223% average return on investment. (BigSur AI, 2026)*
The CRO Budget Gap
Here is one of the most shocking conversion rate optimization stats you’ll find:
- Brands spend $92 on customer acquisition for every $1 they spend on conversion optimization. (Econsultancy via BigSur AI)
That’s a near-total neglect of the conversion side of the equation. You’re paying to drive traffic but barely investing in making that traffic convert. This is the single biggest opportunity gap for most businesses today — especially in competitive markets like Pakistan, where digital ad costs are rising while CRO adoption remains low.
- Brands investing in CRO tools and services report 223% ROI on average.
- Every $1 invested in UX improvement returns up to $100 in revenue. (Forrester Research)
- Businesses that prioritize CRO are twice as likely to see a large increase in sales compared to those that don’t.
CRO Adoption Rates
- Only 22% of businesses are satisfied with their current conversion rates. (Econsultancy)
- 68% of small businesses don’t have a structured CRO strategy. (HubSpot)
- 46.9% of marketers run only one or two CRO tests per month. (Marketing LTB, 2026)*
- Companies running 10+ tests per month grow 2.1× faster than those running fewer tests. (Marketing LTB, 2026)*
Industry-Specific Conversion Rate Statistics
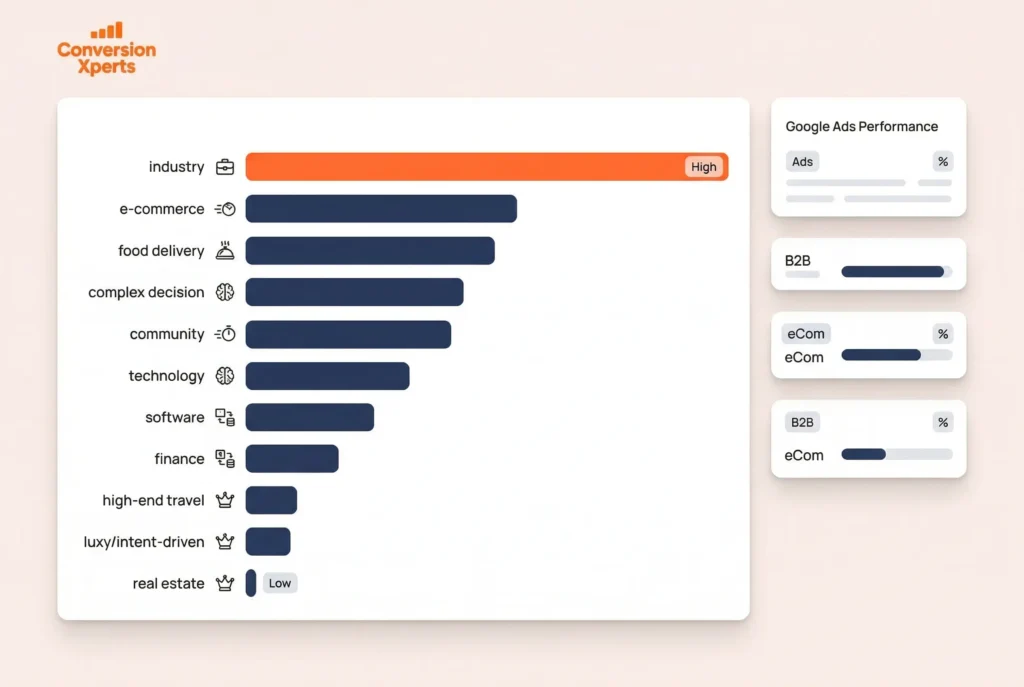
Conversion rates are not one-size-fits-all. Understanding where your industry sits is critical to setting realistic goals and benchmarking your performance.
eCommerce Conversion Rates by Sector
| Industry | Average Conversion Rate |
Personal Care / Beauty | 6.8% |
Food & Beverages | 4.9% |
Professional Services | 4.6% |
Healthcare | 3.0–3.4% |
Finance | 2.78–3.1% |
B2C eCommerce (General) | 2.1% |
Real Estate | 2.91% |
Higher Education | 2.8% |
Travel | 2.4% |
B2B eCommerce | 1.8% |
Luxury Goods (e.g., Handbags) | 0.3% |
Sources: Keywords Everywhere 2026, VWO 2026, Shopify 2026
Key Takeaways from Industry Data
Personal care and beauty tops the chart at 6.8%. Why? Lower price points, repeat purchase behavior, and strong trust signals (customer reviews, before/after imagery) reduce friction significantly.
B2B eCommerce averages just 1.8%. This is expected — B2B purchases involve longer decision cycles, multiple stakeholders, and higher price points. If you’re in B2B and hitting 2%+, you’re performing above average.
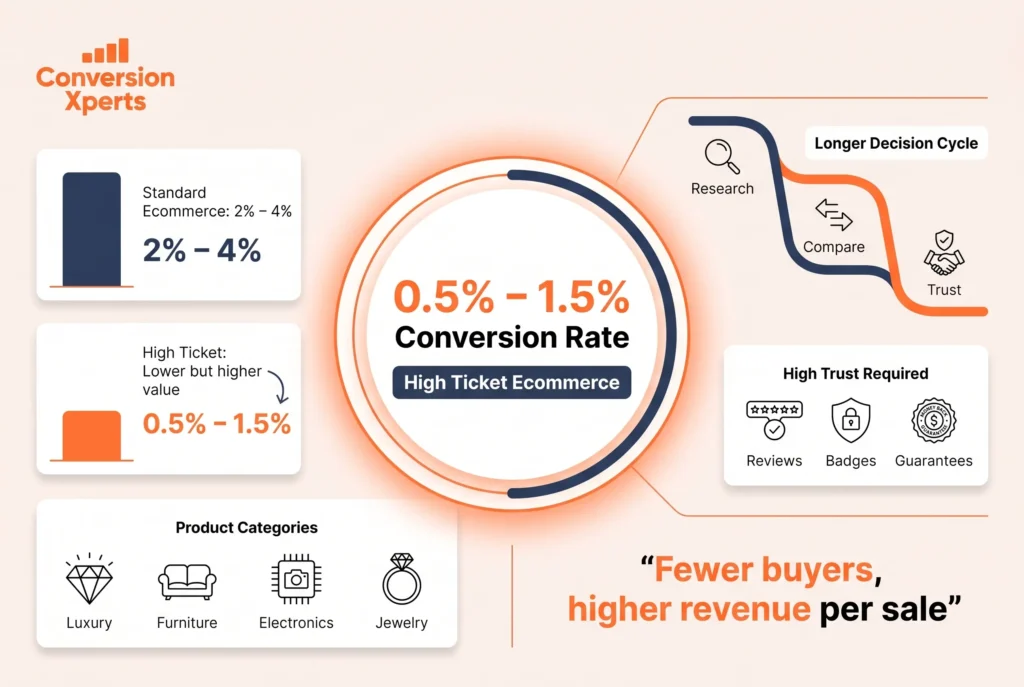
Luxury goods sit at 0.3% — not a failure, but a reflection of intentional browsing. Luxury buyers don’t impulse-buy. CRO in this space focuses on aspirational content, exclusivity signals, and seamless personalization.
Google Ads Conversion Rate Benchmarks
Paid traffic converts differently from organic. Here’s how Google Ads performs by industry:
- Overall average Google Ads conversion rate: 6.96% (Keywords Everywhere, 2024)
- Automotive Repair: 12.96% — highest among all categories
- Animals & Pets: 12.03%
- Physicians & Surgeons: 11.08%
- Furniture: 2.53% — one of the lowest
- Finance & Insurance: 2.78%
The gap between the best and worst performing industries is enormous. If you’re in a high-performing sector and your conversion rate is below 5%, you have significant room to improve.
Mobile & Page Speed CRO Statistics
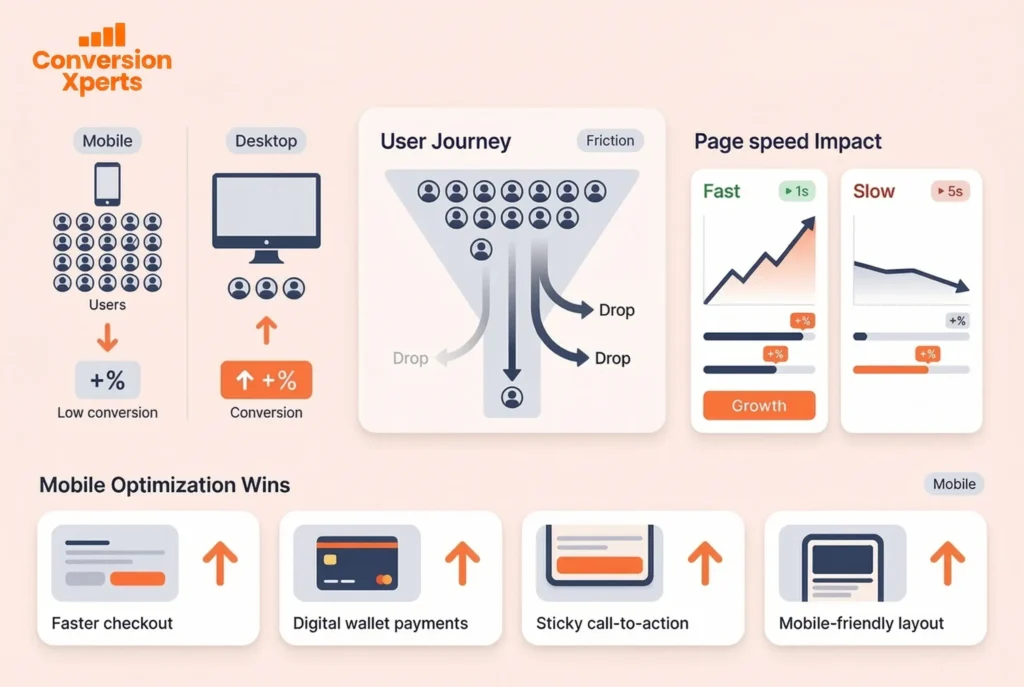
Mobile optimization is no longer optional. It’s the battleground where most conversion battles are won or lost. These CRO statistics make the case clearly.
Mobile Conversion Rates
- Mobile devices generate roughly 60% of global web traffic, yet they convert at only 1.6–2.9% compared to desktops’ 3–4.8%. (Contentsquare 2024, Landbase 2026)
- Mobile eCommerce sales are projected to hit $3.4 trillion by 2026 — despite lower conversion rates. (Landbase)
- Mobile-friendly sites see a 67% higher likelihood of conversion than non-mobile-optimized sites. (Linear Design)
- Mobile cart abandonment reaches 85.65%, far exceeding desktop (73.76%) and tablet (80.74%). (Shopify, 2026)*
- Landing pages optimized for mobile convert 26% higher than non-optimized versions. (Marketing LTB)
- Stores with Apple Pay or Google Pay see 21% higher mobile conversions. (Marketing LTB)
Page Speed Statistics
Page speed is one of the highest-ROI improvements any website can make. The data is unambiguous:
- Sites loading in 1 second convert 3× better than sites taking 5 seconds. (Landbase, 2026)*
- Every 1-second delay in load time reduces conversions by 4–7%. (Marketing LTB)
- 53% of users abandon a page that takes longer than 3 seconds to load. (Marketing LTB)
- Mobile conversions can fall up to 20% for every one-second delay on mobile specifically. (Shopify)
- Pages optimized with faster load times and better UX see up to 30% conversion lift from UX improvements alone. (Marketing LTB)
Mobile Optimization Quick-Win Table
| Optimization | Conversion Lift |
Mobile-optimized checkout flow | +22% |
Offering Apple Pay / Google Pay | +21% |
Sticky CTAs on mobile | +12% |
Thumb-optimized layouts | +9% (add-to-cart rate) |
Mobile-first page designs vs desktop-first | +17% |
1-second page speed improvement | +4–7% |
Source: Marketing LTB, 2026
Bottom line: If your site isn’t fast and mobile-friendly, you’re leaving money on the table — regardless of how much you spend on ads.
Sales Conversion: Channel & Traffic Statistics
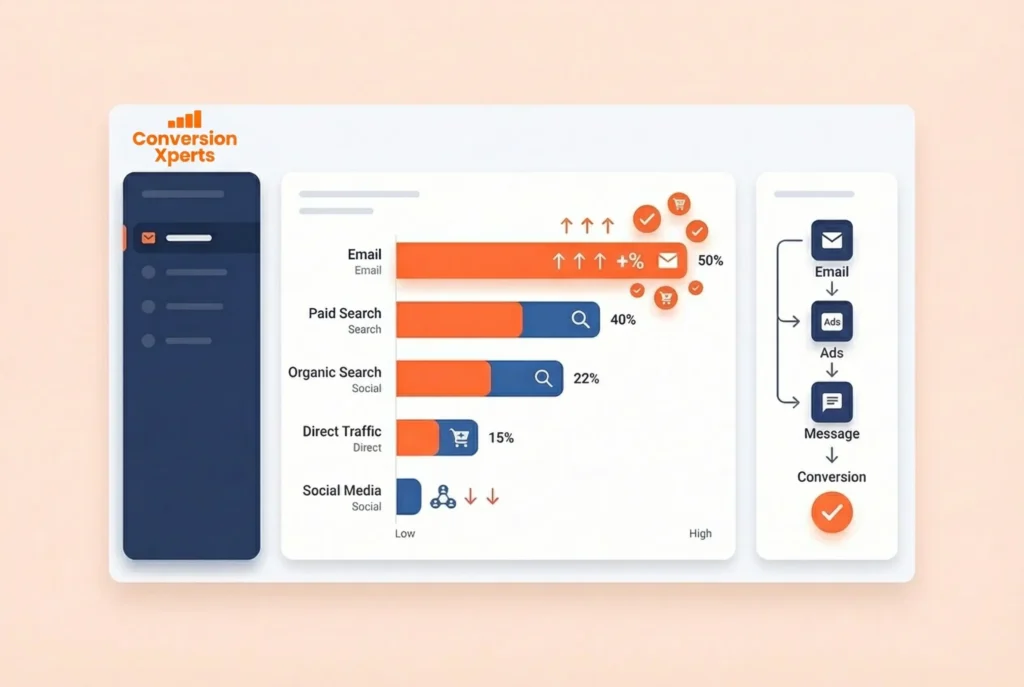
Sales conversion rates vary dramatically depending on where your traffic comes from. Understanding which channels drive the highest-quality visitors allows you to allocate budget smarter and optimize the right pages.
Conversion Rates by Marketing Channel
| Channel | Average Conversion Rate |
Email Marketing | ~15.22% |
Direct Traffic | 3.13% |
Organic Search | 2.0–4.0% |
B2B Organic Search | 2.6% |
B2C Organic Search | 2.1% |
Paid Search (Google Ads) | ~6.96% |
Organic Social Media | 1.05% |
Paid Social | 0.61% |
Sources: Landbase 2026, ContentSquare 2024, Keywords Everywhere 2024
Email Marketing Dominates Sales Conversion
Email is the undisputed champion of sales conversion, and the statistics prove it:
- Email marketing converts at approximately 15.22% — dramatically higher than any other channel.
- Personalized emails convert 18% better than generic broadcast emails. (Marketing LTB)
- CRO-optimized emails generate 31% higher click-through rates. (Marketing LTB)
- Abandoned cart emails recover 10–14% of lost sales. (Marketing LTB)
- Automated product recommendation emails lift sales by 22%. (Marketing LTB)
Social Media’s Surprisingly Low Conversion Rate
One of the most counterintuitive conversion rate statistics: social media converts poorly.
Organic social sits at just 1.05%, and paid social trails further at 0.61%. (ContentSquare 2024)
This doesn’t mean you should abandon social media. But it strongly suggests that social should be used for awareness and brand building — while email and direct traffic do the heavy lifting for conversions.
Retargeting & Multi-Channel Statistics
- 70% of retargeted website visitors are likely to convert — making retargeting one of the most powerful CRO strategies. (Keywords Everywhere)
- Retargeting ads increase conversions by 26%. (Marketing LTB)
- Multi-channel remarketing increases conversions by 31%. (Marketing LTB)
- SMS reminders convert 28% better than email alone. (Marketing LTB)
- High-intent retargeting campaigns convert at 12–18%. (Marketing LTB)
The message is clear: one-touch marketing rarely converts. Brands that engage customers across multiple touchpoints — email, retargeting, SMS, organic content — see dramatically higher sales conversion rates.
A/B Testing & Personalization Statistics
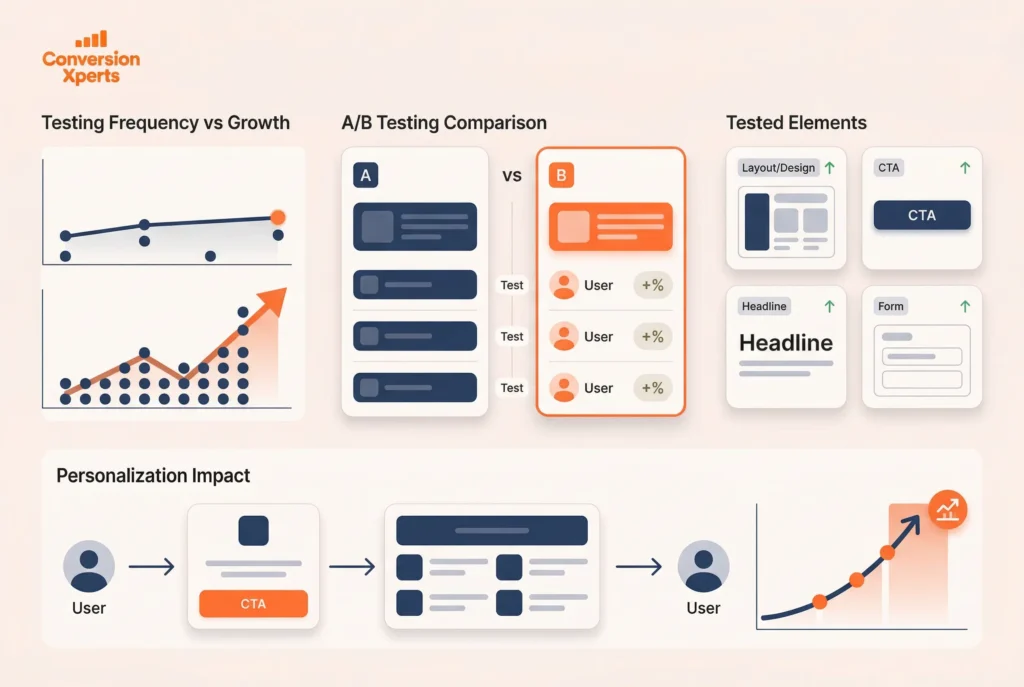
CRO is driven by testing. You can’t optimize what you don’t measure, and you can’t improve what you don’t test. Here’s what the data says about A/B testing and personalization in 2026.
A/B Testing Statistics
- 46.9% of marketers run only 1–2 tests per month. (Marketing LTB)
- Just 9.5% of CRO specialists run 20+ tests per month — these are the companies that grow the fastest.
- Companies running 10+ tests per month grow 2.1× faster than those that test less frequently. (Marketing LTB)
- Layout redesign tests produce the largest conversion lifts: 18–40%. (Marketing LTB)
- CTA copy tests produce an average 12% lift. (Marketing LTB)
- Headline tests produce an average 9% lift. (Marketing LTB)
- Button color tests yield an average 6% lift. (Marketing LTB)
- Only 17% of companies run multipage experiments, missing out on major funnel-wide gains. (Marketing LTB)
What Gets Tested (And What Wins)
| Test Type | Average Conversion Lift |
Layout redesign | 18–40% |
CTA copy | 12% |
Headline | 9% |
Social proof placement | 14% |
Form simplification | Varies (up to 53.8%) |
Button color | 6% |
FAQ addition | 9% |
Personalization Statistics
Personalization is no longer a luxury — it’s the expectation:
- Personalized CTAs perform 202% better than generic versions. (Landbase, 2026)*
- Personalized product recommendations increase conversions by 26%. (BigSur AI, 2026)*
- Including customer testimonials boosts landing page conversions by 14%. (Marketing LTB)
- Value-focused headlines improve conversions by 27%. (Marketing LTB)
- Benefit-driven CTA buttons outperform generic CTAs by 19%. (Marketing LTB)
- Adding FAQs to a page increases conversions by 9%. (Marketing LTB)
- Heatmap-optimized pages convert 14% higher. (Marketing LTB)
Cart Abandonment & Checkout Optimization Statistics
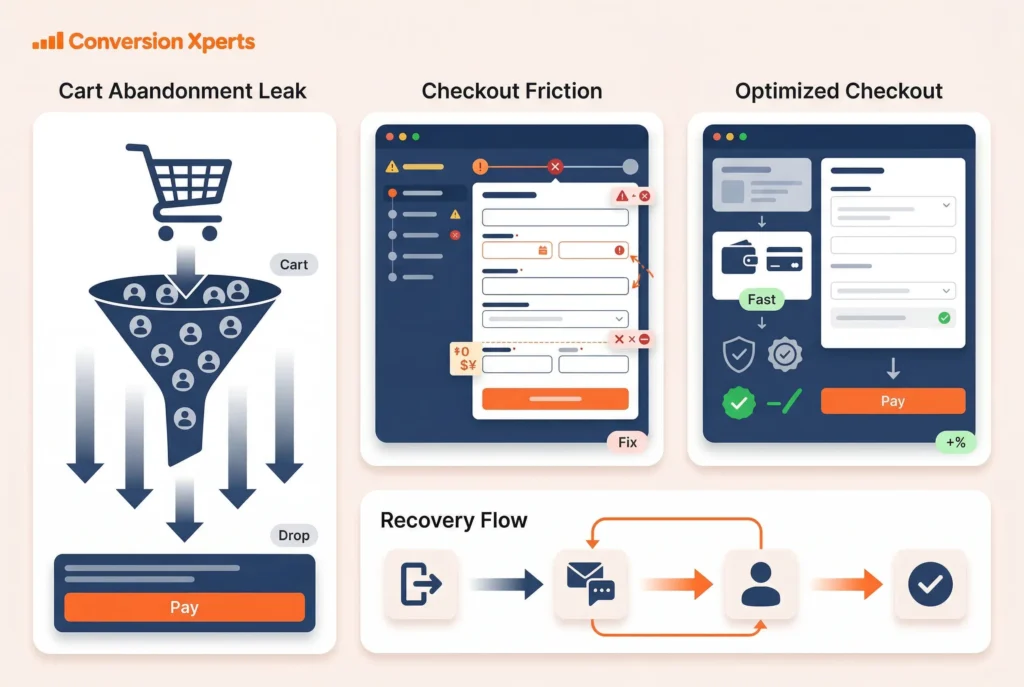
Cart abandonment is the single biggest revenue leak for eCommerce businesses. Understanding why it happens — and how to fix it — is core to any serious CRO strategy.
Cart Abandonment Rates
- 70.19% of online shopping carts are abandoned globally. (Baymard Institute)
- Mobile abandonment is even worse at 85.65%, versus 73.76% on desktop. (Shopify)
- 24% of users abandon carts due to unexpected fees — the #1 reason. (Marketing LTB)
- Showing total cost earlier reduces abandonment by 19%. (Marketing LTB)
Checkout Optimization Statistics
The checkout page is where conversions live or die:
| Checkout Optimization | Conversion Lift |
Simplify to one-page checkout | +17% |
Add guest checkout option | +18% |
Mobile-optimized checkout | +22% |
Offer PayPal / digital wallets | +14% |
Show total cost upfront | -19% abandonment |
Autofill-enabled form fields | +12% completion |
Trust signals at checkout | +9% |
Exit popups during checkout | Recover 7–10% of abandoners |
Source: Marketing LTB, 2026
A real-world example: FSAstore.com simplified its web funnel and saw a 53.8% increase in average sales revenue per visitor. (Shopify)
Shop Pay, Shopify’s accelerated checkout tool, lifts conversion by up to 50% compared to guest checkout and outperforms all other accelerated checkout options by at least 10%. (Shopify)
Recovery Strategies That Work
- Abandoned cart emails recover 10–14% of lost sales. (Marketing LTB)
- Exit-intent email popups convert 4–8% of abandoning visitors. (Marketing LTB)
- SMS cart reminders convert 28% better than email alone. (Marketing LTB)
AI & Technology in CRO Statistics
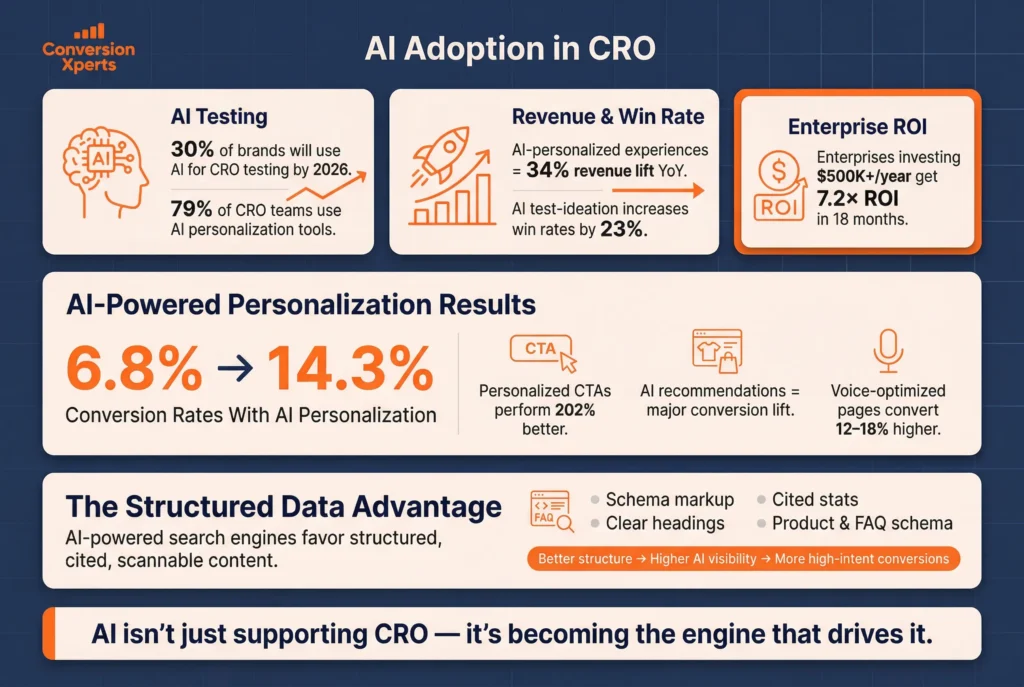
Artificial intelligence is transforming conversion rate optimization. In 2026, AI isn’t just a tool — it’s becoming the engine that drives CRO at scale.
AI Adoption in CRO
- 30% of brands stated they are likely to use AI to improve their CRO testing processes by 2026. (BigSur AI)
- 79% of CRO professionals now use AI-powered personalization tools — up from 68% in 2025. (Gartner via Amra & Elma)
- Organizations with fully integrated AI personalization report average revenue lifts of 34% year-over-year. (Gartner)
- AI-assisted test ideation increases win rates by 23%. (Marketing LTB)
- Enterprises spending over $500K annually on AI personalization see a median ROI of 7.2× within 18 months. (Gartner)
AI-Powered Personalization Results
- Brands using AI-driven funnel personalization have pushed average conversion rates to 6.8%, with top 10% of performers exceeding 14.3%. (Forrester Research)
- Personalized CTAs perform 202% better than generic versions. (Landbase)
- Stores with AI-driven product recommendations see significant conversion lifts over stores without them. (Marketing LTB)
- Voice search-optimized landing pages convert 12–18% better than non-optimized pages. (BrightEdge)
The Structured Data Advantage
AI-powered search engines like Google AI Overviews, Perplexity, and ChatGPT Search increasingly favor content that’s structured, cited, and specific. Websites that implement:
- Schema markup for products, reviews, and FAQs
- Structured, scannable content with clear headings
- Cited statistics with sources and years
…are significantly more likely to be featured in AI-generated answers — which drives zero-cost, high-intent traffic to conversion-optimized landing pages. This is where SEO and CRO intersect most powerfully.
Conversion Rate Optimization Guide: What Top Performers Do Differently
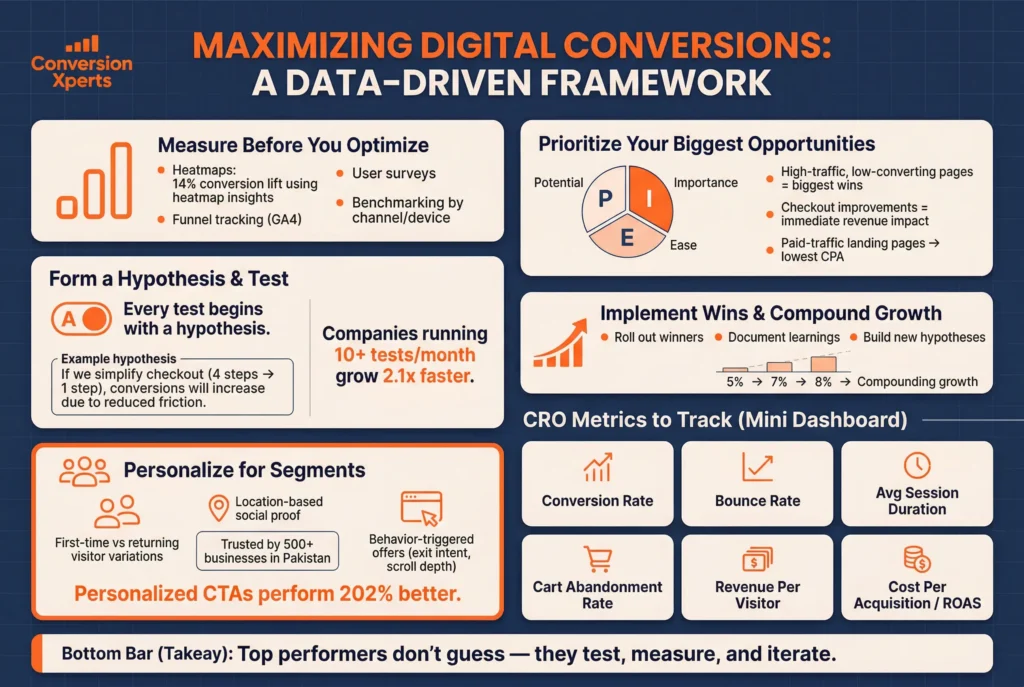
The top-performing websites don’t just get lucky — they follow a repeatable, structured process for conversion rate optimization. Here’s what separates the 11%+ converters from the 2% average.
Step 1: Measure Before You Optimize
You cannot improve what you don’t measure. Top CRO practitioners always start with data:
- Install heatmaps (tools like Hotjar or Microsoft Clarity) to see where users click, scroll, and drop off.
- Set up funnel tracking in Google Analytics 4 to identify where visitors exit your conversion flow.
- Run user surveys to understand objections and confusions.
- Benchmark your current conversion rate by channel, device, and traffic source.
Stat: Heatmap-optimized pages convert 14% higher than non-optimized counterparts. (Marketing LTB)
Step 2: Prioritize Your Biggest Opportunities
Not all pages are equal. Focus your CRO effort where it matters most:
- High-traffic, low-converting pages — these are your biggest wins
- Checkout and cart pages — fixing abandonment here has immediate revenue impact
- Landing pages for paid traffic — every percentage point improvement reduces your cost per acquisition
A useful prioritization framework is the PIE model:
- Potential: How much improvement is possible?
- Importance: How much traffic does this page get?
- Ease: How simple is it to implement a change?
Step 3: Form a Hypothesis and Test
Every CRO test starts with a clear hypothesis:
“If we change [X], then [Y] will happen, because [reason].”
Example: “If we simplify our checkout from 4 steps to 1 step, conversions will increase because users face less friction.”
Then run an A/B test — show the original to 50% of visitors and the new version to the other 50%. Let the data decide.
Stat: Companies running 10+ tests per month grow 2.1× faster than those running fewer. (Marketing LTB)
Step 4: Implement Wins and Build on Them
Once a test shows a statistically significant winner:
- Roll out the winning version to 100% of traffic
- Document what you learned
- Form a new hypothesis based on the next biggest opportunity
CRO is a compounding process. A 5% improvement this month, a 7% improvement next month, and an 8% improvement the month after that — these stack into transformative business results.
Step 5: Personalize for Segments
Once you’ve fixed the obvious friction points, move to personalization:
- Show different headlines to first-time visitors vs. returning visitors
- Display location-based social proof (“Trusted by 500+ businesses in Pakistan”)
- Use behavioral triggers (exit intent, scroll depth) to serve targeted offers
Stat: Personalized CTAs perform 202% better than generic versions. (Landbase, 2026)*
CRO Metrics to Track
| Metric | What It Tells You |
Conversion Rate | % of visitors taking the target action |
Bounce Rate | % leaving without any interaction |
Average Session Duration | How engaged visitors are |
Cart Abandonment Rate | Where checkout is failing |
Revenue Per Visitor | Overall commercial efficiency |
Cost Per Acquisition | How much each conversion costs |
Return on Ad Spend (ROAS) | Revenue driven by paid traffic |
Why Choose ConversionXperts.com for CRO Services
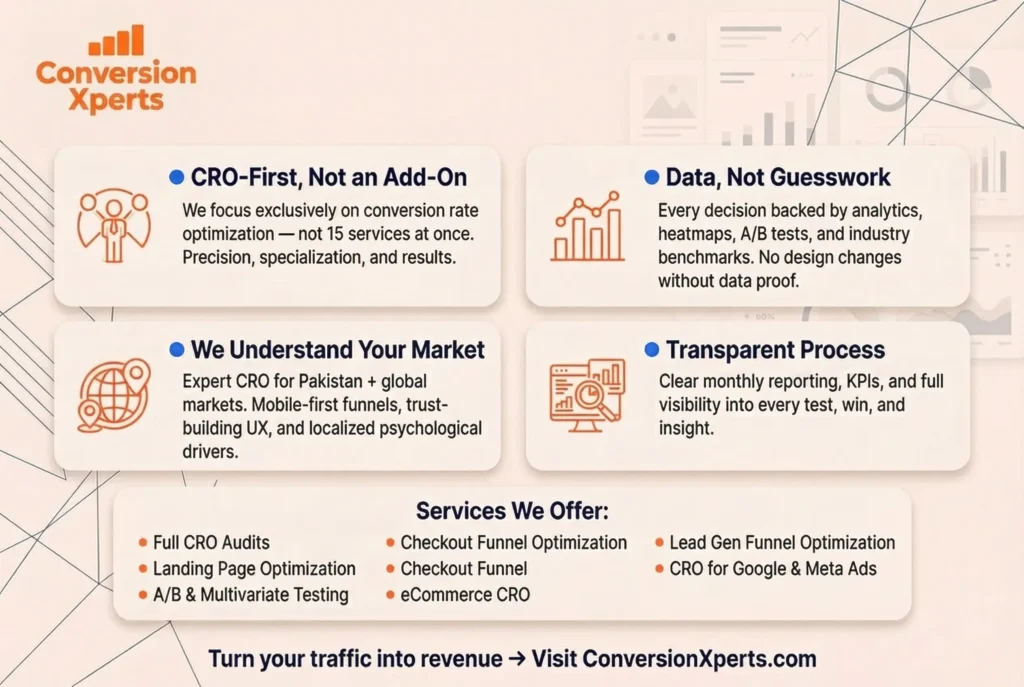
You now know the data. You understand the opportunity. The question is: who do you trust to do this for your business?
ConversionXperts.com is a dedicated conversion rate optimization agency built for businesses that are serious about growth.
Here’s why businesses — from Pakistan to the global stage — choose ConversionXperts:
We Are CRO-First (Not an Agency That Does CRO on the Side)
Most digital agencies offer CRO as an add-on. ConversionXperts is built from the ground up with one mission: to maximize the revenue your website already generates.
We don’t juggle 15 services. We are laser-focused on conversion optimization — and that focus produces results.
We Use Data, Not Guesswork
Every recommendation we make is backed by:
- Heatmap analysis and session recordings
- Funnel and behavior analytics
- Statistical A/B testing
- Industry benchmarks (like the ones in this guide)
We don’t change things because they look nice. We change things because the data says they’ll convert better.
We Understand Your Market
Whether you’re a business in Karachi, Lahore, or Islamabad — or selling globally from Pakistan — we understand the nuances of your audience. We know that trust signals matter more in markets where online shopping is growing fast. We know that mobile-first optimization is non-negotiable in South Asian markets. And we know how to build conversion funnels that speak to your customers.
Our Process Is Transparent
You’ll always know what we’re testing, why we’re testing it, and what results it produced. Monthly reporting. Clear KPIs. No black boxes.
Services We Offer
- Full CRO Audits (Technical, UX, Copy, Funnel)
- A/B Testing & Multivariate Testing
- Landing Page Design & Optimization
- Checkout Funnel Optimization
- eCommerce CRO
- Lead Generation Funnel Optimization
- CRO for Google Ads & Meta Ads Campaigns
Ready to turn your traffic into revenue? Visit ConversionXperts.com and book a free consultation today.