Average B2B Lead Conversion Rate: The Complete 2026 Guide
What Is a B2B Lead Conversion Rate and How Is It Calculated
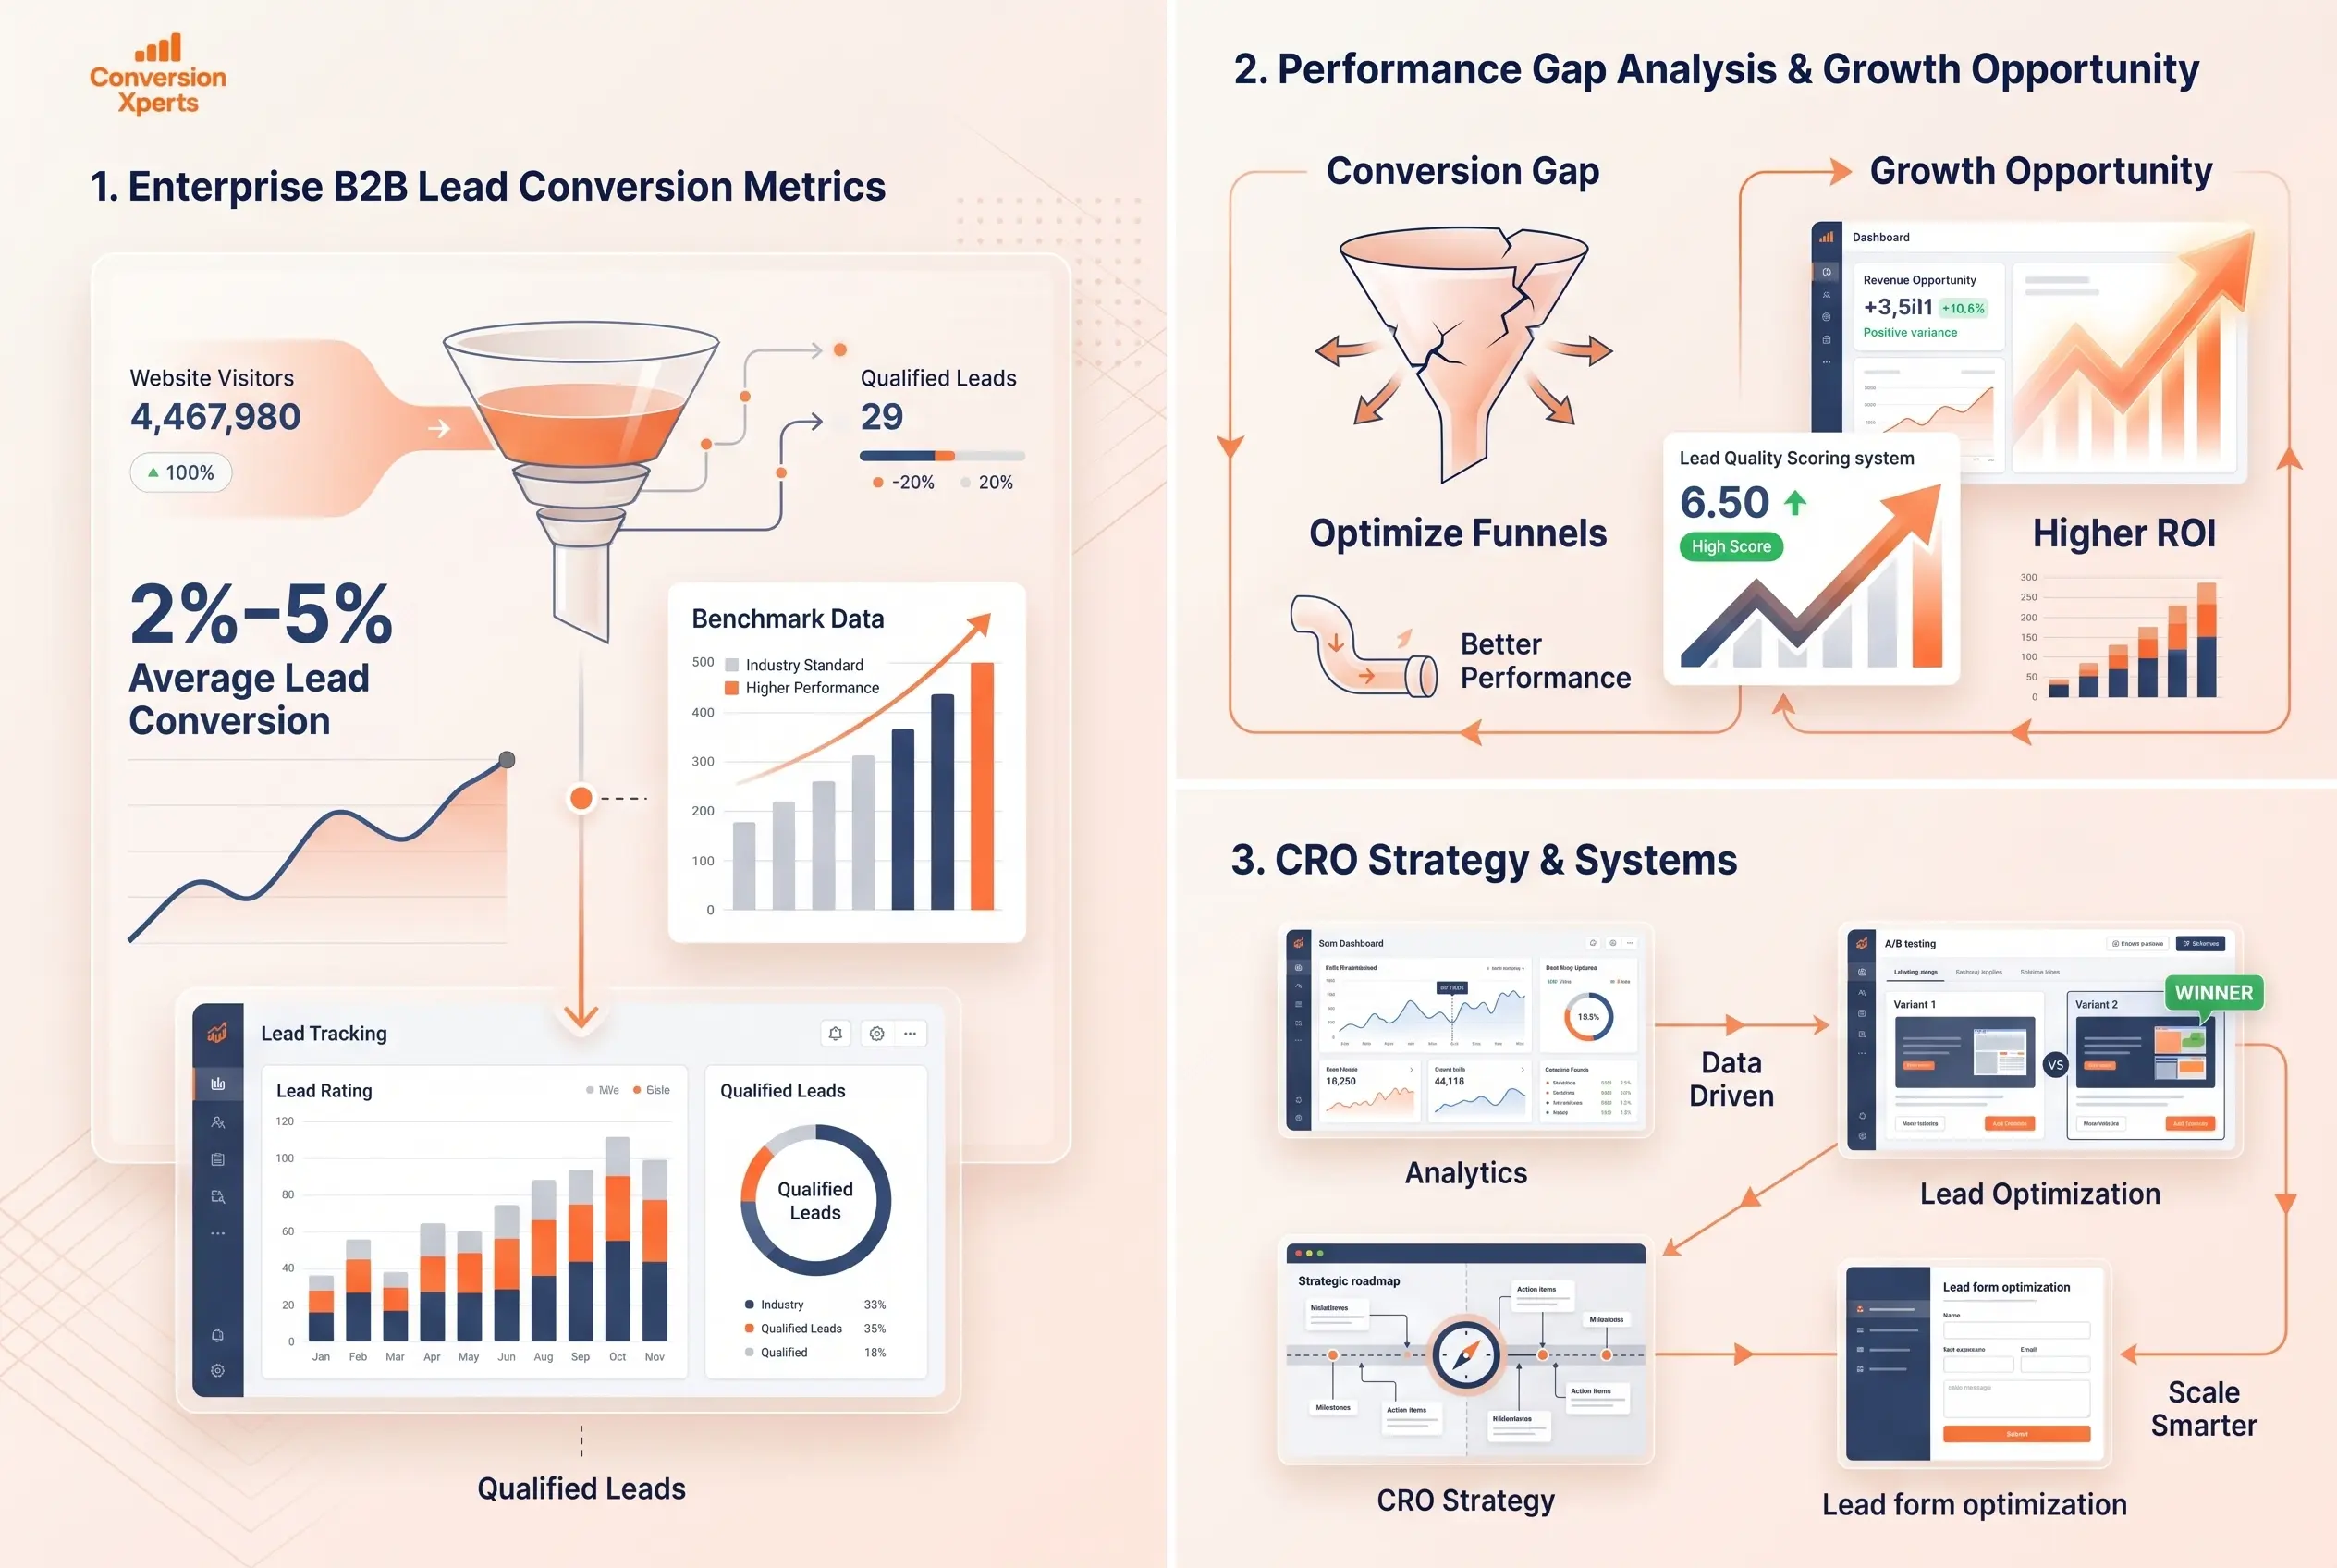
A B2B lead conversion rate measures the percentage of visitors or prospects who complete a desired action within your marketing or sales funnel. That action could be filling out a contact form, downloading a lead magnet, booking a demo, starting a free trial, or becoming a paying customer.
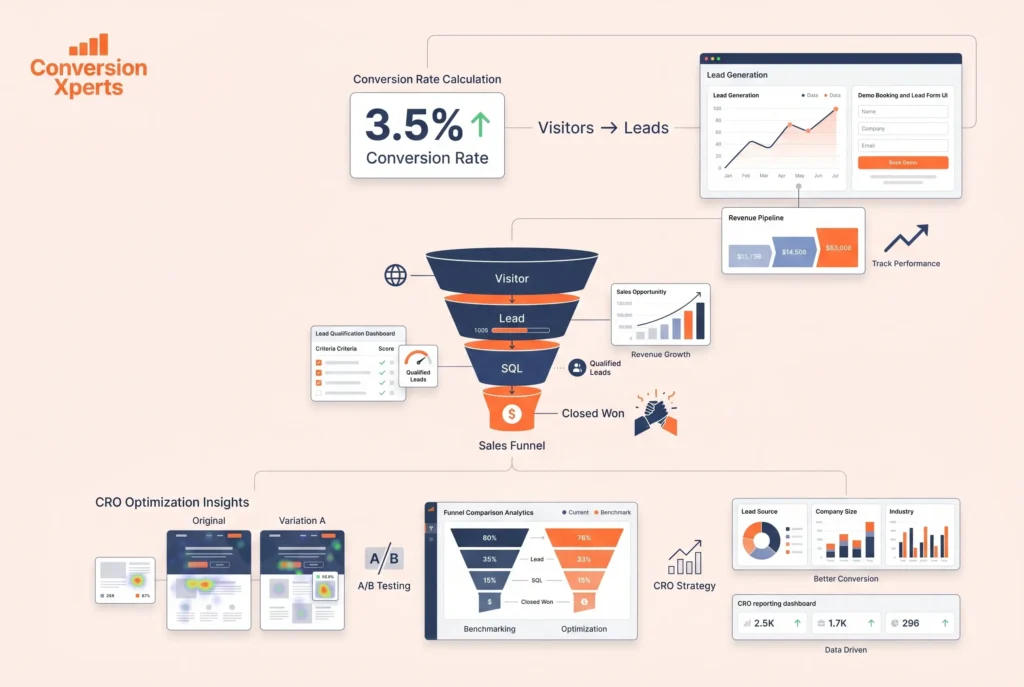
The formula is straightforward. You divide the number of conversions by the total number of visitors or leads in a given period, then multiply by 100 to get a percentage. If 1,000 people visit your pricing page and 35 of them request a demo, your conversion rate for that step is 3.5 percent.
Where things get complicated in B2B is that the funnel has multiple stages, and companies often measure conversion at different points. Some businesses count a conversion the moment someone fills in a form. Others only count a qualified sales opportunity. Others measure the final closed deal as the true conversion. None of these definitions is wrong, but they produce very different numbers, which is why benchmarking B2B conversion rates requires careful context.
The Three Most Common B2B Conversion Events
Visitor to Lead Conversion: This is the most commonly tracked metric. It measures what percentage of website visitors take any lead generation action, such as downloading content, requesting a quote, or signing up for a webinar. Industry averages for this stage typically range from 1 to 5 percent according to multiple studies including the 2024 Unbounce Conversion Benchmark Report.
Lead to Sales Qualified Lead Conversion: After a raw lead enters your system, the next gate is qualification. Not every lead is worth pursuing. The average lead to SQL conversion rate in B2B is approximately 13 percent according to research published by Salesforce in 2024, though top performing organisations achieve rates closer to 25 percent.
SQL to Closed Won Conversion: This is where revenue is made or lost. The average B2B close rate from SQL to customer is typically between 20 and 30 percent, with significant variation by deal size, sales cycle length, and industry vertical.
Why You Need to Know Which Stage You Are Measuring
Many businesses make the mistake of benchmarking their visitor to lead rate against a competitor’s SQL to close rate without realising the comparison is meaningless. Before you can accurately assess your conversion performance, you need to define clearly which stage of the funnel you are measuring and ensure you are comparing like for like when looking at industry data.
This distinction also matters enormously for CRO work. Optimising landing pages to improve visitor to lead rates is a completely different discipline from optimising sales call structure to improve close rates. Each stage has its own levers, and understanding which one you are pulling changes everything about how you prioritise your efforts.
Average B2B Lead Conversion Rate by Industry
The average B2B lead conversion rate varies dramatically depending on the sector your business operates in. A technology company selling enterprise software faces a completely different buyer journey than a logistics firm offering freight management services, and their conversion benchmarks reflect that difference.
According to data from WordStream’s 2024 Industry Benchmarks report and First Page Sage’s 2024 B2B conversion study, here is how average conversion rates break down across major B2B industries.
B2B Industry Conversion Rate Benchmarks
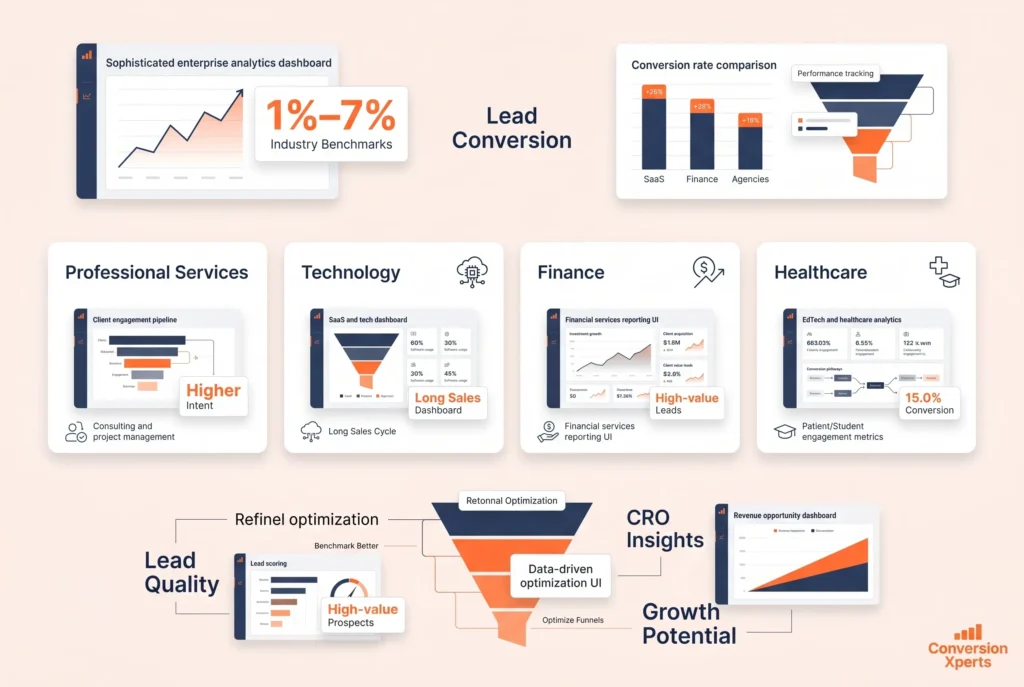
Technology and SaaS companies typically convert between 1.8 and 3.5 percent of website visitors into leads. The complexity of the product and the length of the evaluation process tends to suppress top of funnel conversion rates, but the average lead quality is often higher than in industries with faster purchase decisions.
Professional services including legal, accounting, consulting, and HR firms typically see conversion rates between 3 and 5 percent. The personal nature of these services and the trust required to engage a provider means that users who do convert tend to be highly motivated.
Financial services and insurance companies have some of the most variable conversion rates in the B2B space, ranging from 2 to 7 percent depending heavily on whether the offer is informational or transactional. Companies offering a clear, tangible first step such as a free assessment or benchmarking tool tend to outperform those relying on generic contact forms.
Manufacturing and industrial companies typically see lower conversion rates in the 1 to 2.5 percent range due to longer buying cycles, multiple decision makers, and the technical complexity of their offerings. However, lead quality at this stage is often extremely high because users who do enquire are typically deep in the evaluation process.
Marketing and advertising agencies tend to perform well relative to other B2B categories, with average conversion rates between 4 and 6 percent. This is partly because agencies are typically skilled at conversion themselves and apply that expertise to their own websites.
Healthcare B2B, including medical devices, health tech, and pharmaceutical distribution, typically converts between 2 and 4 percent. Compliance requirements and lengthy procurement processes create friction that limits top of funnel rates but increases lead seriousness.
Education technology and corporate training companies typically see conversion rates between 2.5 and 4.5 percent, with free trial or demo offers significantly outperforming contact form only approaches.
Industry Conversion Rate Comparison Table
Industry | Average Visitor to Lead Rate | Average Lead to SQL Rate | Notes
Professional Services | 3 to 5 percent | 15 to 20 percent | High trust requirement, strong content converts well
Technology and SaaS | 1.8 to 3.5 percent | 12 to 18 percent | Free trial offers improve top of funnel significantly
Marketing and Advertising | 4 to 6 percent | 18 to 25 percent | Agencies apply CRO expertise to own sites
Financial Services | 2 to 7 percent | 10 to 20 percent | Wide range driven by offer type
Manufacturing and Industrial | 1 to 2.5 percent | 20 to 30 percent | Low volume but high intent leads
Healthcare B2B | 2 to 4 percent | 14 to 20 percent | Compliance creates friction
EdTech and Training | 2.5 to 4.5 percent | 16 to 22 percent | Free access offers drive volume
Sources: WordStream Industry Benchmarks 2024, First Page Sage B2B Conversion Data 2024, Salesforce State of Sales 2024
What These Numbers Actually Mean for Your Business
If you are in technology and your website converts at 1.2 percent, you are below average but not critically so. If you are a professional services firm converting at 1.5 percent, you are leaving a significant amount of revenue on the table because your industry peers are achieving two to three times that rate. Context is everything when reading benchmark data, and your goal should not be to hit an industry average but to understand why you are above or below it and use that understanding to set a realistic improvement target.
Average B2B Conversion Rate by Channel and Traffic Source
Where your leads come from matters at least as much as how many arrive. The average B2B conversion rate varies enormously by traffic source, and understanding these differences can fundamentally reshape how you allocate your marketing budget.
According to HubSpot’s State of Marketing 2024 report and data from Demand Gen Report’s B2B Buyer Survey, organic search, email marketing, and referral traffic consistently outperform paid and social channels when it comes to B2B lead conversion rates.
Organic Search and SEO
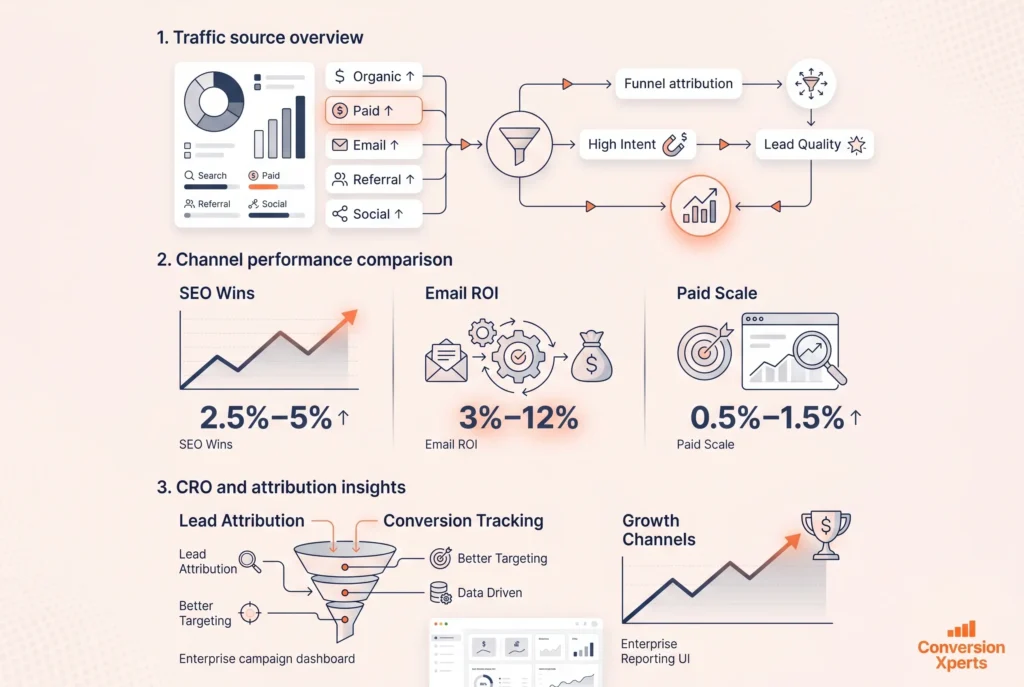
Organic search traffic converts at between 2.5 and 5 percent on average for B2B websites. This high conversion rate relative to other channels is explained by intent. Users arriving from organic search are actively seeking a solution to a problem. They have typed a specific query, evaluated the results, and chosen to visit your page. That context primes them to engage far more readily than someone served an ad while scrolling through a social feed.
The investment required to rank for competitive B2B keywords is substantial, but the return on that investment in terms of conversion quality is consistently strong. According to First Page Sage’s 2024 organic search study, B2B companies that reach the first page for commercial intent keywords see average conversion rates 40 percent higher than the same company’s paid search performance.
Paid Search and Google Ads
Paid search converts at between 1.5 and 3.5 percent on average for B2B campaigns, according to WordStream’s 2024 benchmarks. The gap between paid and organic is explained by several factors. Users sometimes distrust ads, particularly sophisticated B2B buyers who are research oriented. Landing page quality for paid campaigns can be inconsistent. And many paid B2B campaigns target broad awareness keywords rather than high intent commercial queries, which dilutes conversion rates significantly.
Paid search can and does perform extremely well when campaigns are tightly structured around bottom of funnel intent keywords and supported by purpose built landing pages that are optimised for conversion. When those conditions are met, the volume advantage of paid search can make it the single highest converting channel in absolute lead numbers, even if the percentage rate is slightly lower than organic.
Email Marketing
Email marketing consistently delivers some of the highest B2B conversion rates of any channel. According to Campaign Monitor’s 2024 Email Marketing Benchmarks report, B2B email campaigns converting recipients to leads average between 3 and 5 percent, while email sequences nurturing existing leads toward a sales conversation can achieve conversion rates of 8 to 12 percent in well managed programmes.
The reason email performs so well is relationship context. The recipient has already raised their hand by subscribing, downloading something, or engaging with your brand previously. The conversion barrier is dramatically lower than it is for cold traffic, and personalisation at scale can make email feel far more relevant than any other channel at comparable cost.
Referral Traffic and Partner Sources
Referral traffic from trusted third party sources, including industry publications, partner websites, review platforms like G2 or Capterra, and case study features, tends to convert at 3.5 to 6 percent. The trust transfer from a recognised third party source to your brand is powerful. When someone arrives on your website because they read about you in a credible industry publication or saw your customer reviews on a software review platform, they arrive with a level of pre established confidence that cold traffic simply does not have.
This is one of the most underestimated conversion drivers in B2B lead generation. Building a deliberate referral and partner programme is one of the highest return CRO investments many B2B companies can make.
Social Media
Social media traffic typically converts the lowest of any channel in B2B, with average conversion rates between 0.5 and 1.5 percent. LinkedIn outperforms other social platforms for B2B by a significant margin, and LinkedIn paid campaigns targeting specific job titles or company types can achieve rates comparable to paid search when the targeting is precise and the landing experience is relevant.
However, the primary value of social media for B2B lead generation is often less about direct conversion and more about audience warming, brand awareness, and retargeting pool building that supports conversion on other channels.
Channel Conversion Rate Comparison Table
Channel | Average B2B Conversion Rate | Strength | Limitation
Organic Search | 2.5 to 5 percent | High intent, sustainable | Requires significant time investment
Email Marketing | 3 to 12 percent depending on list stage | Relationship context, personalisation | Requires list building infrastructure
Referral and Partners | 3.5 to 6 percent | Trust transfer, high intent | Dependent on third party relationships
Paid Search | 1.5 to 3.5 percent | Scalable volume, fast | Cost, ad blindness
Social Media | 0.5 to 1.5 percent | Awareness, retargeting pool | Low direct conversion intent
Sources: HubSpot State of Marketing 2024, WordStream Paid Search Benchmarks 2024, Campaign Monitor Email Benchmarks 2024
Why Most B2B Conversion Rates Are Lower Than They Should Be
Understanding why B2B conversion rates underperform is just as important as knowing what the benchmarks are. In our experience working with B2B companies across technology, professional services, and manufacturing, the same patterns of underperformance appear again and again.
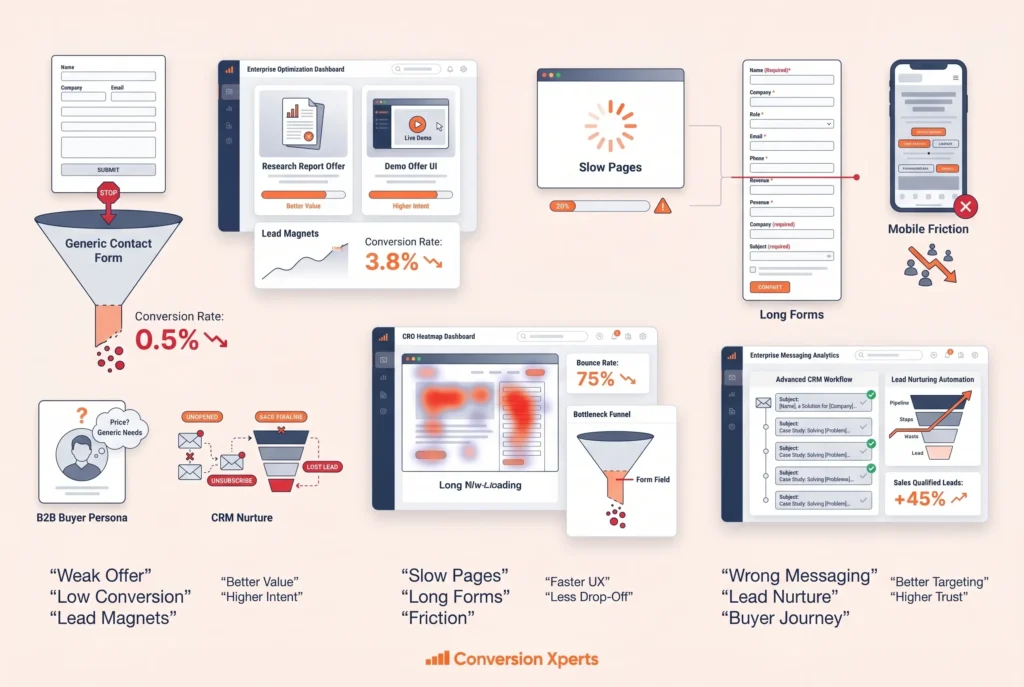
The Offer Is Not Compelling Enough
The single biggest driver of poor B2B conversion rates is an offer that does not create sufficient urgency or deliver sufficient perceived value to justify the friction of submitting a form. Too many B2B websites rely on a generic contact us form as their primary conversion mechanism. This is asking a visitor who may still be in early research mode to commit to a sales conversation they are not ready to have.
The most effective B2B conversion offers meet prospects at their current stage of the buyer journey. In the awareness stage, high value content such as a research report, benchmarking tool, or diagnostic assessment can convert users at rates two to three times higher than a standard contact form. In the consideration stage, a product demo, case study access, or comparison guide matched to specific pain points moves leads further down the funnel with significantly less friction.
According to Demand Gen Report’s 2024 B2B Content Preferences Survey, 76 percent of B2B buyers are willing to share contact information in exchange for a research report, while only 37 percent will complete a contact form for a generic inquiry. The offer type alone can double or triple your conversion rate without any other changes to your website.
The Landing Page Experience Creates Friction
Even with a compelling offer, a poor landing page experience will suppress conversion rates significantly. The most common landing page problems in B2B include slow load times, unclear value propositions, mismatched messaging between the ad or content that brought the user to the page and the page itself, excessive form fields, and a lack of credibility signals such as testimonials, case study references, or trust badges.
According to Google’s 2024 PageSpeed research, pages that load in under two seconds convert at a rate 50 percent higher on mobile devices than pages taking five seconds or more to load. For B2B companies still running outdated websites on slow hosting infrastructure, page speed alone can represent a significant conversion opportunity.
Form length is another major friction point. The 2024 Formstack B2B Form Conversion study found that forms with three to five fields convert at an average rate 160 percent higher than forms with more than ten fields. The instinct to capture every possible piece of qualifying data upfront costs far more in lost leads than the information is worth.
Messaging Does Not Address the Real Buyer
Many B2B websites write for a generalised audience rather than the specific person making the buying decision. When a VP of Operations visits your website looking for a solution to a supply chain problem and finds messaging that talks about your product features rather than the operational outcomes it delivers, the connection fails. The visitor does not see themselves in your story and they leave.
Effective B2B conversion messaging speaks directly to the role, the specific pain, and the desired outcome of the buyer persona you are targeting. It uses language that mirrors how your best customers describe their problems, not how your engineering team describes your solution. This distinction seems obvious but it is absent from a significant proportion of B2B websites, and it is consistently one of the highest return improvements available in CRO work.
The Nurture Process Is Too Slow or Too Aggressive
B2B sales cycles are long. According to Gartner’s 2024 B2B Buying Report, the average B2B purchase decision involves 6 to 10 stakeholders and takes between 3 and 12 months to complete. This means that the vast majority of leads who convert at the top of your funnel are not ready to buy immediately. How you handle them in the weeks and months after that initial conversion determines whether they eventually become customers.
Companies that treat every new lead as an immediate sales opportunity tend to burn through their lead database with premature outreach that pushes prospects away before the relationship is established. Companies that have no nurture process at all lose leads to competitors who stay in touch more consistently. The optimal approach combines timely, value driven nurture content with behavioural signals that indicate when a lead is ready for a sales conversation.
How to Improve Your B2B Lead Conversion Rate With CRO
Conversion rate optimisation in B2B is the systematic process of identifying and removing barriers that prevent prospects from taking the next step in your funnel. It is evidence based, iterative, and measurable. Done well, CRO can double or triple your lead volume from the same traffic, making it the highest return investment available in most B2B marketing programmes.
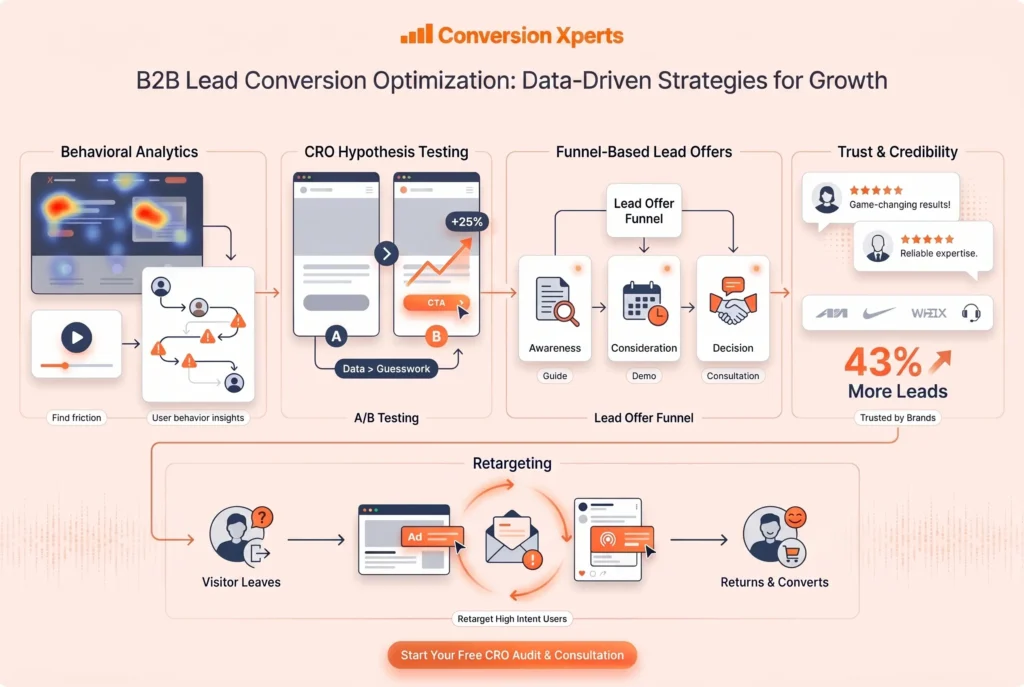
Start With Behavioral Analytics to Find the Real Problems
Before changing anything on your website, you need to understand how users actually behave on it. This is where tools like session recording and heatmap analysis become essential. Watching real users navigate your website reveals friction that standard analytics cannot show you. You can see where users pause, where they click on non clickable elements, how far they scroll before leaving, and at what point in a form they abandon.
Heatmap data shows you which content receives attention and which is ignored. Funnel analytics show you precisely where prospects drop out of multi step processes. Form analytics reveal which specific fields cause the most abandonment. This behavioral data is the foundation of every high confidence CRO decision.
Many B2B companies skip this step and jump straight to guessing about what might be wrong. The result is time and development resource spent on changes that do not move the needle because they are solving the wrong problems. Investment in behavioral analytics consistently pays for itself by directing optimisation effort toward the issues that actually matter.
Build and Test Specific Hypotheses
CRO that works is built on specific, testable hypotheses rather than opinions about what looks better or what felt right in a brainstorm. A proper CRO hypothesis follows a structured format. You identify a specific element or experience, the change you want to test, the user behaviour or problem that motivates the test, and the specific outcome you expect to see if the hypothesis is correct.
For example: changing the primary CTA on the pricing page from Contact Us to Get Your Free Strategy Call will increase demo requests by 15 percent because our session recordings show users leaving the page without clicking the current CTA, suggesting the current offer lacks sufficient perceived value or clarity.
That hypothesis is specific, measurable, motivated by evidence, and tied to a clear outcome. It tells you what to test, why you are testing it, and how you will know if the test succeeded. This structure is what separates CRO programmes that consistently improve conversion rates from random testing that produces noise.
Optimise Your Lead Capture Offers by Funnel Stage
As discussed earlier in this guide, offer type is one of the most powerful levers available in B2B conversion rate optimisation. Moving beyond a single generic contact form to a multi stage offer architecture matched to different buyer journey stages can produce significant conversion improvements.
For users in the awareness stage who are researching a problem, the most effective B2B lead generation offers include original research reports and industry benchmark data, diagnostic tools or self assessment quizzes, educational webinars or video series, and detailed how to guides that solve a specific practical problem.
For users in the consideration stage who are evaluating solutions, the highest converting offers include interactive product demos or guided tours, detailed case studies featuring customers in the same industry or with the same problem type, comparison guides that help the prospect evaluate their options, and free audits or assessments that deliver personalised insight.
For users at the decision stage who are ready to choose a provider, the most effective offers are direct consultation calls, custom proposals, pilot programmes or proof of concept engagements, and ROI calculators that quantify the value of choosing your solution.
Each of these offer types addresses a specific stage of intent. Aligning your offer to where your prospect actually is in their journey removes the friction that generic contact forms create and dramatically increases the probability that the prospect will convert.
Improve Landing Page Credibility and Trust
B2B buyers are risk averse. The higher the deal size, the more evidence they need before they are willing to take a step forward. Adding credibility signals to your landing pages is one of the fastest ways to improve conversion rates without changing your core message or offer.
The most effective credibility signals in B2B include specific client testimonials that name the company, the person, their role, and the concrete outcome they achieved. Generic praise is far less persuasive than a testimonial that says a specific revenue figure was generated or a specific time saving was realised. Case study results presented in specific numerical terms such as 43 percent increase in qualified leads or two million dollars in pipeline generated in the first quarter are more believable and more persuasive than rounded figures or vague outcome descriptions.
Trust indicators such as recognisable client logos, industry awards, certifications, media mentions, and third party review platform ratings all contribute to the credibility assessment a new visitor makes in the first seconds of arriving on your page. Investing in assembling and prominently displaying these signals pays consistent dividends in conversion rate improvement.
Use Retargeting to Bring Back High Intent Visitors
The reality of B2B buying behaviour is that most qualified prospects will visit your website multiple times before converting. Research from Google’s B2B Micro Moments study found that the average B2B buyer conducts 12 or more searches before engaging with a vendor’s website, and many visit competitor sites before returning.
Retargeting campaigns serve ads to users who have already visited specific pages on your website, allowing you to stay visible during their evaluation period and present increasingly specific, relevant offers as they move deeper into the funnel. A user who visited your pricing page but did not convert is a very different retargeting audience than a user who only visited your homepage. Segmenting retargeting audiences by the specific pages they visited and the implied intent of those pages allows you to serve content that matches their evaluation stage rather than generic brand awareness messaging.
Retargeting does not improve your site’s conversion rate directly, but it increases the total number of conversion opportunities from your existing traffic investment by ensuring that high intent visitors who did not convert on their first visit have a pathway back to your site at a moment when they may be more ready to take action.
How to Benchmark Your B2B Conversion Rate Accurately
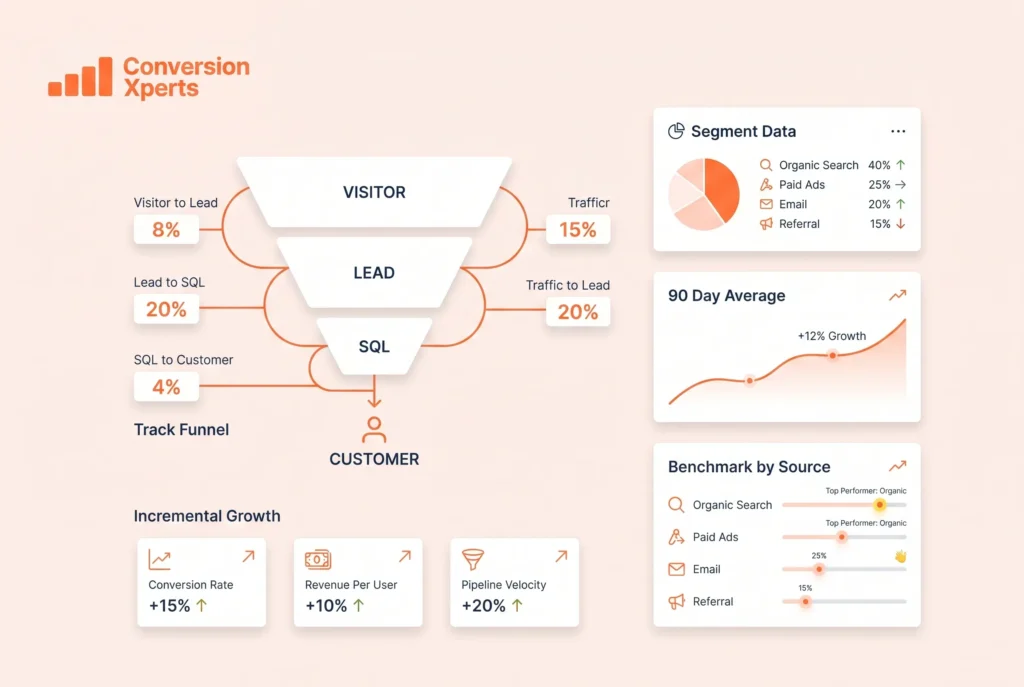
Knowing the industry averages is only useful if you can accurately compare your own performance against them. Many B2B companies benchmark incorrectly, leading to either false confidence or unnecessary alarm.
Define Your Conversion Events Before You Measure
The first step in accurate benchmarking is deciding precisely what counts as a conversion in your business. This sounds obvious but the lack of a clear definition is extremely common. Is a conversion when someone downloads a content piece, when they request a demo, when they book a discovery call, when they become an SQL, or when they sign a contract? Each of these events happens at a different stage and produces a very different rate.
For meaningful benchmarking, you need to define at least three conversion events corresponding to the three primary funnel stages and measure each separately. A visitor to lead conversion rate, a lead to sales qualified lead rate, and an SQL to close rate give you a complete picture of funnel performance and show you exactly which stage is underperforming relative to your industry benchmarks.
Segment Your Data by Traffic Source
Overall conversion rate averages are interesting but limited in their usefulness. A blended conversion rate that combines organic search, direct, paid, and social traffic tells you the aggregate result of very different visitor behaviours. To benchmark accurately, you need to segment conversion rates by traffic source and compare source specific rates against source specific benchmarks.
If your organic search traffic converts at 1.5 percent and your industry benchmark for organic is 3 percent, that is a clear signal that your landing page experience or your conversion offer needs work for that audience. If your email traffic converts at 8 percent and the benchmark is 4 percent, you have a high performing programme to double down on. Segmented data reveals the specific opportunities that blended averages hide.
Account for Seasonal and Cyclical Patterns
B2B purchasing has strong seasonality in many industries. Budget cycles, fiscal year planning, trade show seasons, and industry specific patterns all affect conversion rates in ways that have nothing to do with your marketing or CRO effectiveness. Measuring conversion rate over a single month and comparing it against an annual benchmark will often produce misleading conclusions.
Use rolling 90 day or quarterly averages for benchmarking purposes. This smooths out short term fluctuations and gives you a more reliable measure of underlying funnel performance that you can meaningfully compare against industry data which is typically reported on an annual basis.
Set Improvement Targets Based on Your Current Performance
Rather than targeting the industry average as your goal, set improvement targets as a percentage improvement on your current performance. If you currently convert at 1.5 percent and the industry average is 3 percent, setting a target of 3 percent may be appropriate, but the path there should be broken into incremental milestones. A 20 percent improvement from 1.5 to 1.8 percent is a realistic near term target. A 50 percent improvement to 2.25 percent over a six month CRO programme is ambitious but achievable with focused effort. Reaching the industry average over a twelve to eighteen month horizon is a reasonable strategic goal for most businesses starting below benchmark.