How to Boost Your Mobile App Conversions: A Step-by-Step Guide
What Is App Conversion Rate Optimization and Why Does It Matter in 2026?
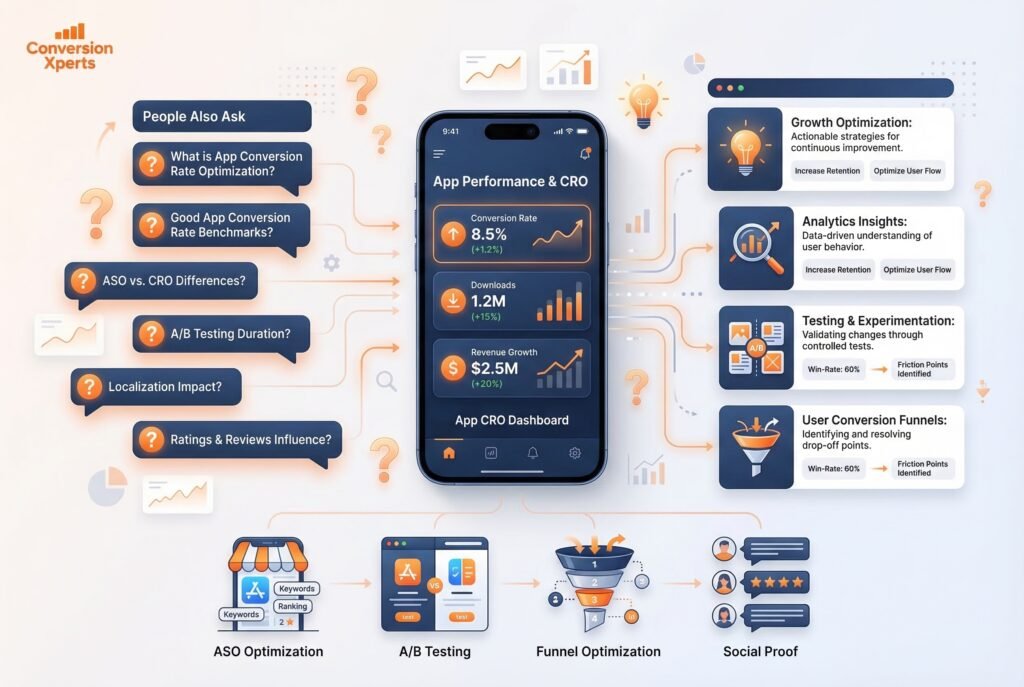
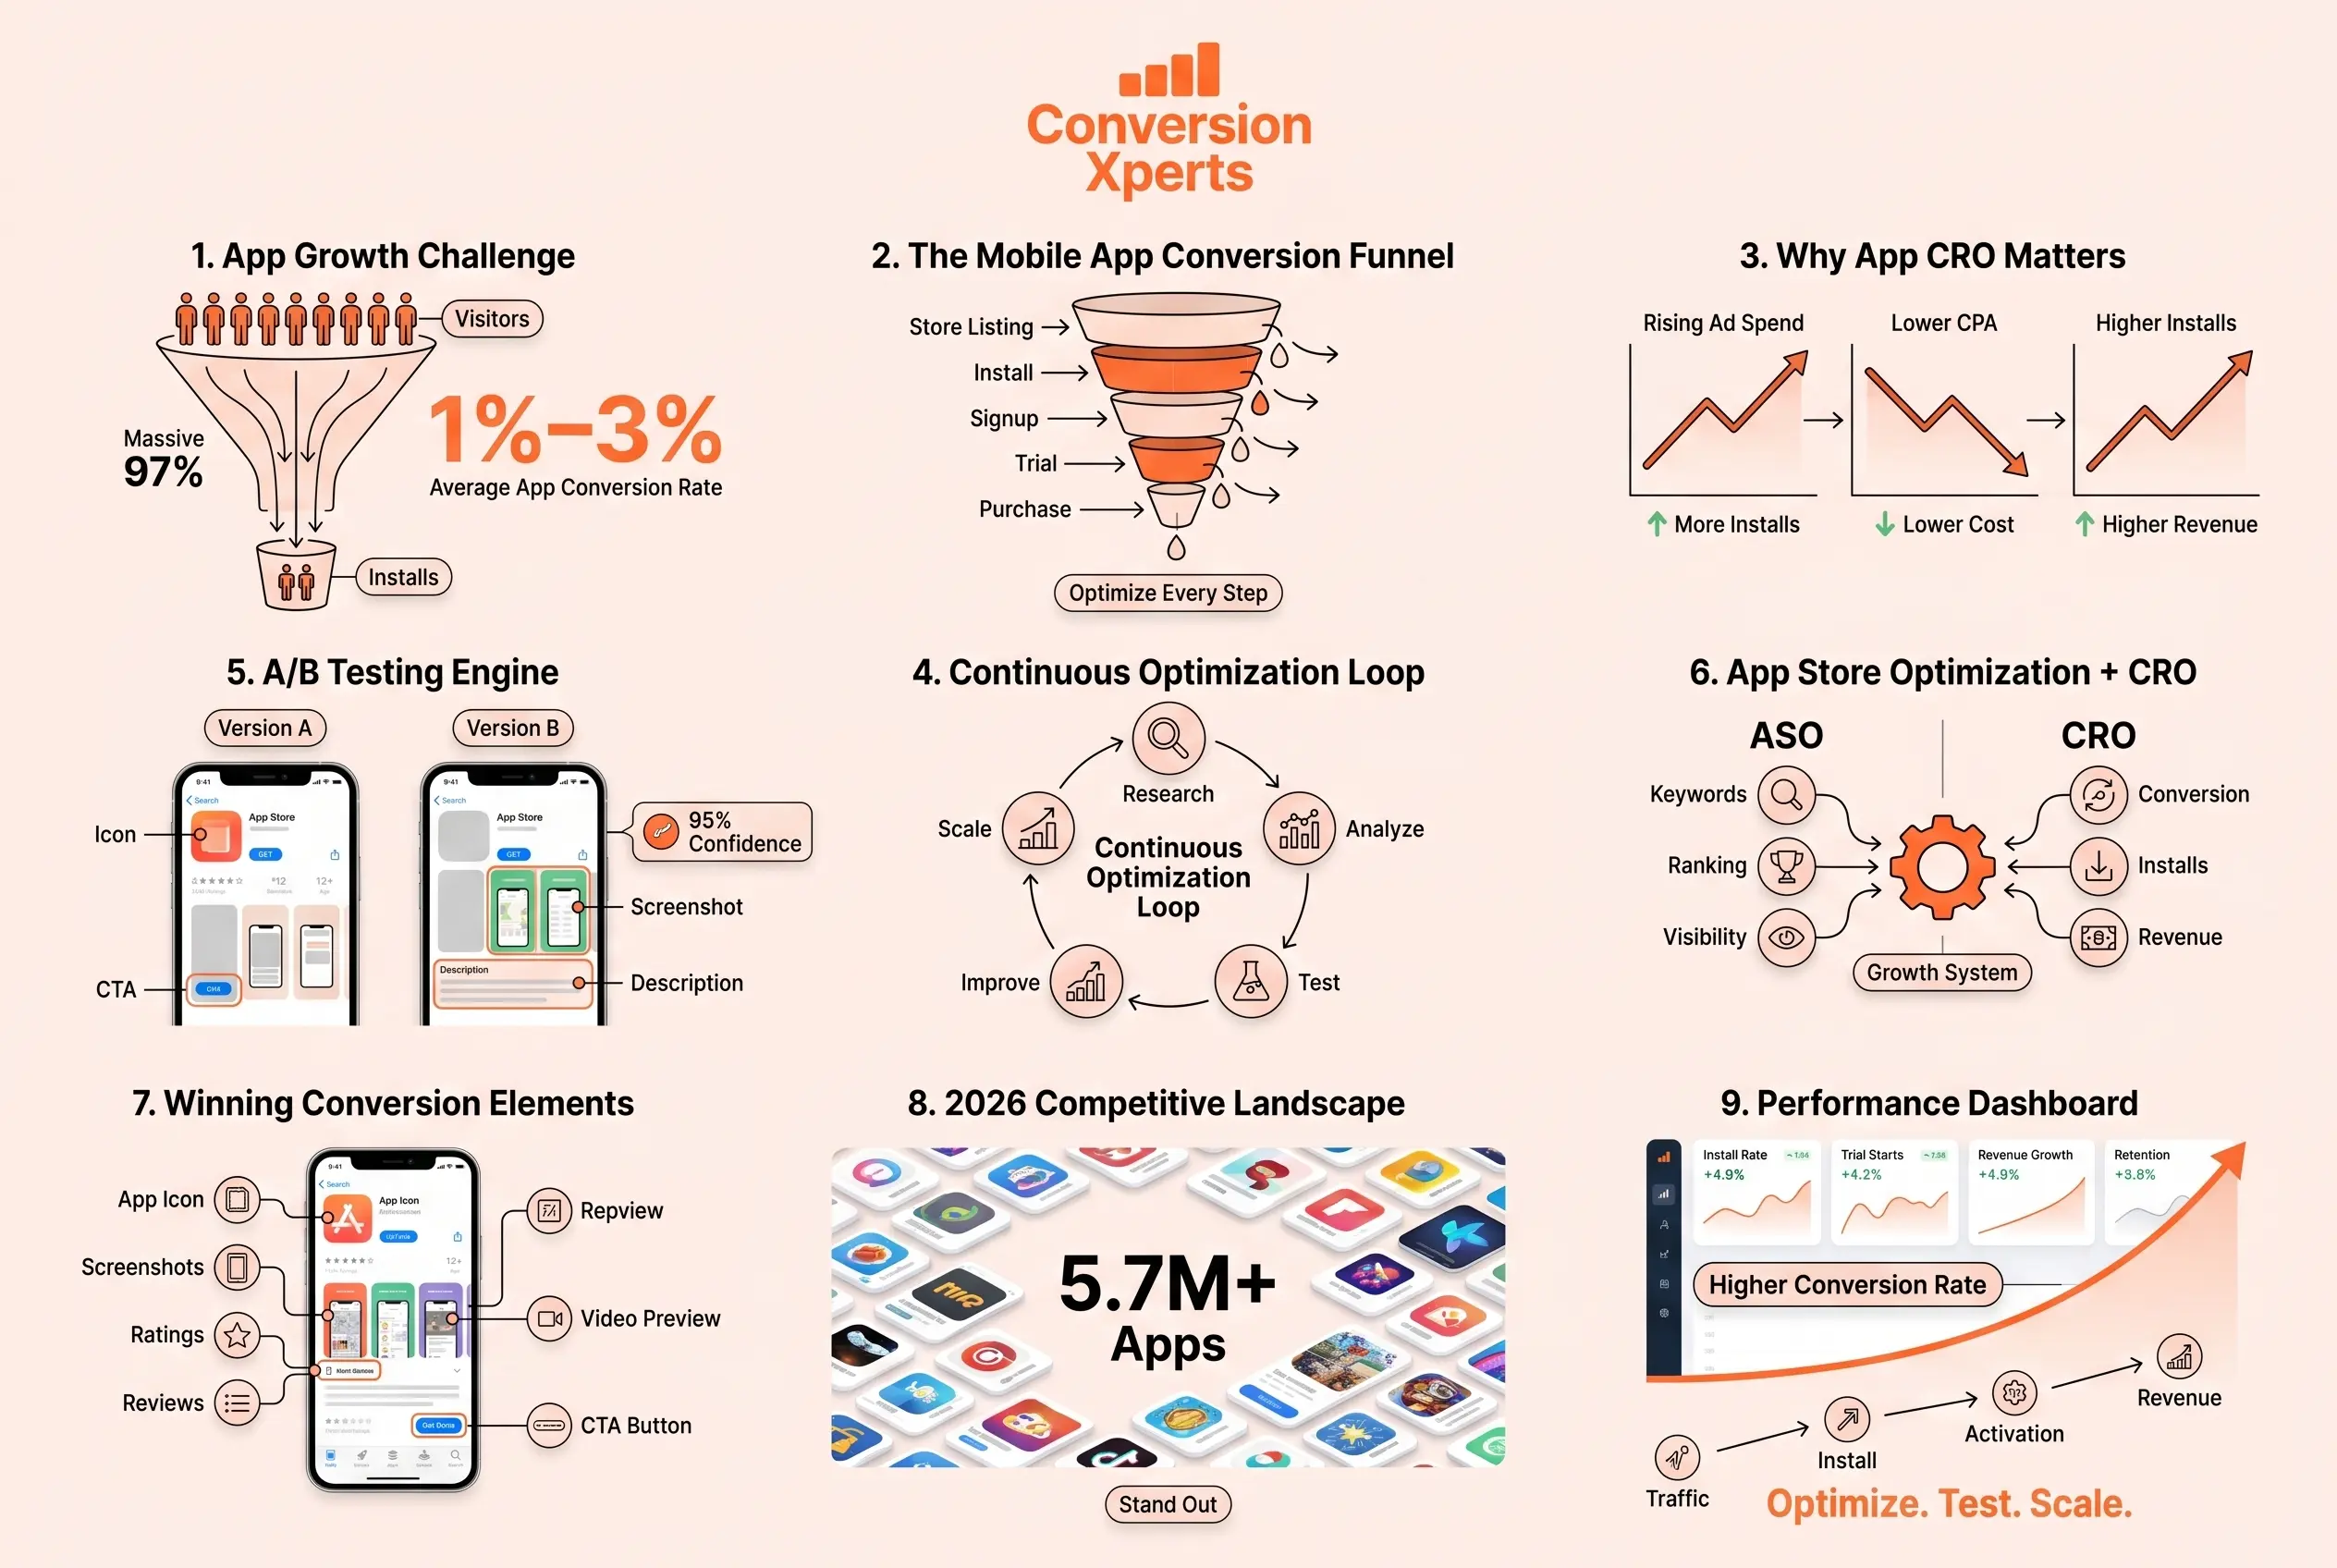
App conversion rate optimization (also called ACRO or mobile app CRO) is the practice of using data, testing, and creative strategy to increase the percentage of users who take a specific desired action from installing an app after viewing its store listing to making an in-app purchase after onboarding.
Unlike traditional website CRO, app CRO operates across two distinct battlegrounds: the app store product page (where the battle for downloads is won or lost) and the in-app experience (where installs are converted into paying customers). Most guides focus on one or the other. The most successful mobile growth teams treat them as one continuous funnel.
Why does this matter so urgently in 2026? Three reasons:
User acquisition costs are at historic highs. According to AppsFlyer’s 2025 State of App Marketing report, the average cost per install (CPI) for iOS apps globally reached $3.91 for non-gaming apps, with some categories like finance and health exceeding $8 per install. When traffic is this expensive, even a 1% improvement in your store listing conversion rate can save you tens of thousands of dollars monthly.
AI-powered search is reshaping discovery. Google’s AI Overviews, Apple’s enhanced search suggestions, and Perplexity’s app recommendations are changing how users find apps. Your store listing and content strategy now need to satisfy both algorithmic ranking signals and the conversational queries of AI search engines.
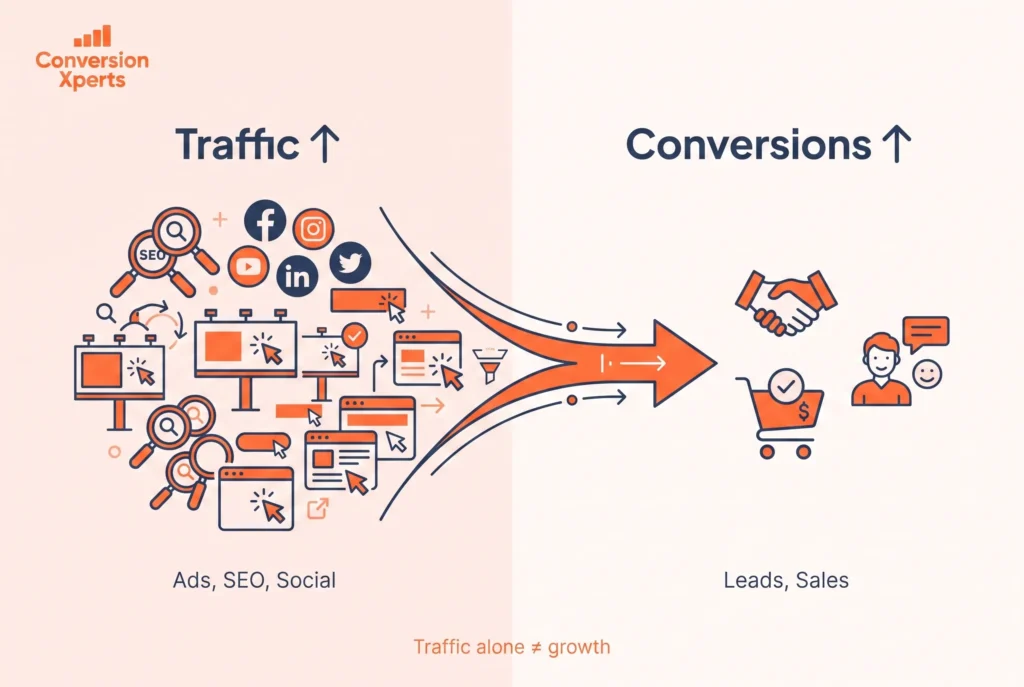
The long tail of the app stores is getting longer. More apps than ever are competing for the same keywords. Winning the install click now requires not just ranking — it requires persuading. That’s the job of conversion rate optimization.
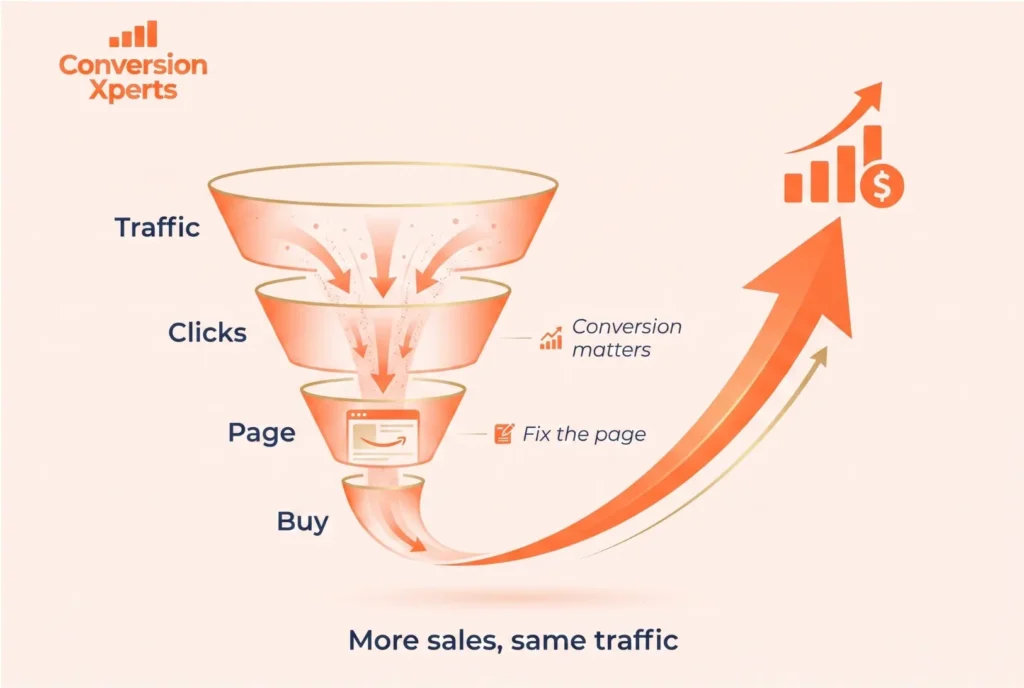
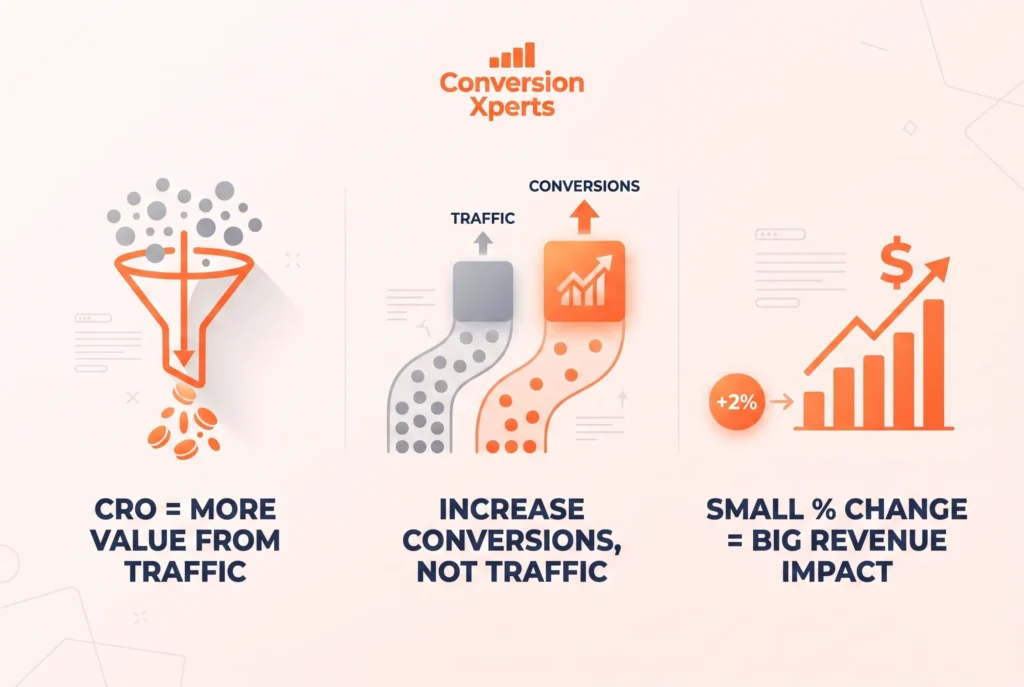
The core formula is simple: More conversions = more revenue from the same ad spend. A brand that increases its App Store conversion rate from 2% to 4% has effectively halved its cost per install without changing a single dollar of its media budget. This is why the world’s top app companies treat CRO as a core growth discipline, not an afterthought.
How App Install Conversion Rates Became the Most Important Metric in Mobile Growth
For years, mobile growth teams have been obsessed over impressions, click-through rates, and cost-per-install. Those metrics still matter — but they’re lagging indicators. App install conversion rates are the leading indicator that ties everything together. A high install conversion rate means your store listing is doing its job: turning curious browsers into committed users before a single dollar of in-app spend is deployed.
Consider the math: an app receiving 50,000 monthly store listing visitors with a 2% app conversion rate generates 1,000 installs. Improving that rate to 4% — without touching ad spend — doubles installs to 2,000. That’s the same media budget delivering twice the pipeline. No other single optimization lever in mobile growth delivers that kind of leverage this quickly. This is why app conversion optimization has moved from a nice-to-have to a non-negotiable growth function for every serious app team.
What Is a Good Conversion Rate for a Mobile App?
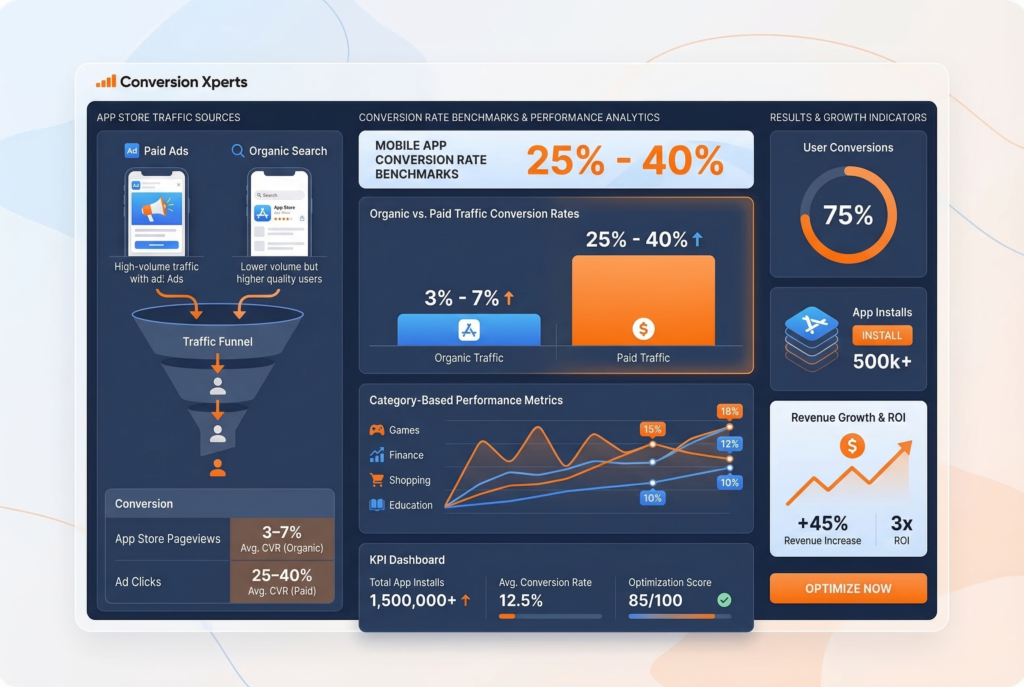
A good conversion rate for a mobile app depends on the platform, category, and traffic source — but as a general benchmark, a healthy App Store listing conversion rate (from store listing view to install) falls between 3% and 7% for paid traffic and between 25% and 40% for organic/branded traffic.
Here’s why that gap is so wide: users who search your brand name directly already have buying intent. Users arriving from paid ads are cold traffic seeing you for the first time. These two cohorts should never be measured together.
Industry Benchmark Breakdown by Category (2025 Data, AppTweak):
| App Category | Average Store Conversion Rate (Organic) | Average Store Conversion Rate (Paid) |
Games | 30–38% | 2–4% |
Health & Fitness | 28–35% | 1.5–3% |
Finance | 22–30% | 1–2.5% |
Education | 25–33% | 2–4% |
Shopping | 20–28% | 1.5–3.5% |
Productivity | 24–32% | 2–5% |
Entertainment | 32–40% | 3–6% |
The key metric you need to track inside Google Play Console is the “Store Listing Conversion Rate,” which Google defines as the ratio of store listing visitors to installers. Inside App Store Connect, Apple provides “Impressions to Downloads” and “Product Page Views to Downloads” as separate metrics — track both.
A practical rule of thumb: if your organic store conversion rate is below 20%, your product page has significant optimization headroom. If it’s below 10%, treat it as a conversion emergency.
In-app conversion rates (from install to paying subscriber or purchaser) vary even more dramatically — the industry median for apps with a freemium model is approximately 2–5% free-to-paid conversion within the first 30 days, according to RevenueCat’s 2025 State of Subscription Apps report. Top-quartile apps achieve 8–15% within the same window, largely through aggressive first-session paywall and onboarding optimization.
The Two Pillars of App CRO: Store Listing Optimization vs. In-App Conversion
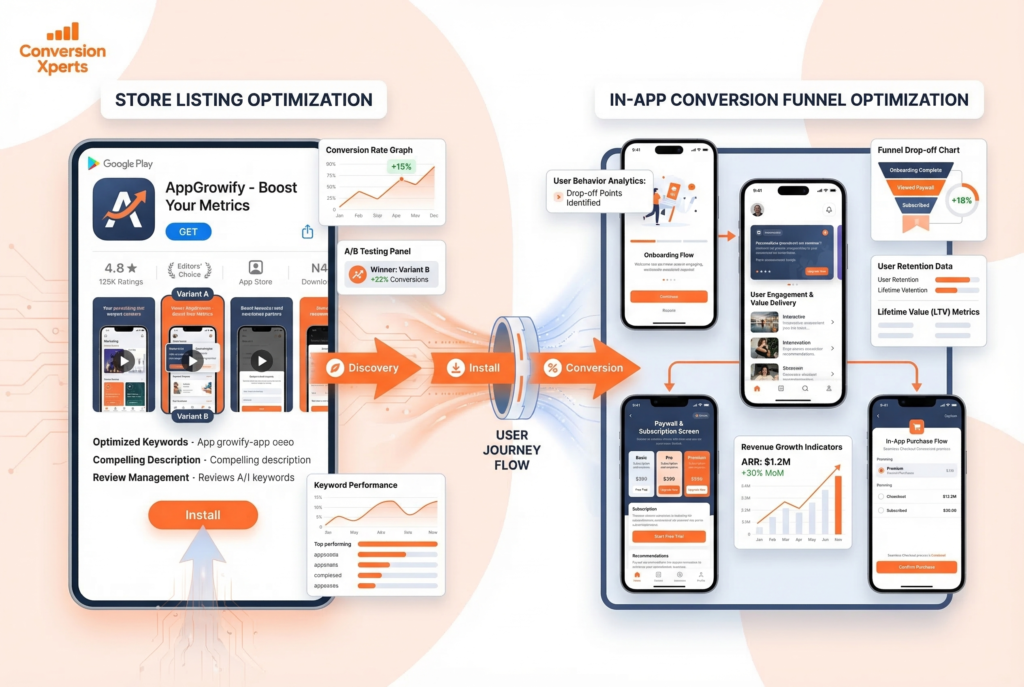
Understanding the full scope of mobile app CRO requires separating it into two interconnected but distinct optimization zones. Most teams make the mistake of focusing exclusively on one.
Pillar 1: Store Listing Acquisitions (Product Page Optimization)
Store listing acquisition is everything that happens before the install. This is your app’s product page the visual and textual “storefront” that convinces a browsing user to tap “Get” or “Install.” The components under your control include:
- App icon design
- App title and subtitle
- Short and long descriptions
- Screenshots (order, design, captions, orientation)
- Preview videos / app preview trailers
- Feature graphic (Google Play)
- Ratings and review display
- Category selection
- In-App Events (iOS) and Promotional Content (Google Play)
Every single one of these elements is a conversion lever. Changing just your first screenshot has been shown to move conversion rates by 15–30% in controlled tests, according to SplitMetrics’ 2024 A/B testing benchmark data.
Pillar 2: In-App Conversion Funnel Optimization
Once a user has installed, the in-app CRO battle begins. This is where you convert a free installer into an engaged, paying user. Key touchpoints include:
- First-Time User Experience (FTUE) and onboarding flow
- Paywall design, placement, and copy
- Call-to-action (CTA) button optimization
- Trial-to-paid conversion sequences
- Push notification permission prompts
- In-app purchase flow and checkout UX
- Re-engagement and churn reduction sequences
According to Paddle’s research, approximately 60% of app purchases occur during the user’s very first session. This single statistic should completely reframe how you think about your onboarding. The first three screens aren’t just “setup” they’re your highest-leverage sales pitch.
The most sophisticated app growth teams operate both pillars simultaneously, running store listing A/B tests through Google Play Experiments or Apple’s Product Page Optimization while simultaneously running in-app paywall tests through tools like RevenueCat and Purchasely.
How to Optimize Your App Store Listing for Maximum ASO Conversion Rate
Your app store listing is a silent sales page. It has roughly 3–7 seconds to communicate value before a user bounces. Here’s how to make every element work harder.
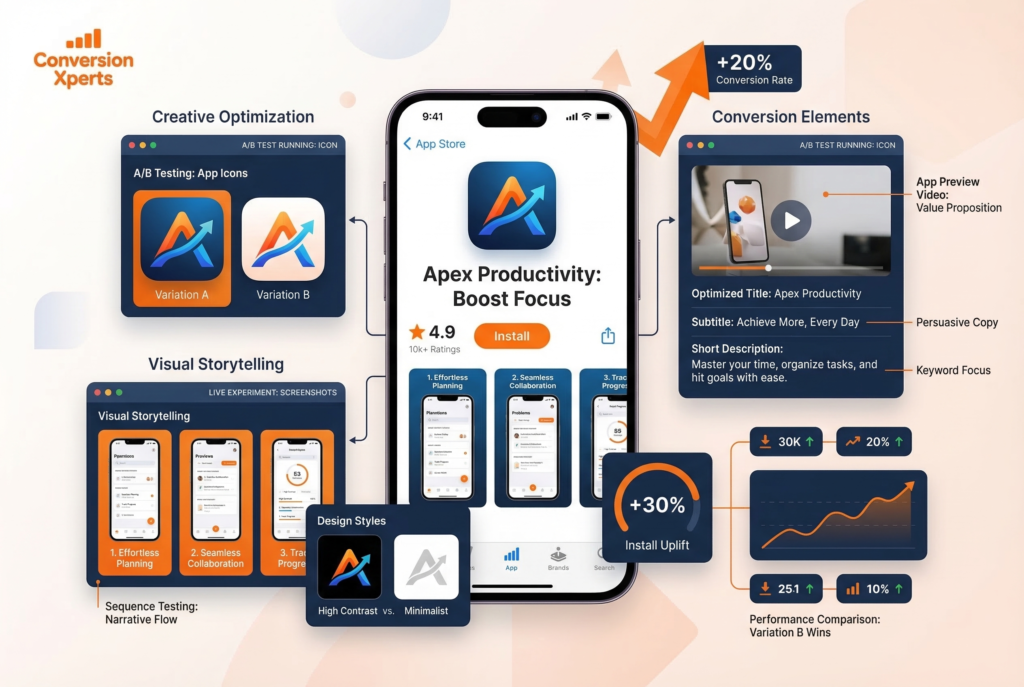
App Icon Design: Your Highest-Leverage Creative Asset
Your app icon is the first visual impression users get in search results, in the Top Charts, in editorial features, and on the home screen after install. It’s also one of the most impactful creative elements you can test.
The best-performing icons in 2026 share several characteristics. They use a single dominant visual element (not a logo, a character, or an abstract shape that communicates what the app does at a glance). They use high-contrast color combinations that stand out against both light and dark backgrounds. They avoid text, which becomes illegible at small sizes.
SplitMetrics’ 2024 Creative Benchmark Report found that icon A/B tests produce conversion rate lifts of 8–24% more frequently than any other store listing element. If you haven’t tested your icon in the last six months, start there.
Practical icon testing framework:
- Test at least 3 variants simultaneously
- Run each test for a minimum of 7 days or 1,000 impressions per variant (whichever comes first)
- Test one variable at a time: color scheme, character vs. abstract, with text vs. without text
- Validate winners with a second test using the top-performing variant against a new challenger
Screenshot Strategy: Tell a Story, Not a Feature List
Most app screenshots commit the same sin: they show the app interface with a caption that names the feature. Users don’t buy features. They buy outcomes.
The highest-converting screenshot sequences follow a narrative arc. The first screenshot (the one visible in search results without tapping) must communicate your core value proposition in under two seconds. The second through fifth screenshots deepen the narrative, addressing objections and showcasing specific benefits. The final screenshot should feature social proof — a star rating callout, press mention, or user testimonial.
Key screenshot optimization principles backed by 2025 SplitMetrics benchmark data:
Portrait vs. Landscape: For non-gaming apps, portrait screenshots (showing the phone in natural hand-held orientation) consistently outperform landscape on mobile-browsing users. Landscape can work for gaming apps where the game is played horizontally.
Caption placement: Testing has shown that short, benefit-focused captions in 18–22pt bold text at the top of the screenshot outperform captions at the bottom for most categories. This is because users scan top-down.
Background color: Screenshots with a branded, solid-color background (rather than a plain white or device mockup background) tend to perform better because they appear more professional and stand out more in search results.
Number of screenshots shown: On iPhone, the App Store shows the first 3 screenshots in search results before the user must tap “See All.” Treat screenshots 1–3 as your most critical real estate. On Google Play, the feature graphic and first 2 screenshots appear in search.
App Preview Videos and Their Conversion Impact
App preview videos (iOS) and promo videos (Google Play) can dramatically increase conversion — or dramatically decrease it if done poorly.
The data is nuanced. According to StoreMaven’s research, video autoplay on the App Store increases scroll depth but can either help or hurt conversion depending on video quality and relevance. A well-produced, benefit-led 15–20 second video showing the app’s core value loop tends to lift conversions by 20–35%. A corporate-style or feature-walkthrough video can suppress conversions by making the app look complex.
Video optimization rules:
- Lead with the outcome in the first 3 seconds (hook immediately)
- Show real in-app footage, not animations or marketing graphics
- Include captions most users browse with sound off
- Keep it to 15–30 seconds; attention drops sharply after 20 seconds
- Test video vs. no video as your first experiment, then iterate
App Title, Subtitle, and Description: Balancing ASO and Conversion
Your app title and subtitle serve dual purposes: keyword ranking (ASO) and conversion persuasion. Most developers optimize aggressively for keywords and neglect the persuasion side entirely.
A high-converting title formula: [Brand Name] – [Core Benefit Statement]. For example, “Headspace: Meditation & Sleep” is effective because it combines brand recognition with a clear dual-benefit signal.
The subtitle (iOS, 30 characters) is prime conversion real estate. Many developers waste it on a second keyword string. Instead, treat it as your value proposition tagline. “30-day free trial, cancel anytime” in the subtitle has been shown to lift conversion for subscription apps by communicating low-risk commitment.
On Google Play, your short description (80 characters) appears directly below the title in search results and on the listing page. This is your headline write it as a benefit statement, not a feature list.
For the long description, front-load the most compelling information. The “read more” fold on both platforms means only the first 3–4 lines are visible by default. Write those lines as though they’re the only ones most users will read. Use natural language that reflects how real users talk about your app this improves both conversion and keyword relevance for Google Play’s algorithm, which reads the full description for semantic signals.
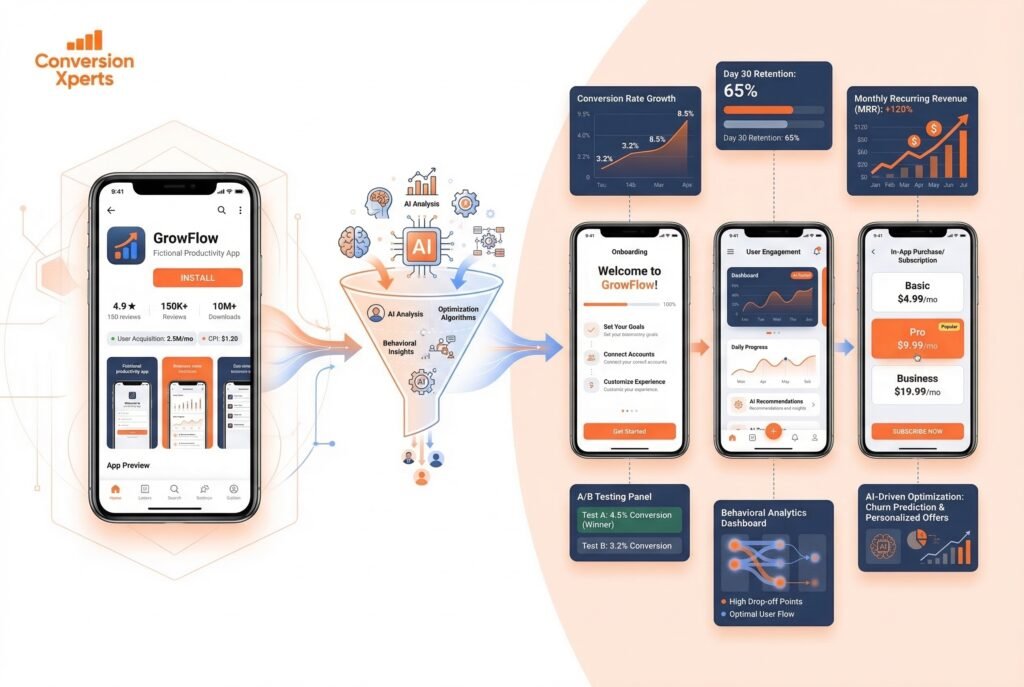
Mobile App CRO: Optimizing the In-App Conversion Funnel
Getting the install is only the beginning. Mobile app CRO extends deep into the app experience, where the real revenue is generated or lost.
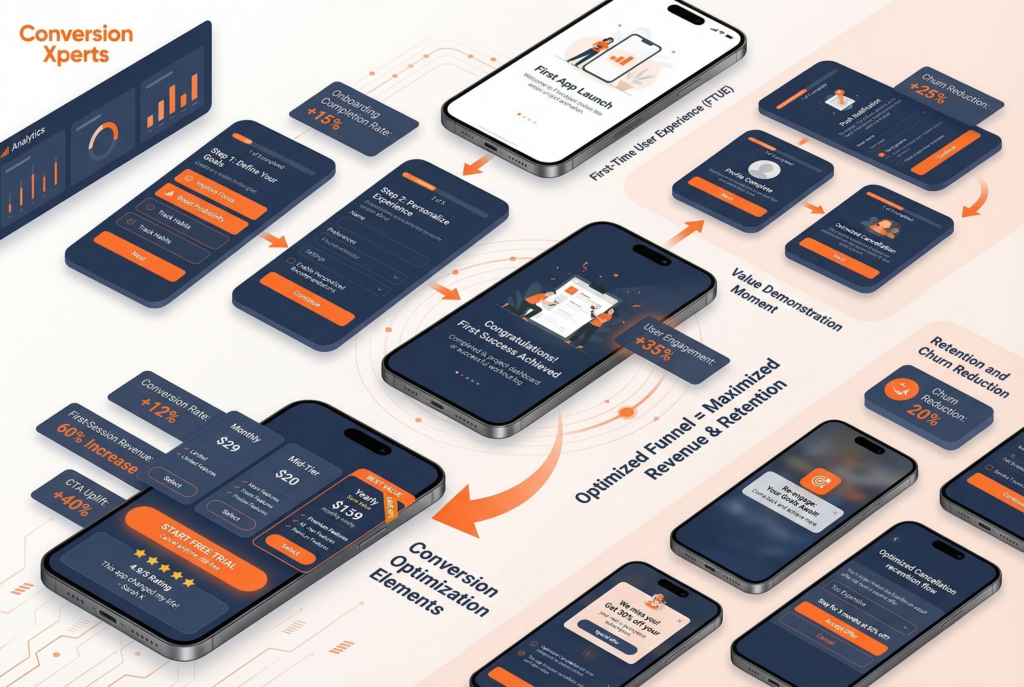
First-Time User Experience (FTUE): Where 60% of Revenue Is Decided
The FTUE — everything from the first app launch to the moment a user reaches the app’s core loop — is the highest-leverage in-app conversion zone. Research from Appsflyer and Paddle consistently shows that more than half of all in-app purchases occur in the first session.
This means your onboarding isn’t a tutorial. It’s a sales funnel.
The best FTUE flows in 2026 share these characteristics:
Personalization questionnaires: Apps like Duolingo, Calm, Noom, and MyFitnessPal open with 3–7 question flows that ask users about their goals, experience level, or challenges. This serves two functions simultaneously. It gathers data to personalize the experience, and — more importantly — it creates psychological investment. By the time users see a paywall, they’ve already told the app what they want and received a personalized “plan” or recommendation. Conversion rates are dramatically higher for users who complete personalization flows versus those who skip them.
Value demonstration before the paywall: Don’t gate everything behind a paywall immediately. Show users a taste of the core value one meditation, one lesson, one successful workout — before presenting subscription options. Users who have experienced value convert at 2–4x the rate of users who see a paywall without any prior product engagement, according to RevenueCat’s 2025 subscriber data.
Paywall timing and placement: The ideal paywall moment varies by category. For habit-forming apps (fitness, language learning, meditation), the paywall after a completed first “win” (first workout done, first lesson complete) consistently outperforms immediate-launch paywalls. For utility apps (VPN, PDF tools, password managers), the paywall at first use of the premium feature outperforms delayed approaches.
Paywall Design and CTA Optimization
Your paywall is the checkout page of your app. Every element — layout, pricing display, plan names, CTA text, trust signals — affects conversion.
Plan architecture: Three-tier pricing with a clear “best value” middle option consistently outperforms two-tier pricing for subscription apps. The “decoy effect” in behavioral economics is real and measurable. A monthly plan at $9.99, a 6-month plan at $39.99, and an annual plan at $59.99 (positioned as “Save 50%”) will consistently drive users to the annual plan — maximizing LTV — because the annual option is anchored against the monthly price.
CTA button copy: Generic CTAs like “Subscribe” or “Continue” underperform dramatically compared to benefit-driven, friction-reducing alternatives. High-converting CTA patterns include:
- “Start My Free 7-Day Trial”
- “Get Full Access – Cancel Anytime”
- “Unlock App Name Pro”
- “Begin My Journey”
In A/B tests documented by Purchasely in 2024, benefit-led CTA copy outperformed generic alternatives by an average of 19% in trial-start conversion rate.
Trust signals on the paywall: Add your star rating, number of reviews, or a prominent press quote directly on the paywall. Apps that include social proof elements on their paywall screens see 12–18% higher conversion rates compared to those without, according to SplitMetrics’ paywall optimization data.
Refund and cancellation policy prominence: Counterintuitively, making your “cancel anytime” or “full refund within 7 days” policy visible on the paywall increases conversion. Removing purchase anxiety converts more users than the small number who will take you up on the refund.
Reducing Churn: The Hidden CRO Lever
Conversion rate optimization isn’t just about acquisition it’s about retention. An app that converts well but churns its subscribers at 40% monthly is on a treadmill. Churn reduction is the most underrated form of mobile CRO.
Key churn reduction tactics backed by 2025 data:
Cancellation flow optimization: When a user attempts to cancel, present a structured “cancel flow” that identifies the reason (too expensive, not using it enough, missing a specific feature) and responds with a targeted retention offer. Paddle’s Retain product and tools like Revenuecat’s Paywalls both support cancel-flow optimization. Apps with structured cancel flows retain 20–30% of would-be churners, according to Paddle’s 2024 retention data.
Re-engagement push notification sequences: Users who haven’t opened the app in 3 days are 60% more likely to cancel than daily users, according to CleverTap’s 2025 Mobile Engagement Benchmark. An automated push notification sequence triggered by inactivity — not generic “come back!” messages but personalized, value-reinforcing messages like “You’re 3 days away from your streak goal” — can reduce churn by 15–25%.
In-app messaging and feature discovery: Many users churn not because the product is bad but because they never discovered the feature that would have made it sticky. In-app messaging tools (Braze, OneSignal, CleverTap) that surface relevant features based on user behavior are a proven retention CRO lever.
How to Conduct an A/B Test on Google Play and the App Store
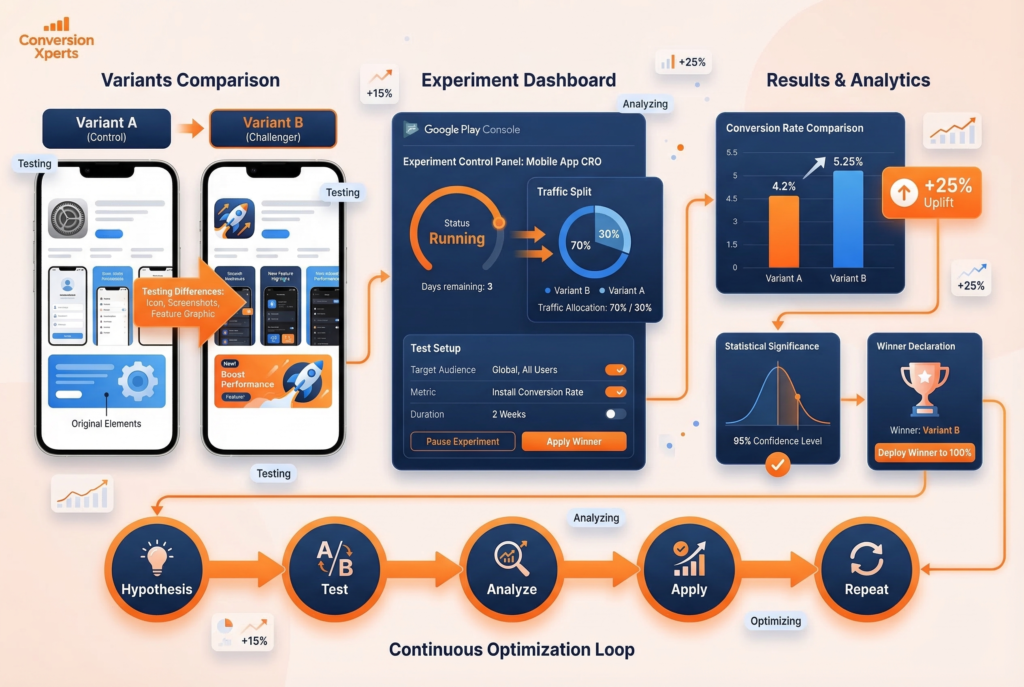
A/B testing is the engine of app conversion rate optimization. Without it, every change you make is a guess. With it, every change is an investment with measurable ROI.
How to Run a Store Listing Experiment on Google Play
Google Play Console’s Store Listing Experiments feature is one of the most powerful and underused tools available to Android developers. Here’s a step-by-step process:
Step 1: Access Store Listing Experiments. In Google Play Console, navigate to Grow > Store Presence > Store Listing Experiments. You’ll see options to run experiments on your main store listing or on custom store listings.
Step 2: Choose your variable. Run one experiment at a time. Start with the element that has the highest potential impact: your icon, your first screenshot, or your feature graphic. Mixing variables in a single experiment makes results uninterpretable.
Step 3: Create your variant. Upload your challenger creative. Google Play allows you to test up to 3 variants against a control simultaneously, but we recommend starting with one challenger to keep interpretation clean.
Step 4: Set traffic allocation. Allocate 50% of store listing visitors to your control and 50% to your challenger. If you have very high traffic volume, you can run a 70/30 split to protect conversion volume on your proven control.
Step 5: Set your minimum run time. Google Play recommends running experiments for at least 7 days to control for day-of-week variation. For lower-traffic apps, run experiments for 14–21 days minimum to reach statistical significance.
Step 6: Interpret results. Google Play reports results with a confidence percentage. A result is actionable when Google reports 90%+ confidence (95% preferred for major creative changes). Look at both conversion rate lift AND the absolute install volume difference.
Step 7: Apply and iterate. Apply the winning variant as your main listing. Then immediately set up your next experiment — great ASO is a continuous testing cycle, not a one-time event.
Google Play Store Conversion Rate vs. App Store Conversion Rate: Key Platform Differences
Before you run your first experiment, it’s critical to understand that Google Play Store conversion rate benchmarks and optimization levers are meaningfully different from App Store benchmarks — and conflating the two leads to misread results and bad decisions.
On Google Play, the store listing conversion rate is calculated from listing visitors to installers and is tracked directly inside Google Play Console. Google’s algorithm also indexes your full long description for keyword signals, meaning copy quality affects both ranking and conversion simultaneously. Google Play Experiments allows up to 3 creative variants running concurrently, and the google play store conversion rate data updates in near real-time — giving you faster feedback loops than Apple’s platform.
On the App Store, Apple separates “Impressions to Downloads” from “Product Page Views to Downloads” — two distinct app conversion rates that must be tracked independently. Impressions reflect discovery (search results, featured placements), while product page views reflect intentional engagement. The gap between these two numbers tells you how well your icon and title are converting curiosity into clicks. Apple’s Product Page Optimization (PPO) tool allows creative A/B testing but is limited to icons, screenshots, and preview videos — metadata like title and subtitle requires a full update outside of PPO.
Understanding which platform’s data you’re reading — and what it actually measures — is the foundation of any credible app store conversion rate optimization strategy.
How to Run Product Page Optimization on the App Store
Apple’s Product Page Optimization (PPO) — available to all developers — allows you to test up to 3 alternate versions of your product page against the default. Here’s how to use it effectively:
Eligibility: Your app must have at least 500 installs in the past 28 days to access PPO. Most commercially active apps qualify.
What you can test: App icon (requires App Review), screenshots, and app preview videos. You cannot test the app title or description through PPO ,those require metadata updates.
Setting up the test: In App Store Connect, go to your App’s page and select “Product Page Optimization” under “App Store.” Create a treatment, upload your alternate assets, and set a traffic proportion (maximum 90% to any variant).
Running duration: Apple recommends running PPO experiments for 90 days but in practice, apps with sufficient traffic can reach significance in 14–30 days. Check for statistical significance in the results tab before applying the winner.
Icon testing note: Testing alternate app icons through PPO requires submitting a binary update (a new app build). If you want to test icons without a binary update, third-party tools like SplitMetrics or StoreMaven allow pre-launch A/B testing using external traffic before the experiment reaches the store.
A/B Testing Principles That Separate Winning Teams from Losing Ones
Running tests is table stakes. Running them intelligently is what separates top-quartile apps from the pack.
Always form a hypothesis before testing. “We think adding a user review callout to screenshot 1 will increase conversion by 10% because social proof reduces purchase anxiety for new users” is a testable hypothesis. “Let’s try a different icon” is not.
Statistical significance is non-negotiable. A result is meaningless without it. Aim for 95% confidence before acting on any result. Tools like Evan Miller’s A/B test significance calculator are free and essential.
Test velocity compounds. Apps that run 2 tests per month accumulate 24 data points per year. Apps that run 1 test per quarter accumulate 4. Over three years, the high-velocity team has 72 learnings driving their conversion rate. This compounds dramatically.
Document everything. Maintain a testing log with hypothesis, variant description, run dates, traffic volume, result, and confidence level. This becomes your competitive moat — an institutional knowledge base of what works for your specific audience.
Best ASO Tools 2026: Complete Comparison

Choosing the right ASO and CRO tools is one of the most important infrastructure decisions you’ll make as a mobile growth team. Here’s a comprehensive comparison of the leading platforms in 2026.
Top ASO Tools 2026 — Feature Comparison Table
| Tool | Best For | Keyword Research | A/B Testing | Competitor Intel | Creative Analysis | Pricing (Starting) |
| AppTweak | Full-service ASO intelligence | ✅ Advanced | ✅ Via integration | ✅ Deep | ✅ Creative insights | ~$99/month |
| Sensor Tower | Enterprise UA + ASO | ✅ Advanced | ❌ Native | ✅ Very Deep | ✅ Ad intelligence | Custom/Enterprise |
| MobileAction | Semantic ASO + paid UA | ✅ AI-powered | ❌ Native | ✅ Strong | ✅ Ad intelligence | ~$149/month |
| SplitMetrics | Store A/B testing | ⚠️ Basic | ✅ Core strength | ✅ Moderate | ✅ Strong | Custom |
| data.ai (AppAnnie) | Market intelligence | ✅ Moderate | ❌ Native | ✅ Market-wide | ⚠️ Limited | Custom/Enterprise |
| StoreMaven | Pre-launch creative testing | ❌ Limited | ✅ Core strength | ⚠️ Limited | ✅ Strong | Custom |
| Purchasely | In-app paywall optimization | ❌ | ✅ Paywall A/B | ❌ | ✅ Paywall creative | ~$500/month |
| RevenueCat | Subscription analytics + paywalls | ❌ | ✅ Paywall A/B | ❌ | ⚠️ Basic | Free–$499/month |
AppTweak is the most complete all-in-one ASO platform for mid-market and enterprise app teams. Its keyword research module uses a proprietary “Search Ads Popularity” score that correlates more accurately with actual store search volume than competitors’ raw estimates. Its competitor intelligence suite allows you to track keyword rank history, review sentiment trends, and creative evolution for up to 100 competitor apps simultaneously.
Sensor Tower remains the gold standard for enterprise teams who need market-level intelligence — download estimates, revenue estimates, and ad creative intelligence at scale. Its ASO module is less granular than AppTweak for day-to-day keyword optimization but its category-wide benchmarking is unmatched.
MobileAction has emerged as a particularly strong tool for semantic keyword research and Apple Search Ads optimization. Its AI-powered keyword suggestions surface semantically related terms that competitors may have missed — a direct advantage for ASO conversion rate and ranking simultaneously.
SplitMetrics is the specialist choice for store listing A/B testing, offering both pre-App Store testing (using external traffic to simulate store page behavior) and deep analytics on creative performance. Teams that run high test velocity benefit most from SplitMetrics’ testing infrastructure.
RevenueCat is the leading platform for subscription analytics and in-app paywall optimization. Its free tier provides dashboard-level metrics on MRR, churn, trial conversion, and LTV that would otherwise require complex data engineering. Its Paywalls feature enables no-code paywall creation and A/B testing without app store releases a major efficiency gain for in-app CRO.
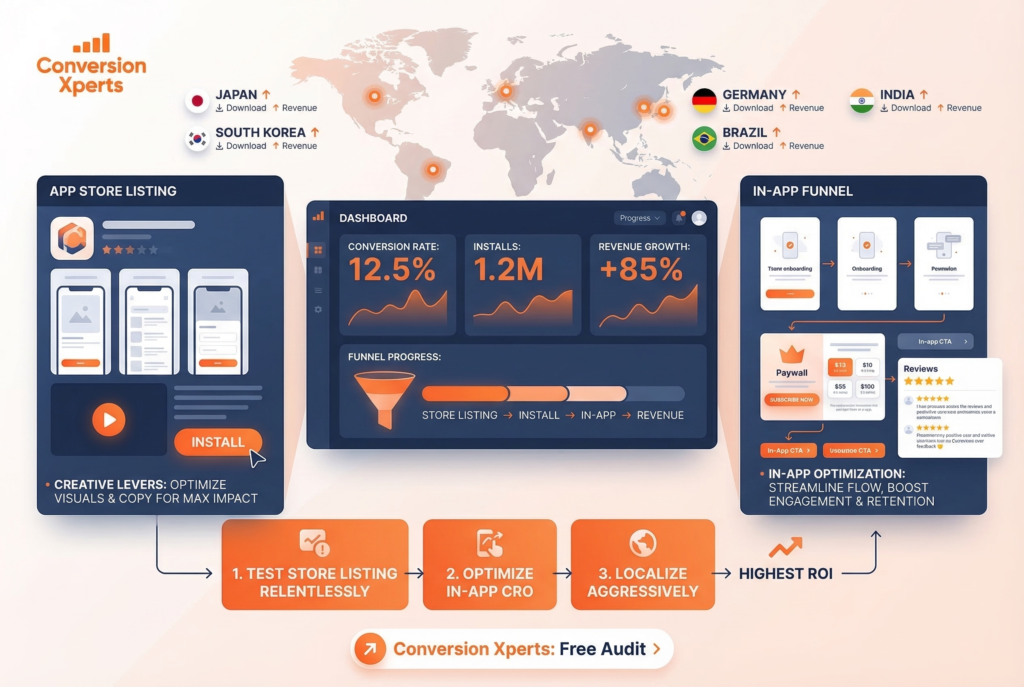
Localization: The Most Underused App CRO Lever
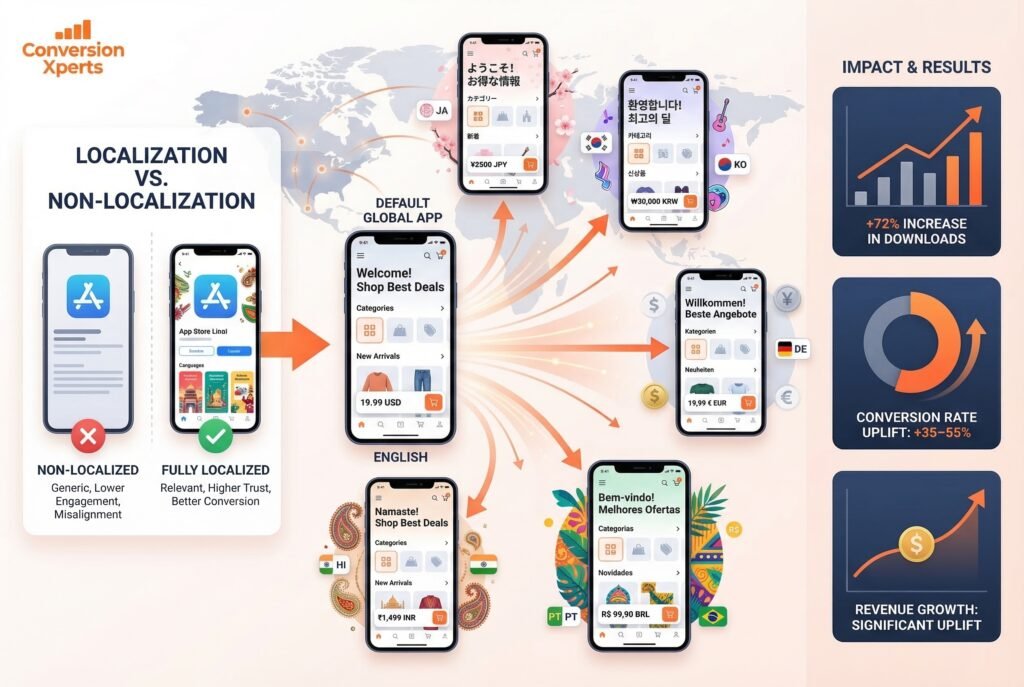
Localization — adapting your store listing and in-app experience for specific regional markets — is consistently cited as the single highest-ROI lever in app conversion rate optimization. Yet most app teams treat it as an afterthought.
The data is stark: localization can increase downloads by up to 72% in non-English markets, according to AppTweak’s 2024 ASO Benchmark Report. Apps that fully localize their store listings — not just translating the title and description but adapting screenshots, feature graphics, and preview videos to reflect local cultural context outperform machine-translated listings by 35–55% in conversion rate.
What Full Localization Actually Means
Most developers “localize” by running their English description through Google Translate and calling it done. Full localization is far more sophisticated:
Metadata localization means keyword research conducted natively in the target language, not translated from English. The top keyword for a fitness app in Japan may have no direct English equivalent. MobileAction and AppTweak both offer localized keyword databases for 70+ countries and languages.
Visual localization means adapting your screenshots and feature graphics to show UI in the local language, with models or imagery that reflect local culture. An app that shows English UI screenshots in a Japanese listing is signaling to Japanese users that the app wasn’t designed for them.
Rating and review localization means actively soliciting reviews in local languages and responding to reviews in those languages. An app with 50,000 English reviews and 3 Japanese reviews signals low local adoption to Japanese users browsing the store.
Pricing localization means setting local pricing that reflects purchasing power parity, not just converting USD at the current exchange rate. Apple and Google both offer localized pricing tiers. Apps with locally calibrated prices see significantly higher conversion from freemium to paid in price-sensitive markets like Brazil, India, and Southeast Asia.
Priority Markets for Localization in 2026
If you’re prioritizing localization efforts, focus first on these high-opportunity markets ranked by app revenue growth rate (Sensor Tower 2025 data):
- Japan : High ARPPU, premium app culture, deeply underserved by English-first apps
- South Korea : Fast-growing market, high smartphone penetration, strong gaming and health app demand
- Germany: Largest app economy in Europe, privacy-conscious users who respond to trust signals
- Brazil: Fastest-growing app market in Latin America, growing mid-market purchasing power
- India : Enormous volume opportunity; requires aggressive pricing localization for conversion
Review Management and Social Proof as ASO Conversion Drivers
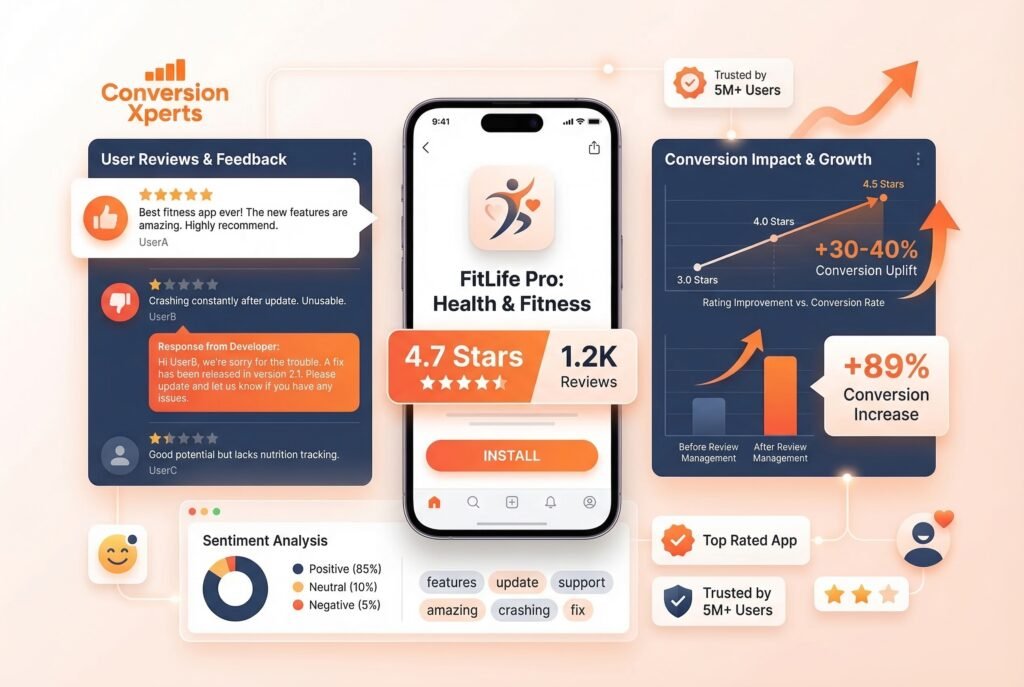
Your star rating is displayed in App Store and Google Play search results, on your store listing, and increasingly within Apple’s and Google’s AI-generated app recommendations. It is one of the most powerful conversion signals in the store — and one of the most actionable.
How Star Ratings Directly Impact Conversion Rate
Research by Apptentive (2024) found that moving an app’s rating from 3 stars to 4 stars increases conversion by approximately 89%. Moving from 4 stars to 4.5 stars adds another 30–40% lift. The difference between a 4.2-star and a 4.7-star app when all else is equal is enormous in user trust.
The formula for improving your star rating is simple but requires discipline: ask at the right moment. Apple’s SKStoreReviewRequest API (mandatory for in-app review prompts on iOS) should be triggered immediately after a positive user moment completing a level, reaching a goal, receiving a positive outcome. The most common mistake is triggering the review prompt at app launch (when users are most neutral) or after a negative experience (when they’re most likely to leave a negative review).
Review Response Strategy as a Conversion Signal
Responding to reviews especially negative ones signals to prospective users that your team is responsive and your app is actively maintained. Apple and Google both display developer responses publicly. A one-star review with no response is a conversion killer. A one-star review with a thoughtful, problem-solving response from the developer can actually increase conversion for fence-sitters who see it.
Best practices for review response:
Respond to every 1-star and 2-star review within 48 hours. Acknowledge the issue specifically (not with a generic template), explain what’s being done to fix it, and invite the user to contact support directly. This approach has been shown to convert approximately 15–20% of negative reviewers into updated positive reviews when the underlying issue is resolved.
Use tools like AppFollow, Appbot, or Replai to monitor and respond to reviews at scale, especially across multiple locales.
Sentiment Analysis: Mining Reviews for CRO Gold
Your reviews are the most honest product feedback you’ll ever receive — and most teams barely read them. Systematic review sentiment analysis using tools like AppFollow or Appbot can reveal:
- The features users love most (lean into these in your screenshots and description)
- The friction points causing churn (fix these to reduce negative reviews)
- The language users naturally use to describe your app’s value (use this exact language in your CTA copy — it’s already been tested by your users)
- Competitor weaknesses that you can position against in your store listing
This last point is particularly powerful. If your top competitor’s reviews are full of complaints about “too many ads” or “clunky interface,” and your app is better on both dimensions, make those direct competitive points in your screenshots. “No ads, ever” or “Rated #1 for ease of use” in your screenshot captions speaks directly to the unmet needs your competitor’s users are broadcasting publicly.