Sales Funnel Conversion Rate: The Ultimate Guide to Turning Visitors Into Customers (2026)
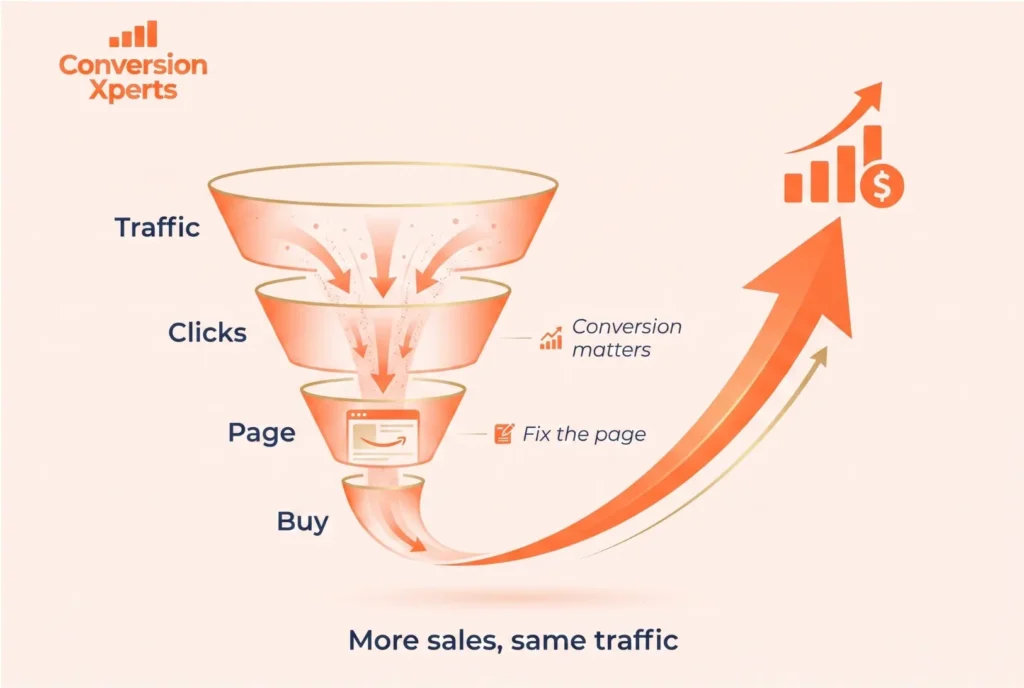
What Is a Sales Funnel Conversion Rate
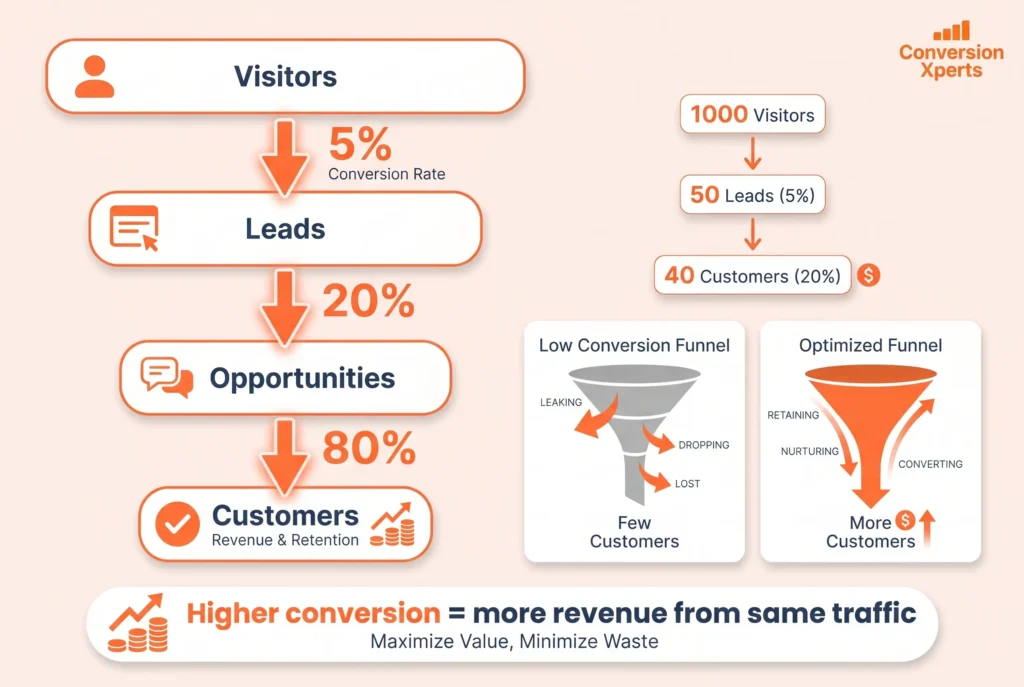
A sales funnel conversion rate is the percentage of people who complete a desired action at any given stage of your sales funnel. It is calculated by dividing the number of people who completed an action by the total number of people who entered that stage, then multiplying by 100.
For example, if 1,000 visitors land on your landing page and 50 of them fill out your lead generation form, your landing page conversion rate is 5 percent. If 200 of those leads then enter a sales conversation and 40 of them become paying customers, your close rate is 20 percent. Each of these numbers represents a conversion rate at a specific funnel stage, and together they tell the complete story of how efficiently your business turns attention into revenue.
Understanding your sales funnel conversion rate at every stage is not optional for serious businesses. It is the foundational measurement that makes every other marketing and sales decision more intelligent. Without it, you are optimizing based on opinions. With it, you are optimizing based on evidence.
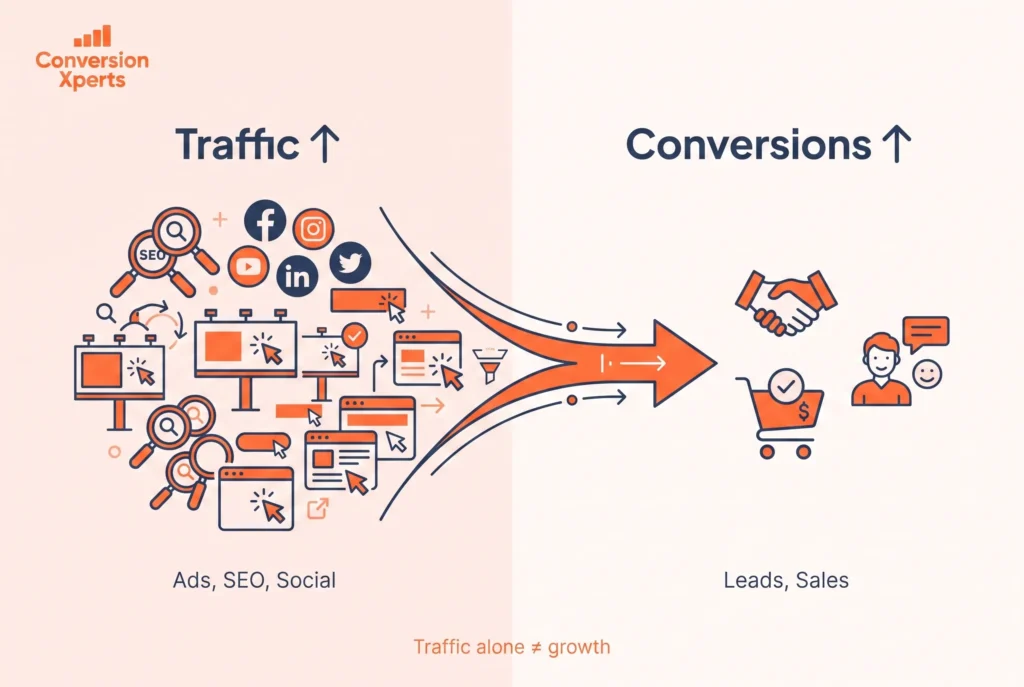
Why This Metric Matters More Than Traffic
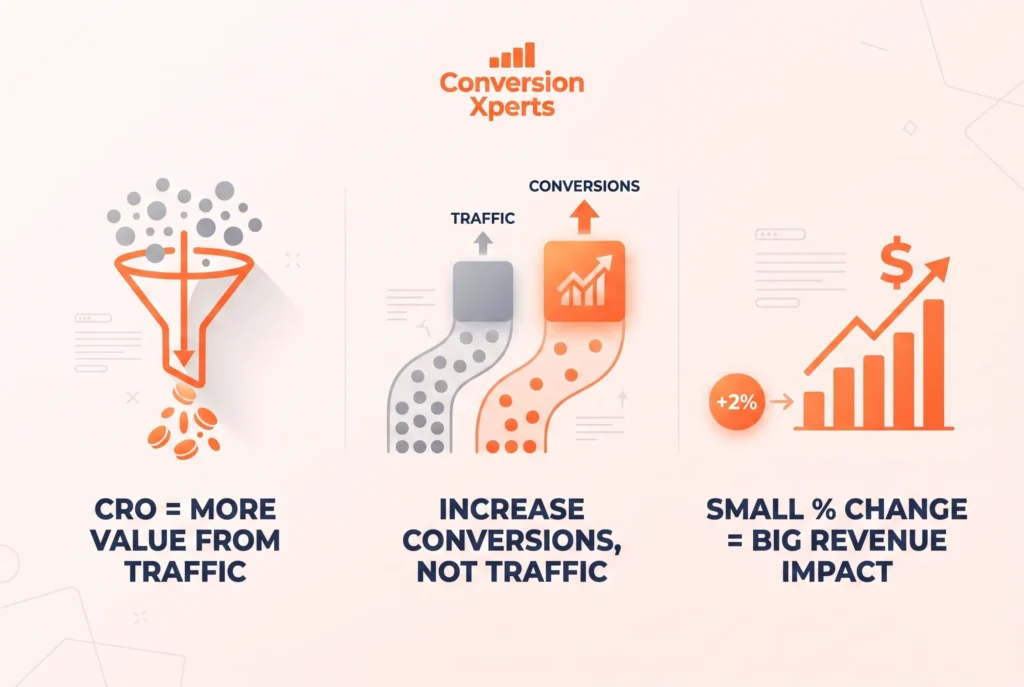
Many businesses focus obsessively on traffic volume while ignoring conversion performance. This is one of the most expensive strategic mistakes in digital marketing. Consider two businesses. Business A receives 50,000 monthly visitors and converts them at 1 percent, generating 500 customers. Business B receives 20,000 monthly visitors but converts at 3 percent, generating 600 customers. Business B generates more customers on 40 percent less traffic. The difference is entirely in the sales funnel conversion rate.
According to a 2024 report from WordStream, improving conversion rates by even one percentage point can deliver more revenue impact than doubling your advertising budget. This is the leverage that makes conversion rate optimization one of the highest return investments available to any business.
The Micro Conversion Principle
Not every conversion has to be a purchase or a signed contract. Micro conversions are the smaller actions users take on their journey through your funnel, including email signups, webinar registrations, free trial activations, demo requests, and content downloads. Each micro conversion is a measurable step forward in the relationship between your brand and your prospect, and tracking them gives you the diagnostic resolution to identify exactly where your funnel is losing people.
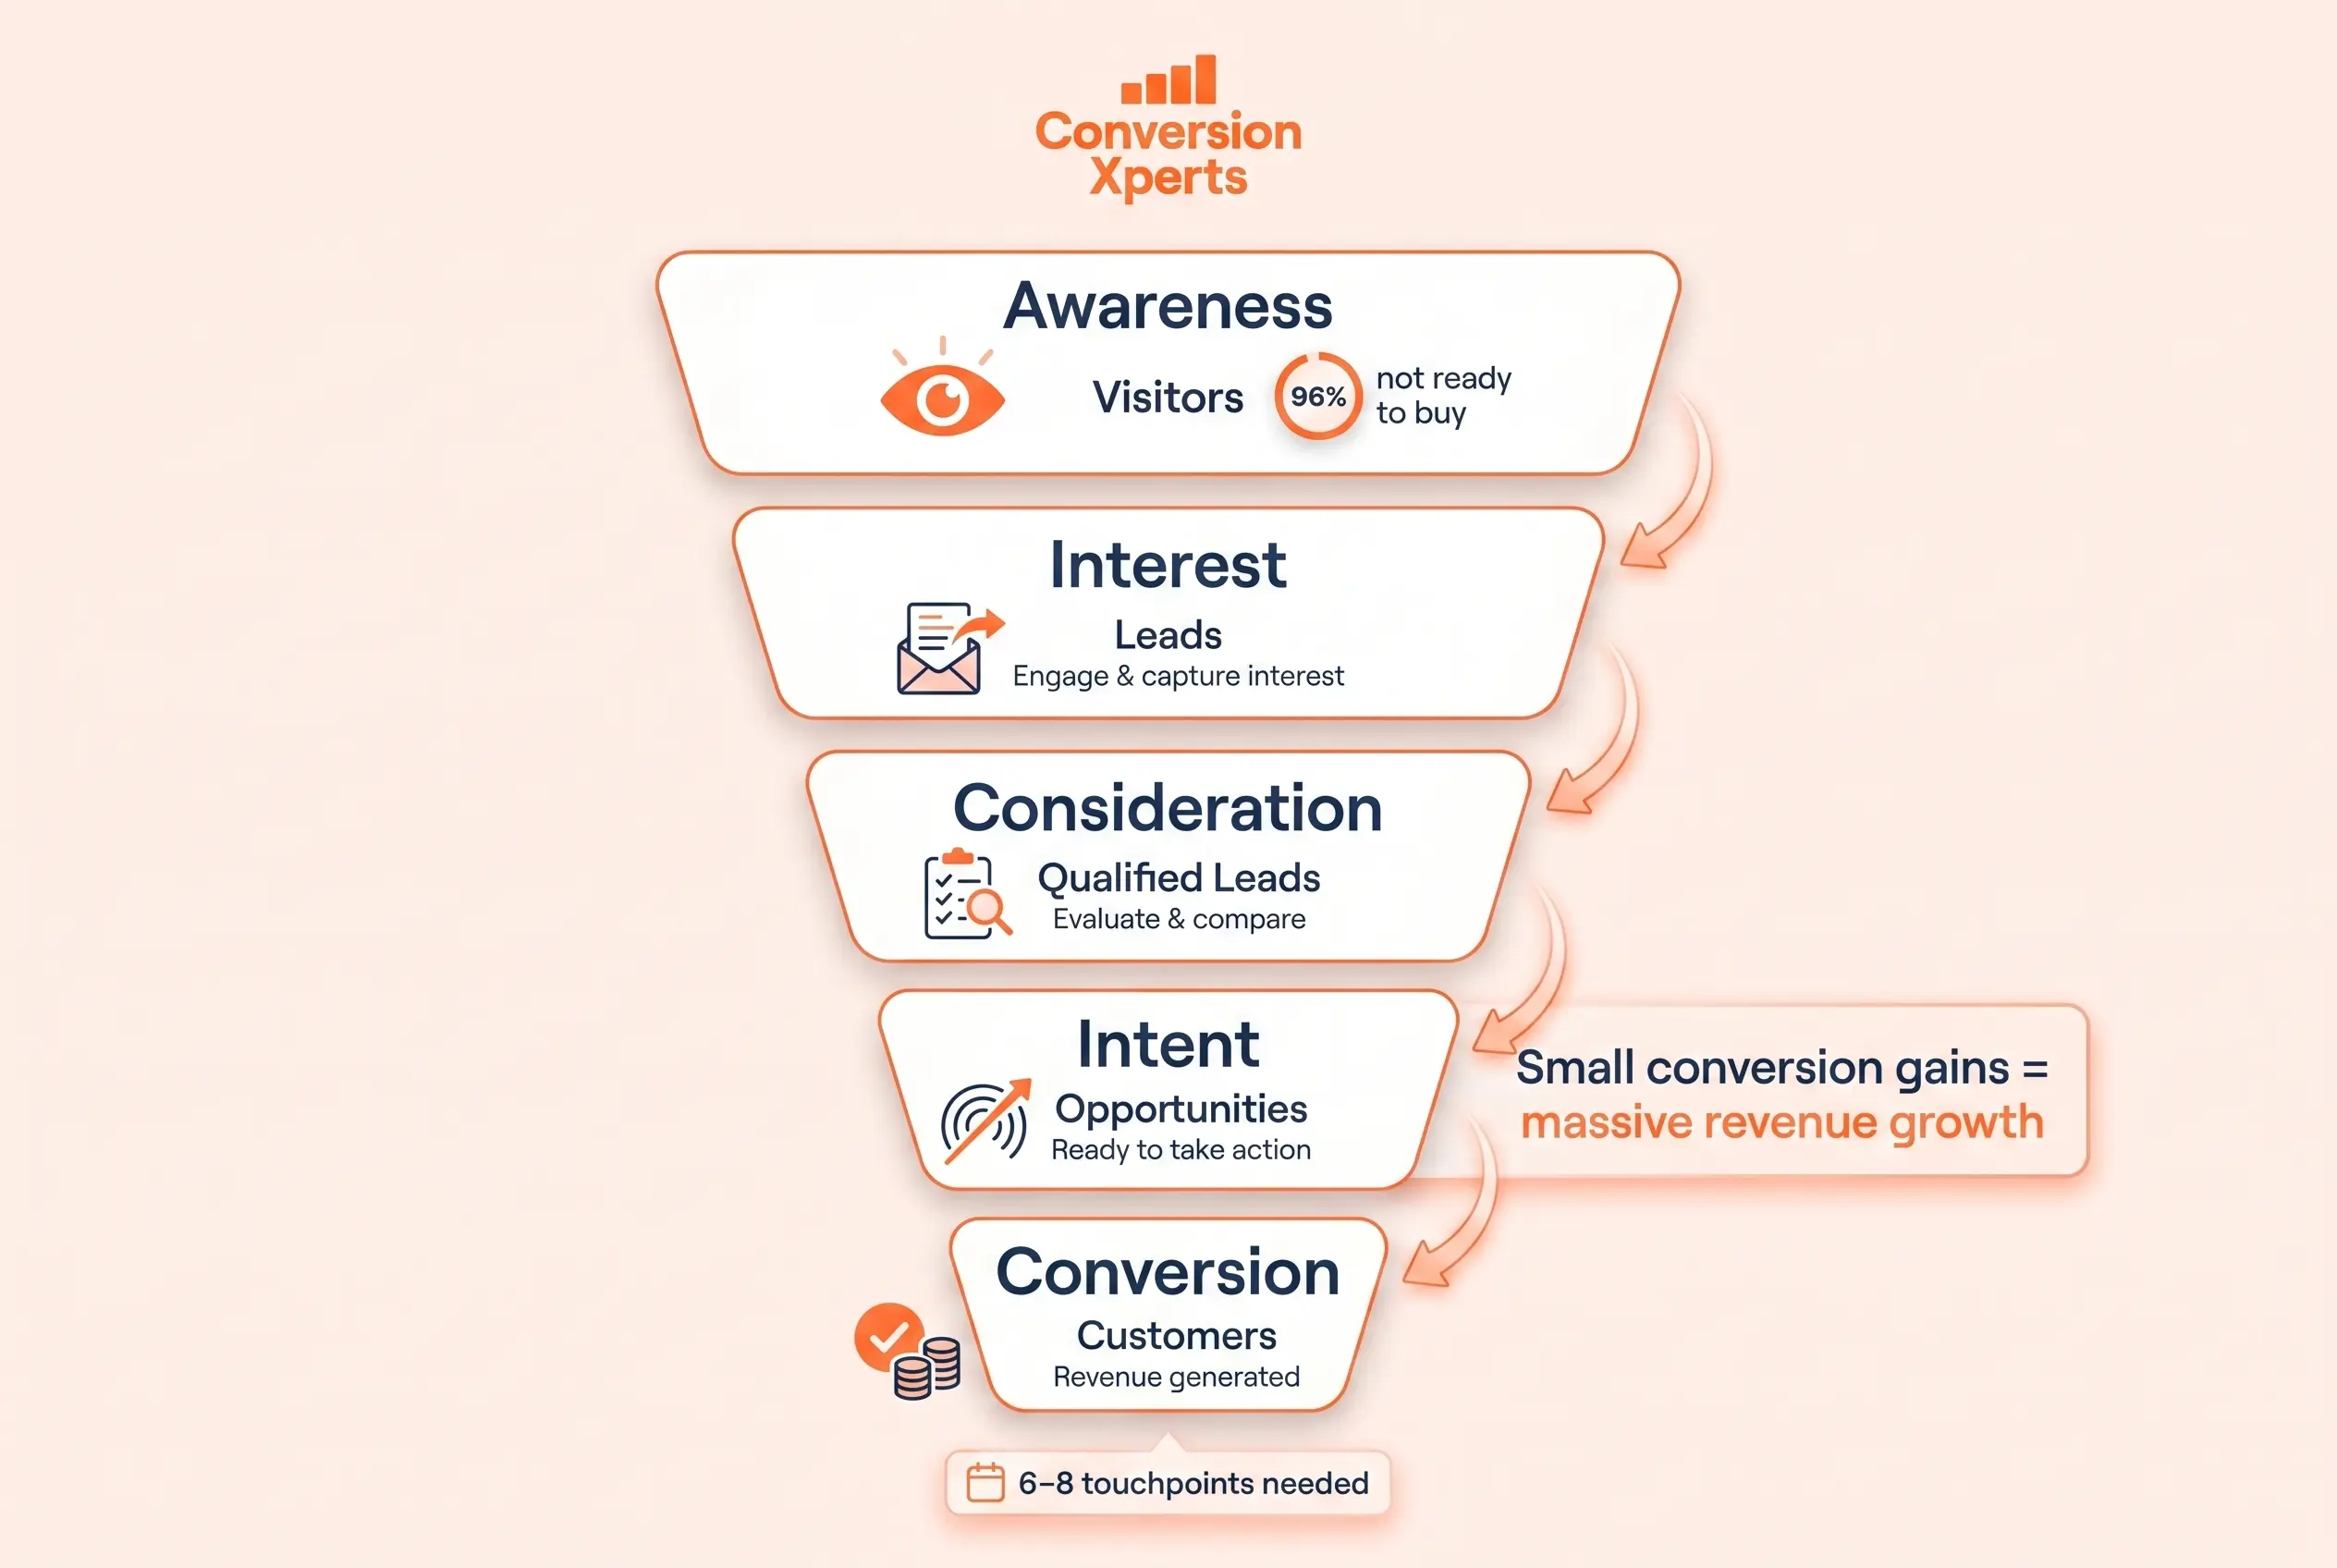
Sales Funnel Stages and Where Conversion Happens
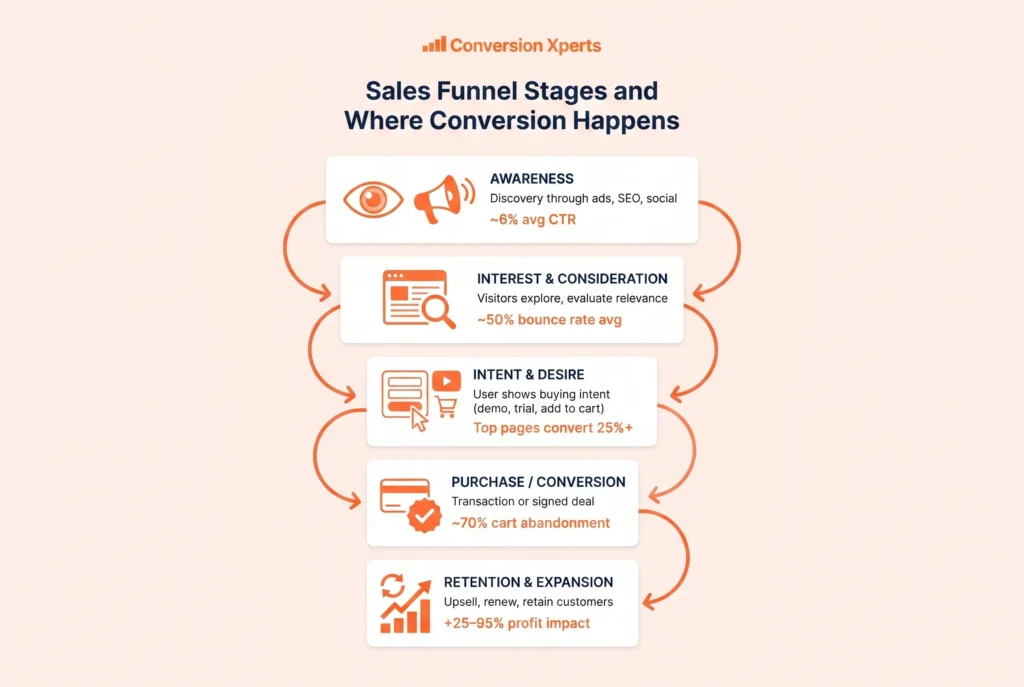
A sales funnel has distinct stages, and each stage has its own conversion rate that requires its own optimization strategy. Understanding each stage is essential before you can improve overall funnel performance.
Stage One: Awareness
The awareness stage is where potential customers first discover your brand. This happens through search engines, social media, paid advertising, word of mouth, podcasts, or content marketing. Your conversion goal at this stage is to turn anonymous traffic into engaged visitors who consume your content and take a first identifiable action.
The conversion rate at the awareness stage is typically measured as the percentage of ad impressions that result in clicks, or the percentage of organic search impressions that generate website visits. According to Google’s own benchmark data from 2024, average click through rates on Google Search ads across all industries hover around 6.11 percent. Top performing campaigns can achieve rates two to three times higher with strong ad copy and audience targeting.
What most competitors miss at this stage is the importance of message to market match. The reason most awareness campaigns underperform has nothing to do with the platform or the bidding strategy. It is because the message in the ad or the headline does not match what the target audience is actually thinking and feeling at that moment. The closer your awareness content mirrors the exact language and concerns of your ideal customer, the higher your initial conversion rate will be.
Stage Two: Interest and Consideration
Once a visitor lands on your website, they enter the interest and consideration stage. This is where they evaluate whether your solution is relevant to their problem. Your conversion goal here is to move them from passive browsing to active engagement, which typically means consuming multiple pages of content, watching a product video, or reading case studies and testimonials.
The bounce rate is the primary inverse indicator of performance at this stage. A high bounce rate means a large percentage of visitors leaving after viewing only one page. This signals that either the traffic quality is wrong or the landing experience is failing to communicate relevance quickly enough. According to a 2024 study by Contentsquare, the average bounce rate across industries is 50.9 percent, but top performing sites achieve rates below 30 percent through precise alignment between their traffic sources and their landing page content.
Stage Three: Intent and Desire
The intent stage is where a visitor transitions from being interested in your category to being specifically interested in your solution. This is where they request a demo, start a free trial, download a comparison guide, or add a product to their cart. The conversion rate at this stage is one of the most important numbers in your entire funnel because it represents the pivot point between education and evaluation.
According to HubSpot’s 2024 Marketing Report, the average landing page conversion rate across industries is 9.7 percent, but the top quartile of landing pages converts at 25 percent or higher. The gap between average and excellent at this stage is not explained by small tactical differences. It is explained by fundamental differences in how clearly the value proposition is communicated, how strong the social proof is, and how frictionless the conversion action feels to the user.
Stage Four: Purchase or Conversion
The purchase stage is where financial or contractual commitment happens. For ecommerce businesses this is the checkout. For B2B businesses this is the proposal acceptance or contract signing. For SaaS businesses this is the upgrade from trial to paid subscription. The conversion rate at this stage is often called the close rate in sales contexts and the checkout conversion rate in ecommerce contexts.
According to the Baymard Institute’s 2024 research compilation, the average documented cart abandonment rate is 70.19 percent, meaning that only about three in ten people who begin the checkout process actually complete it. The primary reasons for abandonment include unexpected costs like shipping fees, account creation requirements, trust concerns, and overly complex checkout interfaces.
Stage Five: Retention and Expansion
The most underestimated stage of any sales funnel is what happens after the first conversion. Retention is a conversion rate metric too. The percentage of customers who remain subscribed, repurchase, or upgrade represents the conversion rate of your retention funnel. Bain and Company research has consistently shown that a 5 percent improvement in customer retention rates can increase profits by between 25 and 95 percent, making this stage arguably the highest leverage point in the entire conversion ecosystem.
Sales Funnel Conversion Rate Benchmarks by Industry
One of the most common questions businesses ask is what a good sales funnel conversion rate actually looks like. The honest answer is that it depends heavily on industry, business model, price point, and funnel structure, but benchmarks still provide essential context for evaluating your own performance.
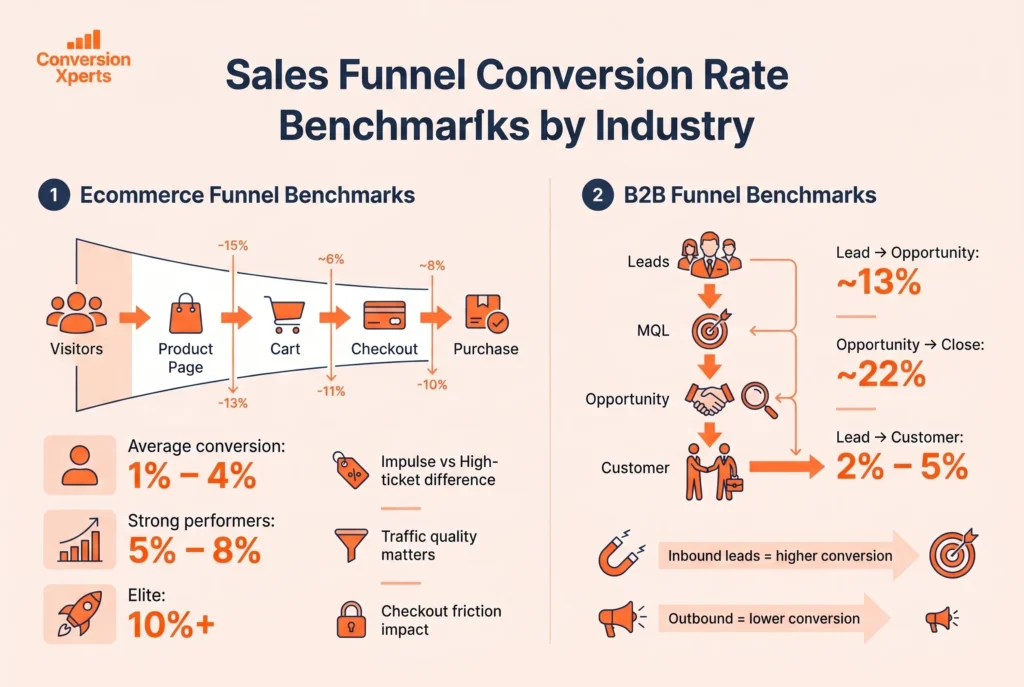
Ecommerce Conversion Rate Benchmarks
For ecommerce businesses, the overall website conversion rate from visitors to purchasers typically ranges between 1 and 4 percent. According to IRP Commerce’s 2024 industry benchmarks, the overall average sits at approximately 2.86 percent. However, top performing ecommerce sites consistently achieve rates of 5 to 8 percent, and in highly optimized niches with strong brand loyalty, rates above 10 percent are documented.
The enormous range within ecommerce is explained by factors including product price, traffic quality, and the quality of the product page, cart, and checkout experience. Lower priced impulse purchases convert at much higher rates than high consideration purchases. Branded search traffic converts at three to five times the rate of cold display traffic.
B2B Sales Funnel Conversion Rate Benchmarks
B2B funnels have fundamentally different conversion dynamics because of longer sales cycles, multiple decision makers, and higher contract values. According to Salesforce’s 2024 State of Sales report, the average lead to opportunity conversion rate in B2B is 13 percent, the average opportunity to close rate is 22 percent, and the average overall lead to customer conversion rate is approximately 2 to 5 percent.
B2B conversion rates are heavily influenced by lead source quality. Inbound leads generated through content marketing and SEO convert to customers at rates three to five times higher than outbound cold outreach leads, according to data compiled by Demand Gen Report in 2024. This is because inbound leads have already demonstrated interest and have self selected into your funnel based on a genuine problem they are trying to solve.
SaaS Sales Funnel Conversion Rate: A Deep Dive
The SaaS sales funnel is structurally different from ecommerce and traditional B2B funnels in ways that have profound implications for conversion strategy. Understanding these differences is essential for any SaaS business trying to improve its overall funnel performance.
The SaaS Funnel Structure
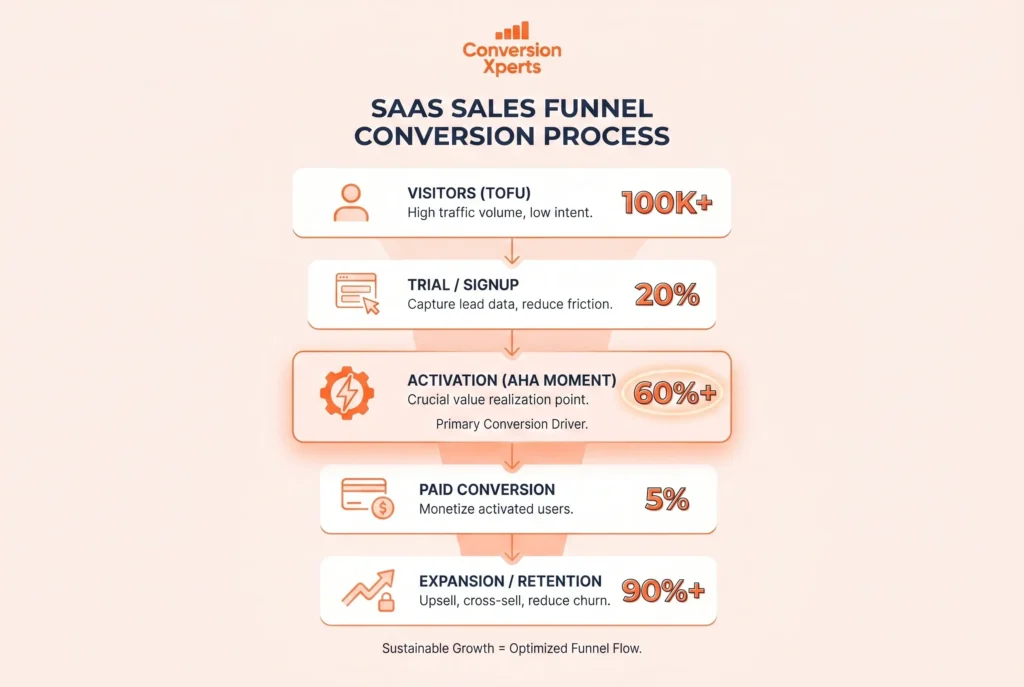
A typical SaaS sales funnel moves prospects through a distinct sequence. Visitors arrive through content marketing, paid advertising, or word of mouth. A subset of those visitors signs up for a free trial or freemium plan. A subset of those trial users becomes engaged and experiences meaningful product value. A subset of engaged trial users converts to a paid subscription. And a subset of paid subscribers expands their usage over time through upgrades and additional seat purchases.
According to OpenView Partners’ 2024 SaaS Benchmarks Report, the average free trial to paid conversion rate across SaaS companies is approximately 25 percent for opt in trials where no credit card is required and approximately 60 percent for opt out trials where a credit card is required at signup. The choice between these models represents one of the most consequential conversion decisions a SaaS business can make, as the opt in model generates more trial volume while the opt out model generates higher per trial conversion rates.
The Most Underrated SaaS Conversion Metric
The single most important conversion rate in any SaaS funnel is the activation rate, which is the percentage of trial users who reach the specific moment where they experience the core value of the product for the first time. This moment is often called the aha moment, and research consistently shows that users who reach it are dramatically more likely to convert to paid plans.
According to a 2024 analysis by Mixpanel, SaaS products where users reach a defined activation milestone within the first session have an average 30 day retention rate that is 2.5 times higher than products where activation takes multiple sessions or never occurs at all. Improving activation rates is therefore one of the most direct and high leverage ways to improve overall SaaS sales funnel conversion rates.
The key to improving SaaS activation is reducing the time and effort required for a new user to reach their first meaningful success moment. This means designing onboarding flows that guide users to value quickly, eliminating setup steps that do not directly contribute to the first experience of core product benefit, and using behavioral triggers to identify and support users who are showing signs of getting stuck before they disengage entirely.
Trial Conversion Optimization for SaaS
Converting trial users to paid subscribers is where SaaS businesses most frequently leave money on the table. The most common failure modes include insufficient in trial communication, no clear urgency or deadline around conversion, weak value communication during the trial period, and the absence of personalized outreach to high intent trial users who have shown engagement signals.
Research from Totango’s 2024 SaaS Metrics Report shows that SaaS companies that implement triggered email sequences based on user behavior during the trial period see trial to paid conversion rates that are on average 43 percent higher than companies that send only generic broadcast trial emails. Behavioral triggers are dramatically more effective than time based sequences because they are contextually relevant to what the user has actually experienced.
The Role of Pricing Page Conversion in SaaS
For self serve SaaS businesses, the pricing page is one of the highest leverage conversion surfaces in the entire funnel. According to a 2024 study by the SaaS pricing consultancy ProfitWell, SaaS companies that A/B test their pricing pages see average revenue improvements of 11.9 percent, yet fewer than 20 percent of SaaS businesses have ever run a controlled test on their pricing presentation.
The most common pricing page conversion problems include too many plan options creating decision paralysis, unclear differentiation between plans making the upgrade value proposition confusing, pricing anchors that are positioned incorrectly relative to the plan you most want users to choose, and the absence of social proof or risk reduction elements on the page itself.
The Biggest Reasons Your Sales Funnel Is Leaking Revenue
Understanding why funnels leak is as important as knowing how to plug those leaks. Most sales funnel conversion rate problems fall into a small number of predictable categories, and recognizing them is the first step toward fixing them.
Misalignment Between Traffic and Offer
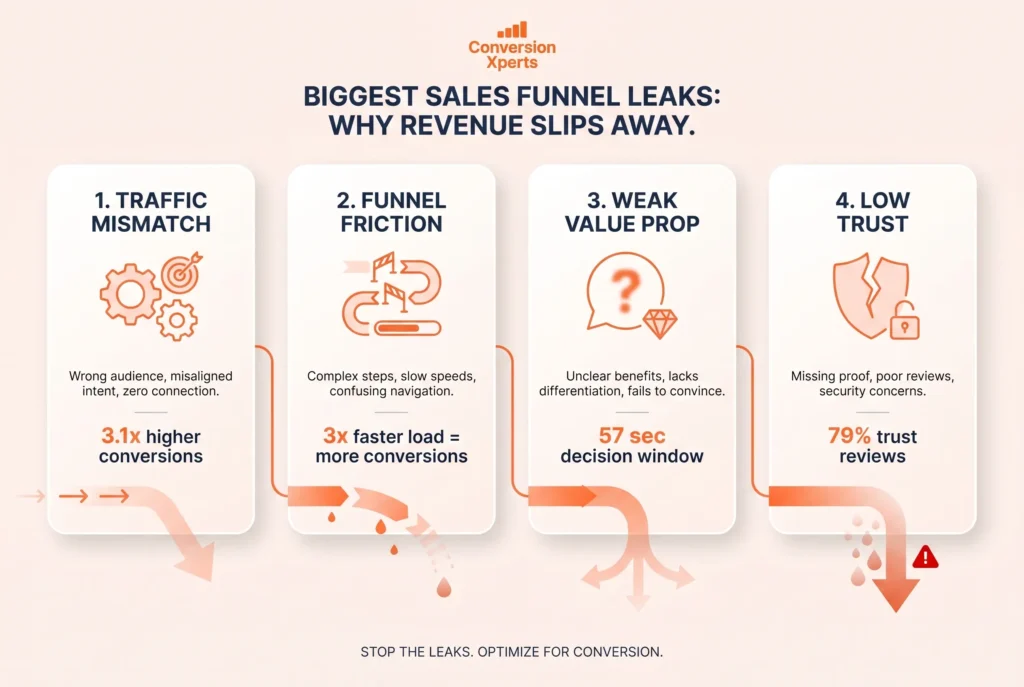
The most common and most costly funnel problem is bringing in visitors whose needs do not match the solution being offered. This misalignment happens when targeting parameters are too broad, when ad creatives promise something different from what the landing page delivers, or when SEO content attracts visitors at the wrong stage of their buying journey.
The solution is message continuity, which is the practice of ensuring that every element of the user’s journey from the first point of contact through to the conversion action communicates a consistent and relevant message. According to a 2024 study by Unbounce, landing pages with strong message match to their source ads convert at 3.1 times the rate of landing pages with weak or inconsistent messaging.
: Friction in the Conversion Flow
Friction is any element of the user experience that creates resistance, confusion, or effort in the process of completing a conversion action. Friction manifests in many forms including long forms with too many required fields, slow page load times, unclear calls to action, trust barriers like the absence of security badges or customer reviews, and poor mobile experience.
According to Google’s research on page experience published in 2024, a page that loads in one second converts at three times the rate of a page that loads in five seconds. This single data point illustrates just how much conversion leverage lives in technical performance, an area that most conversion discussions underweight in favor of design and copy changes.A value proposition is the specific, concrete articulation of what a customer gains from choosing your solution and why it is meaningfully different from alternatives. Many businesses have strong value propositions in their internal strategy documents but communicate them poorly or generically on their actual web pages.
Research from the Nielsen Norman Group published in 2024 shows that users spend an average of 57 seconds evaluating a page before deciding whether to stay or leave. Within that window, if they cannot quickly and clearly understand what you offer, who it is for, and why it is better than alternatives, they leave. The value proposition is not a tagline. It is the clearest possible answer to the question: why should I choose this?
Absence of Trust and Social Proof
Conversion requires trust, and trust requires evidence. The evidence most persuasive to prospective customers includes verified reviews and testimonials from people similar to themselves, case studies with specific and credible results, recognizable client logos or media mentions, guarantee or return policy assurances, and security and privacy indicators.
According to BrightLocal’s 2024 Local Consumer Review Survey, 79 percent of consumers say they trust online reviews as much as personal recommendations from friends. Yet many businesses present testimonials in ways that undermine their credibility, including unattributed quotes with no name or photo, vague statements of satisfaction with no specific results mentioned, or reviews that appear clearly edited or manufactured.
Proven Strategies to Improve Your Sales Funnel Conversion Rate
The following strategies are grounded in research, validated through real world implementation, and applicable across ecommerce, SaaS, and lead generation funnels. They are arranged from foundational to advanced to help businesses at every stage of conversion maturity.
Strategy One: Behavioral Analytics and User Research
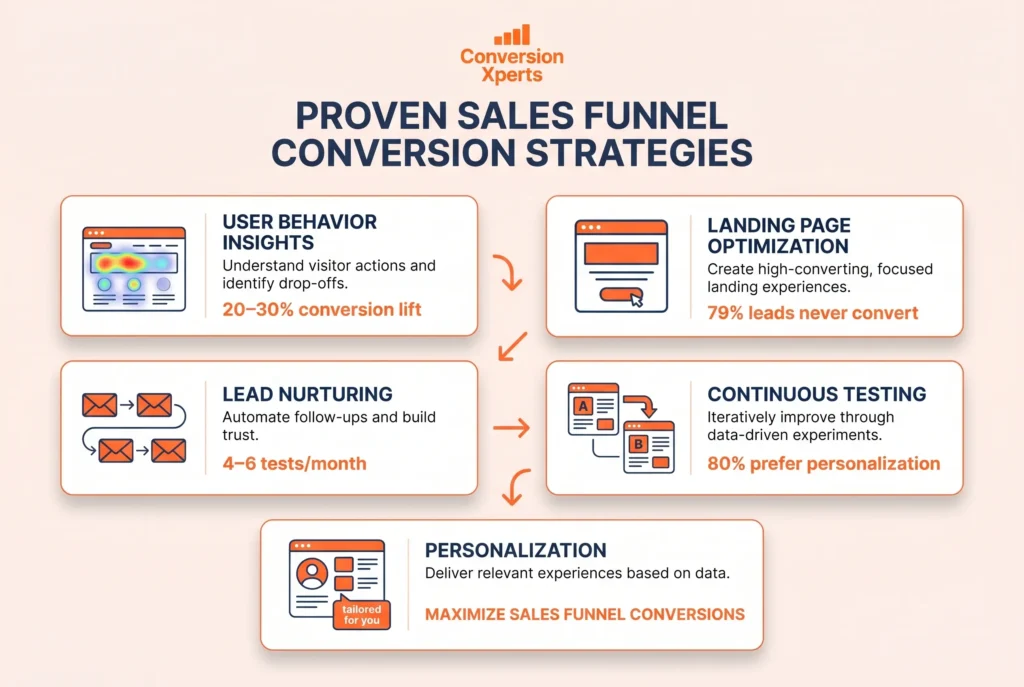
You cannot fix what you cannot see. Before implementing any conversion optimization strategy, you need a clear picture of what is actually happening in your funnel right now. This means implementing behavioral analytics tools that show you how users move through your pages, where they stop engaging, what confuses them, and what motivates them.
Microsoft Clarity and Hotjar are the two most widely used platforms for this purpose. Clarity uses machine learning to automatically flag sessions containing frustration signals like rage clicks and dead clicks, making it efficient to identify usability problems at scale. Hotjar complements this with direct user feedback tools including on page surveys and exit intent questions that capture the voice of the customer in their own words.
Combining session recordings, heatmaps, and direct feedback creates a complete diagnostic picture of your funnel’s current performance. This qualitative data is the foundation on which every evidence based optimization decision should be built.
Strategy Two: Landing Page Optimization
Your landing pages are the highest leverage surfaces in your entire conversion funnel because they represent the moment where visitor interest either converts to action or dissolves into abandonment. Every element of a landing page influences its conversion rate, and even small improvements compound significantly across high traffic volumes.
The five most impactful elements to optimize on any landing page are the headline which communicates your value proposition in one clear sentence, the hero section which combines the headline with visual proof and a primary call to action above the fold, the social proof section which demonstrates credibility through specific customer results, the friction reduction elements which address objections and lower perceived risk, and the call to action which tells the visitor exactly what to do next and why now is the right time.
A/B testing each of these elements systematically, rather than redesigning pages wholesale and hoping for the best, is the methodology that produces consistent and measurable conversion improvements. According to HubSpot’s 2024 A/B testing guide, businesses that run ongoing testing programs improve their conversion rates by an average of 20 to 30 percent within the first year.
Strategy Three: Email Nurture and Lead Qualification
Most leads are not ready to buy when they first enter your funnel. According to MarketingSherpa’s research, 79 percent of marketing leads never convert to sales primarily due to a lack of nurturing. Email nurture sequences bridge the gap between initial interest and purchase readiness by continuing to deliver value, build trust, and address objections over time.
Effective nurture sequences are not generic broadcast emails. They are behavioral sequences triggered by specific actions a lead takes within your funnel. A lead who downloads a comparison guide is showing different intent signals than a lead who viewed the pricing page three times. Each behavior should trigger a different follow up sequence tailored to that specific level of intent.
For B2B and SaaS businesses, the integration of lead scoring with nurture sequences creates a powerful qualification mechanism. Lead scoring assigns numerical values to behaviors and demographic characteristics, allowing the marketing and sales teams to prioritize high intent leads for immediate outreach while continuing to nurture lower intent leads through automated sequences until their intent signals strengthen.
Strategy Four: Conversion Rate Optimization Through Continuous Testing
Conversion rate optimization is not a project with a start and end date. It is an ongoing process of hypothesis generation, controlled testing, and iterative improvement. The businesses with the highest sales funnel conversion rates in any industry are not the ones that ran the most ambitious redesign. They are the ones that have been running the most tests for the longest time.
The scientific method applied to marketing requires clear hypotheses grounded in behavioral data, adequate sample sizes to achieve statistical significance, controlled test conditions that isolate the variable being tested, and disciplined interpretation of results that distinguishes genuine improvements from statistical noise.
According to the comprehensive research compiled at CXL Institute (cxl.com), the most successful conversion programs run a minimum of four to six meaningful tests per month per funnel stage, with each test grounded in a specific behavioral insight rather than aesthetic preference.
Strategy Five: Personalization and Segmentation
Generic experiences convert worse than relevant ones. As traffic volumes grow and behavioral data accumulates, the opportunity to deliver personalized funnel experiences becomes increasingly practical and increasingly impactful. Personalization in the context of conversion optimization means showing different versions of your website content, messaging, and offers to different visitor segments based on their characteristics and behaviors.
Basic personalization might mean showing different hero messages to visitors arriving from different traffic sources. Advanced personalization might mean dynamically adjusting the featured case studies on a landing page based on the industry of the visitor. Sophisticated personalization in SaaS products means adapting the onboarding experience based on the use case a new user identified at signup.
According to Epsilon’s 2024 research on personalization, 80 percent of consumers are more likely to make a purchase from a brand that provides personalized experiences. For B2B buyers the correlation is even stronger, as decision makers strongly prefer vendors whose communication demonstrates an understanding of their specific industry and challenge.
How ConversionXperts Helps You Fix Your Sales Funnel
ConversionXperts is a conversion rate optimization agency built specifically for businesses that want to close the gap between the traffic they are already generating and the revenue that traffic should be producing. The team at ConversionXperts brings together expertise in behavioral analytics, user psychology, A/B testing, and sales funnel strategy to deliver measurable improvements in sales funnel conversion rates across every stage of the customer journey.
What ConversionXperts Does Differently
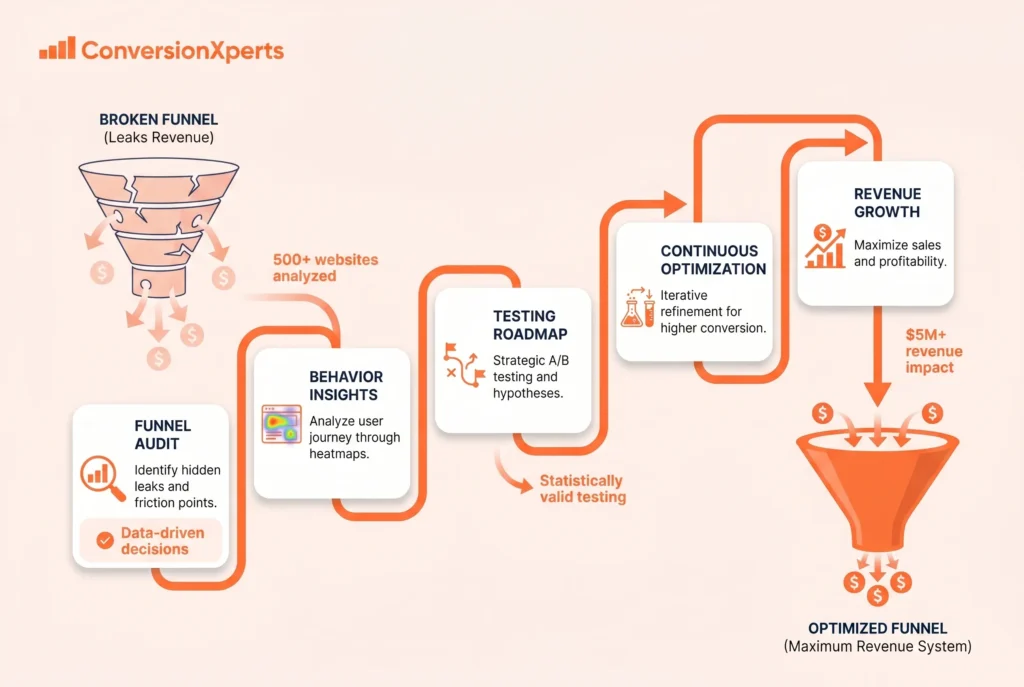
Most agencies run a few heatmap reviews, make some design changes, and call it optimization. ConversionXperts operates differently. Every engagement begins with a comprehensive behavioral audit using Microsoft Clarity and Hotjar to establish a clear, evidence based picture of exactly where the funnel is losing users and why. This is not opinion. It is behavioral data combined with direct user feedback analyzed through AI powered interpretation frameworks.
From that diagnostic foundation, ConversionXperts builds a prioritized testing roadmap. Every test on that roadmap addresses a specific, evidenced conversion problem rather than a design preference or an untested assumption. Tests are structured for statistical validity, run for the duration required to reach significance, and analyzed by specialists who distinguish genuine learning from noise.
The methodology ConversionXperts follows draws on the same evidence base cited throughout this guide including HubSpot research, Baymard Institute findings, Nielsen Norman Group usability studies, and the latest published research on AI powered conversion analysis. This grounding in documented evidence means that the recommendations clients receive are defensible, repeatable, and genuinely optimized for their specific funnel context.
Services Offered by ConversionXperts
ConversionXperts provides a full suite of conversion optimization services including CRO audit and strategy, user behavior analysis using Clarity and Hotjar, A/B testing and multivariate testing, ecommerce conversion optimization, SaaS sales funnel conversion optimization, landing page optimization, analytics setup and tracking configuration, and conversion funnel analysis.
For businesses ready to stop guessing about their conversion rate and start improving it based on evidence, ConversionXperts offers a free conversion audit that identifies the specific friction points and missed opportunities in your current funnel. The audit covers the full conversion journey from traffic source to final conversion action and delivers a prioritized list of high impact improvements ready for immediate implementation.
Real Results From Real Clients
ConversionXperts has analyzed and optimized over 500 websites across ecommerce, SaaS, lead generation, and media categories. Clients have collectively generated over five million dollars in incremental revenue attributable to recommendations grounded in user behavior analysis. These results are documented in case studies and verified by the clients who achieved them.
To learn more about the full sales conversion rate optimization guide and services from ConversionXperts, visit conversionxperts.com/services/user-behavior-analysis where you can also explore case studies documenting real client results across ecommerce, SaaS, and lead generation categories.