Website Conversion Rate: The Ultimate 2026 Guide to Benchmarks, Averages & How to Beat Them
What Is a Website Conversion Rate and How Do You Calculate It
A website conversion rate is the percentage of visitors who complete a desired action on your site, whether that action is making a purchase, filling out a contact form, signing up for a newsletter, or booking a call.
The formula is straightforward:
Conversion Rate = (Number of Conversions / Total Visitors) x 100
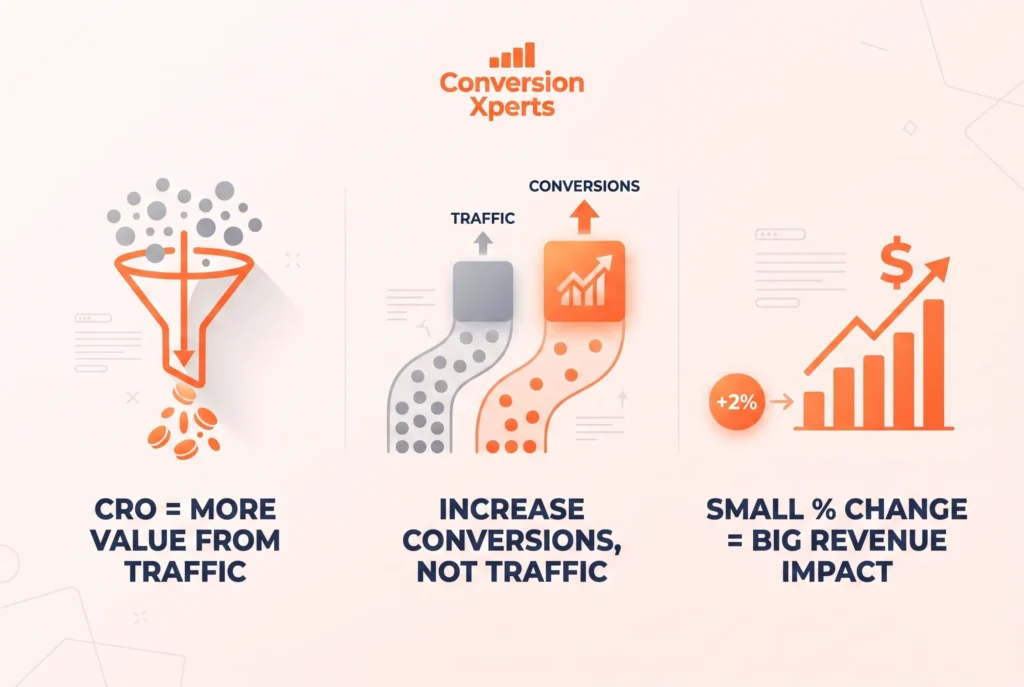
For example, if your site received 10,000 visitors in a month and 200 of them made a purchase, your ecommerce conversion rate would be 2.0%. Simple math, but the implications are enormous. A single percentage point improvement on a site doing one million monthly visitors can mean hundreds of thousands of dollars in additional revenue.
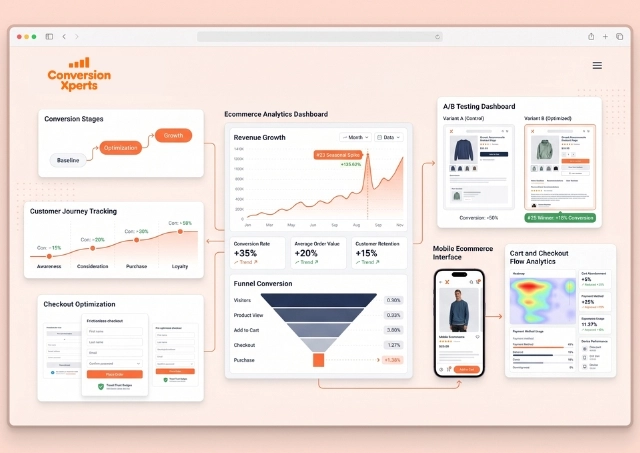
Macro vs. Micro Conversions
Not every conversion needs to be a sale. Conversion rate optimization professionals typically separate conversions into two categories.
Macro conversions are the primary goals: completed purchases, booked demos, and submitted applications. These are the actions that directly tie to revenue.
Micro conversions are smaller steps that signal intent: product page views, add-to-cart events, email sign-ups, and video plays. Tracking micro conversions gives you a far richer picture of where visitors are dropping off in your funnel. According to data published by Smart Insights in 2024, sessions that include a product page view approach nearly 50 percent of all sessions on typical ecommerce sites, making product page engagement a critical micro-conversion benchmark in its own right.
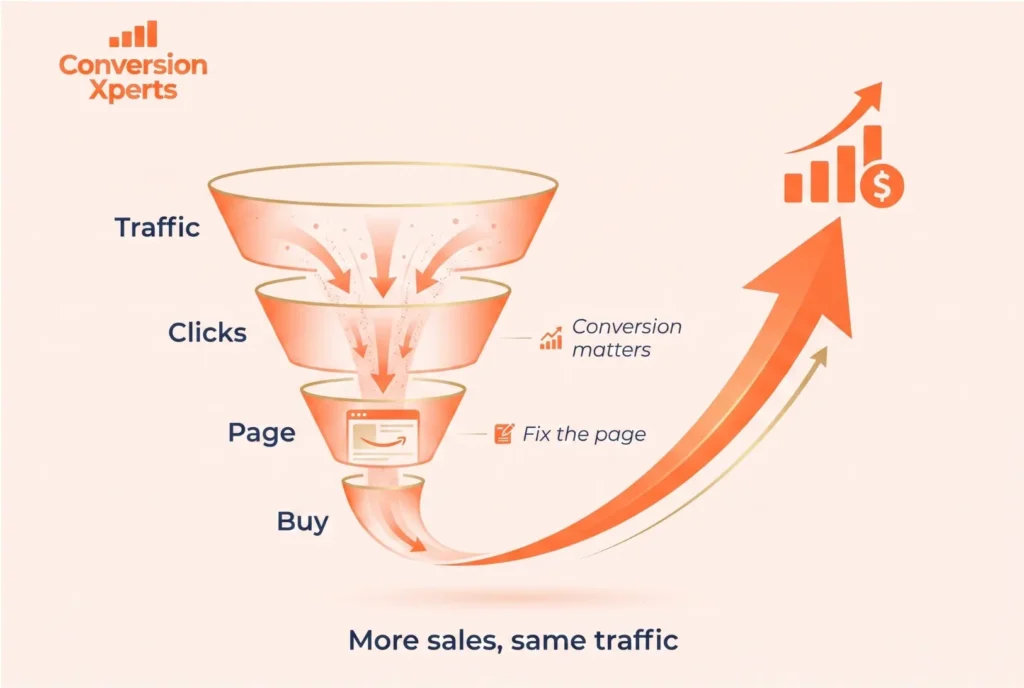
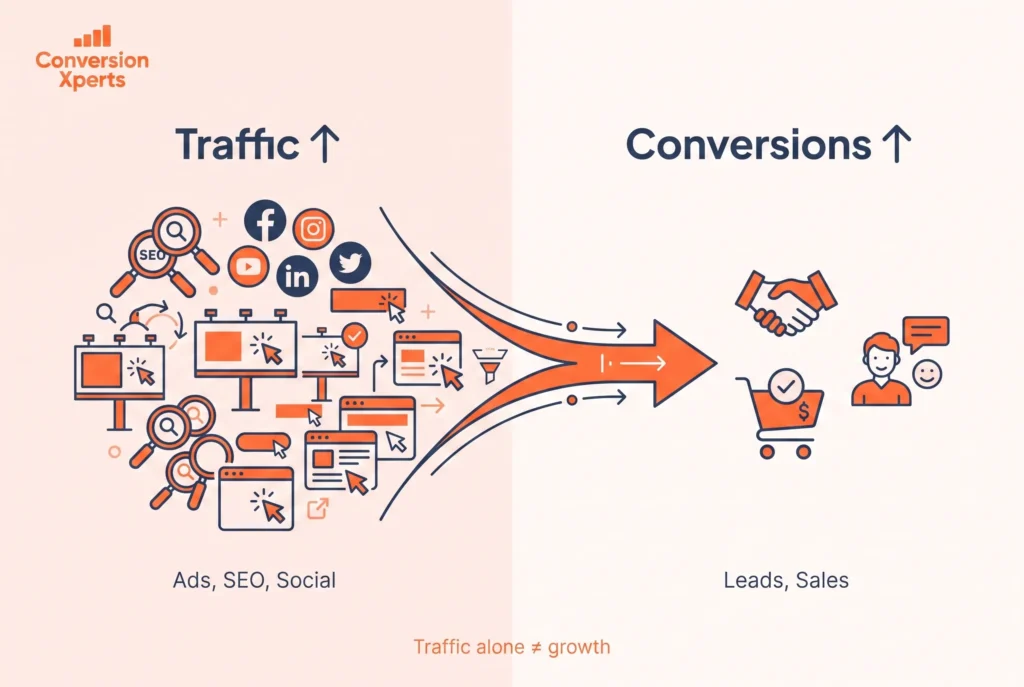
Why Conversion Rate Matters More Than Traffic
Many businesses pour budget into paid search and social ads chasing traffic volume, while ignoring the fact that a leaky funnel erases all of those gains. Consider two scenarios: a site converting at 1% with 50,000 monthly visitors generates 500 sales. The same site at 3% generates 1,500 sales with zero increase in ad spend. Doubling your conversion rate triples your revenue. No traffic campaign delivers that kind of leverage.
Average Website Conversion Rate Benchmarks by Industry (2025)
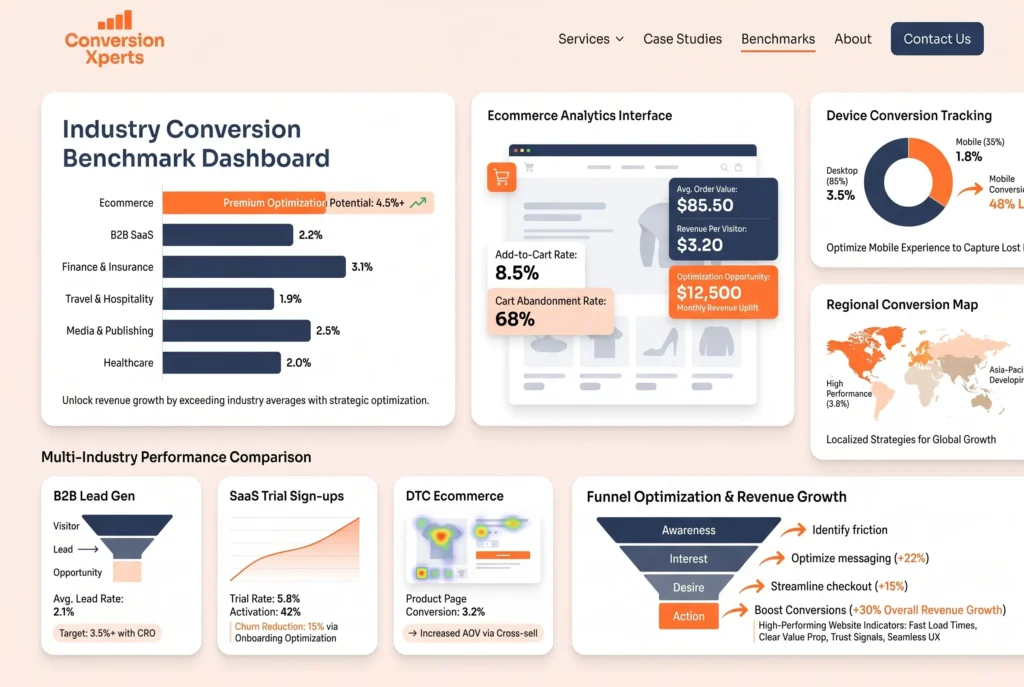
The average website conversion rate is highly contextual. A luxury watch retailer should never measure itself against a food delivery app. Industry, price point, traffic source, and device all shape what “normal” looks like.
Overall Average Conversion Rate
The global average ecommerce conversion rate stood at approximately 2.58% in 2025, according to aggregated data from IRP Commerce and multiple benchmark studies. The US market specifically sits close to that average at around 2.57%. However, the top 10 percent of performing websites convert at 11% or higher, according to Invesp research, which reveals just how much room exists between the average performer and the best.
Across all website types (not just ecommerce), the average conversion rate is approximately 2.35%. Legal services lead with 3.8%, hotels and resorts follow at 3.6%, and healthcare sits at 3.1%, according to FirstPageSage 2024 data. B2B SaaS and software development trail near the bottom at 1.1% and 1.2% respectively, reflecting the complexity of longer sales cycles in those industries.
Ecommerce Conversion Rate by Industry
The table below summarizes typical ecommerce conversion rate benchmarks by product category based on aggregated 2024 to 2025 data from Statista, IRP Commerce, and Dynamic Yield.
| Industry | Average Conversion Rate | Notes |
Food and Beverage | 6.0% to 7.9% | Highest converting category, driven by habitual repeat purchases |
Health and Wellness | 1.87% to 4.2% | Broad range depending on product price and complexity |
Beauty and Personal Care | 3.0% to 6.8% | Low price point and high purchase frequency drives conversions |
Fashion and Apparel | 1.01% to 2.2% | Wide range; luxury brands sit at the lower end |
Home and Garden | 1.7% to 2.9% | Moderate average, influenced by seasonal demand |
Electronics | 1.0% to 2.5% | High AOV suppresses conversion; trust is a major factor |
Sporting Goods | 1.4% to 3.0% | Loyalty and community drive repeat purchase conversions |
B2B Ecommerce | 1.0% to 2.0% | Long consideration periods pull averages down |
Regional Conversion Rate Benchmarks
Geography matters more than most marketers realize. According to 2025 benchmark data from Nector, the Americas region leads global performance with a conversion rate of approximately 3.14%, while the EMEA region shows strong performance at around 4.11% in some datasets. These differences reflect digital infrastructure maturity, consumer trust in online transactions, and payment method adoption.
The United Kingdom sits at a notably strong 4.1% average, according to data compiled by ElectroIQ in 2024, supported by a well-established ecommerce environment and high consumer confidence in online purchases.
Conversion Rate by Device
Device type is one of the most significant and underappreciated conversion variables.
According to Statista data from December 2023, tablets achieve the highest conversion rate among devices at approximately 3.1%, followed closely by desktop at 2.8%. Mobile phones also average around 2.8% in some datasets, though other benchmark studies show mobile lagging desktop by a wider margin.
Landbase’s 2025 analysis shows desktop converting at approximately 4.8% while mobile sits at 2.9%. The discrepancy across datasets reflects differences in tracking methodology and industry mix, but the directional insight is consistent: mobile converts at a lower rate than desktop despite driving the majority of traffic. This gap represents one of the highest-ROI optimization opportunities available to any ecommerce business.
What Is a Good Ecommerce Conversion Rate
A good ecommerce conversion rate depends entirely on your baseline, your industry, and your traffic quality. That said, there are practical thresholds that most CRO professionals use as directional benchmarks.
The Three-Tier Framework
Below 1%: Your site has significant friction. Checkout issues, trust problems, or a mismatch between your traffic source and your offer are likely culprits. Immediate attention is required.
1% to 3%: This is where the majority of ecommerce sites sit. You are performing at or near the industry average. Incremental optimization through A/B testing, page speed improvement, and checkout streamlining can move you into a stronger range.
3% to 5%: You are outperforming the typical ecommerce conversion rate for most categories. Your fundamentals are strong. At this stage, advanced personalization and segmentation strategies create compounding gains.
Above 5%: You are in the top tier of performers. This level typically requires years of systematic testing, strong brand loyalty, and a highly tuned user experience.
Amazon maintains an extraordinary conversion rate of approximately 10 to 13%, a figure that stems from one-click purchasing, Prime membership benefits, comprehensive reviews, and unmatched logistics infrastructure. Using Amazon as a benchmark for a standard ecommerce store is misleading. A far more relevant comparison is your own historical performance and your direct industry peers.
Seasonal Variation in Average Conversion Rate
Conversion rates are not static. A conversion rate peaks seasonally during high-purchase periods. Data from ElectroIQ shows that ecommerce conversion rates peaked at 2.27% in November 2023, driven by Black Friday and holiday shopping. Understanding your seasonal curve allows you to allocate CRO investment strategically rather than treating every month the same way.
Key Factors That Affect Your Web Conversion Rate
Your web conversion rate is the output of dozens of interacting variables. Understanding which factors carry the most weight allows you to prioritize where to invest your optimization resources.
Page Speed and Technical Performance
Site speed is arguably the most impactful technical variable. According to data cited by Landbase from 2025, sites that load in one second achieve conversion rates approximately three times higher than sites that load in five seconds. Every additional second of load time eats into your conversion rate and compounds across thousands of sessions.
Google’s Core Web Vitals now factor into search rankings as well, meaning slow pages suffer twice: once in traffic loss and again in conversion loss. Investing in hosting quality, image optimization, CDN deployment, and script management is therefore both an SEO and a CRO decision.
Mobile User Experience
Mobile devices drive approximately 60% of web traffic globally, yet they consistently convert below desktop in most ecommerce categories. The mobile conversion gap is not inevitable. It is a product of poor mobile UX: small tap targets, complex checkout flows, slow load times on cellular connections, and forms that were clearly designed for keyboards.
Merchants who close the mobile gap through one-click checkout options, mobile wallet integration, and simplified navigation can unlock massive revenue gains without acquiring a single new visitor.
Trust Signals and Social Proof
Conversion psychology research consistently shows that trust is the primary barrier in online purchasing. Visitors convert when they believe the product will deliver, the transaction is secure, and the company will honor its commitments if something goes wrong.
Trust signals include customer reviews and ratings, recognized security badges, clear return policies, visible contact information, and social proof indicators like “X people bought this today.” According to PowerReviews data, review volume has a direct and measurable impact on product page conversion rate. Products with zero reviews convert significantly below products with even a handful of genuine customer testimonials.
Checkout Friction and Cart Abandonment
Cart abandonment is the single most visible symptom of conversion failure. Baymard Institute’s comprehensive analysis of 49 studies places the global average cart abandonment rate at 70.19%. That means seven out of every ten shoppers who add a product to their cart never complete the purchase.
The reasons are well-documented: unexpected shipping costs, forced account creation, a checkout process that feels too long, concerns about payment security, and limited payment method options. Each of these represents a specific, addressable fix rather than a vague problem.
Copy Readability and Content Quality
The Unbounce Conversion Benchmark Report, drawing on data from over 57 million conversions across 41,000 landing pages, found that copy written at a 5th to 7th grade reading level converts at 11.1%, which is 56% higher than copy written at an 8th to 9th grade level and more than twice the conversion rate of professional-level writing at 5.3%. The data is unambiguous: simpler language converts better, across industries and page types.
Research from The Science Survey referenced in the same report shows that attention spans have decreased from roughly 2.5 minutes in 2004 to just 47 seconds in 2024. Visitors decide whether to engage within moments of landing on your page. Clarity, brevity, and a compelling value proposition are not nice-to-haves. They are revenue levers.
Personalization and Segmentation
AI-driven personalization has become one of the most powerful tools available for improving website conversion rate. Amazon’s recommendation engine is the canonical example, but the principle scales to businesses of all sizes. Visitors who see products, offers, and messaging tailored to their behavior, preferences, or demographic segment convert at materially higher rates than those exposed to generic content.
McKinsey research published in 2023 confirmed that businesses with leading personalization capabilities generate 40% more revenue from personalization than average players. For ecommerce operators, this manifests in recommendation engines, dynamic pricing, personalized email recovery campaigns, and behavior-triggered popups.
Proven Strategies to Improve Your Website Conversion Rate
Improving your website conversion rate is not a single project. It is a discipline, a systematic and ongoing program of hypothesis formation, testing, and implementation. The businesses with the highest conversion rates got there by running more tests than their competitors, not by guessing right once.
Build a Structured A/B Testing Program
A/B testing is the gold standard for conversion rate optimization. The principle is simple: show two versions of a page element to different visitor segments simultaneously, measure which version produces more conversions, and implement the winner.
The critical nuance that separates effective testing programs from wasteful ones is statistical significance. For a test run at a 2% baseline conversion rate, you need approximately 50,000 visitors per variant to achieve statistically significant results. Running tests on low-traffic pages without reaching that threshold produces noise, not signal.
Data from Convertibles, who analyzed 30 or more Shopify Plus A/B tests, shows that individual winning experiments generated between $6,000 and $386,000 in additional monthly revenue. The highest-impact tests focused on product page layout, navigation structure, and pricing strategy rather than cosmetic changes like button color.
Optimize Your Checkout Process
Removing friction from checkout is the most direct path to improving ecommerce conversion rate for most stores. Practical interventions include:
Offering guest checkout removes the forced account creation barrier, which Baymard Institute identifies as one of the top five reasons for cart abandonment. Displaying a progress indicator reduces checkout anxiety. Offering multiple payment methods, including digital wallets like Apple Pay and Google Pay, captures mobile shoppers who are reluctant to type card details on a small screen. Adding real-time chat support on checkout pages provides an immediate response to the final objections that prevent purchases.
Improve Landing Page Relevance
A landing page that closely matches the intent of the ad or search query that brought a visitor there will always outperform a generic homepage. This is called message match, and its impact on conversion rate is substantial.
If someone clicks a Facebook ad for “women’s running shoes on sale,” they should land on a page showing exactly that. Every step of disconnection between the ad promise and the landing page reality erodes trust and kills conversions.
Use Heatmaps and Session Recordings
Quantitative data tells you what is happening on your site. Qualitative tools like heatmaps and session recordings tell you why. Tools such as Hotjar and Microsoft Clarity reveal where users click, where they stop scrolling, where they move their cursor in confusion, and at which point they abandon the page.
This kind of behavioral insight is invaluable for prioritizing A/B test hypotheses. Rather than testing arbitrary elements, you test the specific friction points you can actually observe in visitor behavior.
Leverage Email Recovery Campaigns
Given that 70% of carts are abandoned, an automated email recovery sequence is one of the highest-ROI investments any ecommerce operator can make. A well-designed three-email recovery sequence, sent at one hour, 24 hours, and 72 hours after abandonment, can recover between 5% and 15% of abandoned carts depending on industry and offer.
Personalized recovery emails that reference the specific product left in the cart, and optionally include a limited-time offer, consistently outperform generic reminder emails. This is one of the areas where AI-driven personalization delivers the clearest and most measurable return.
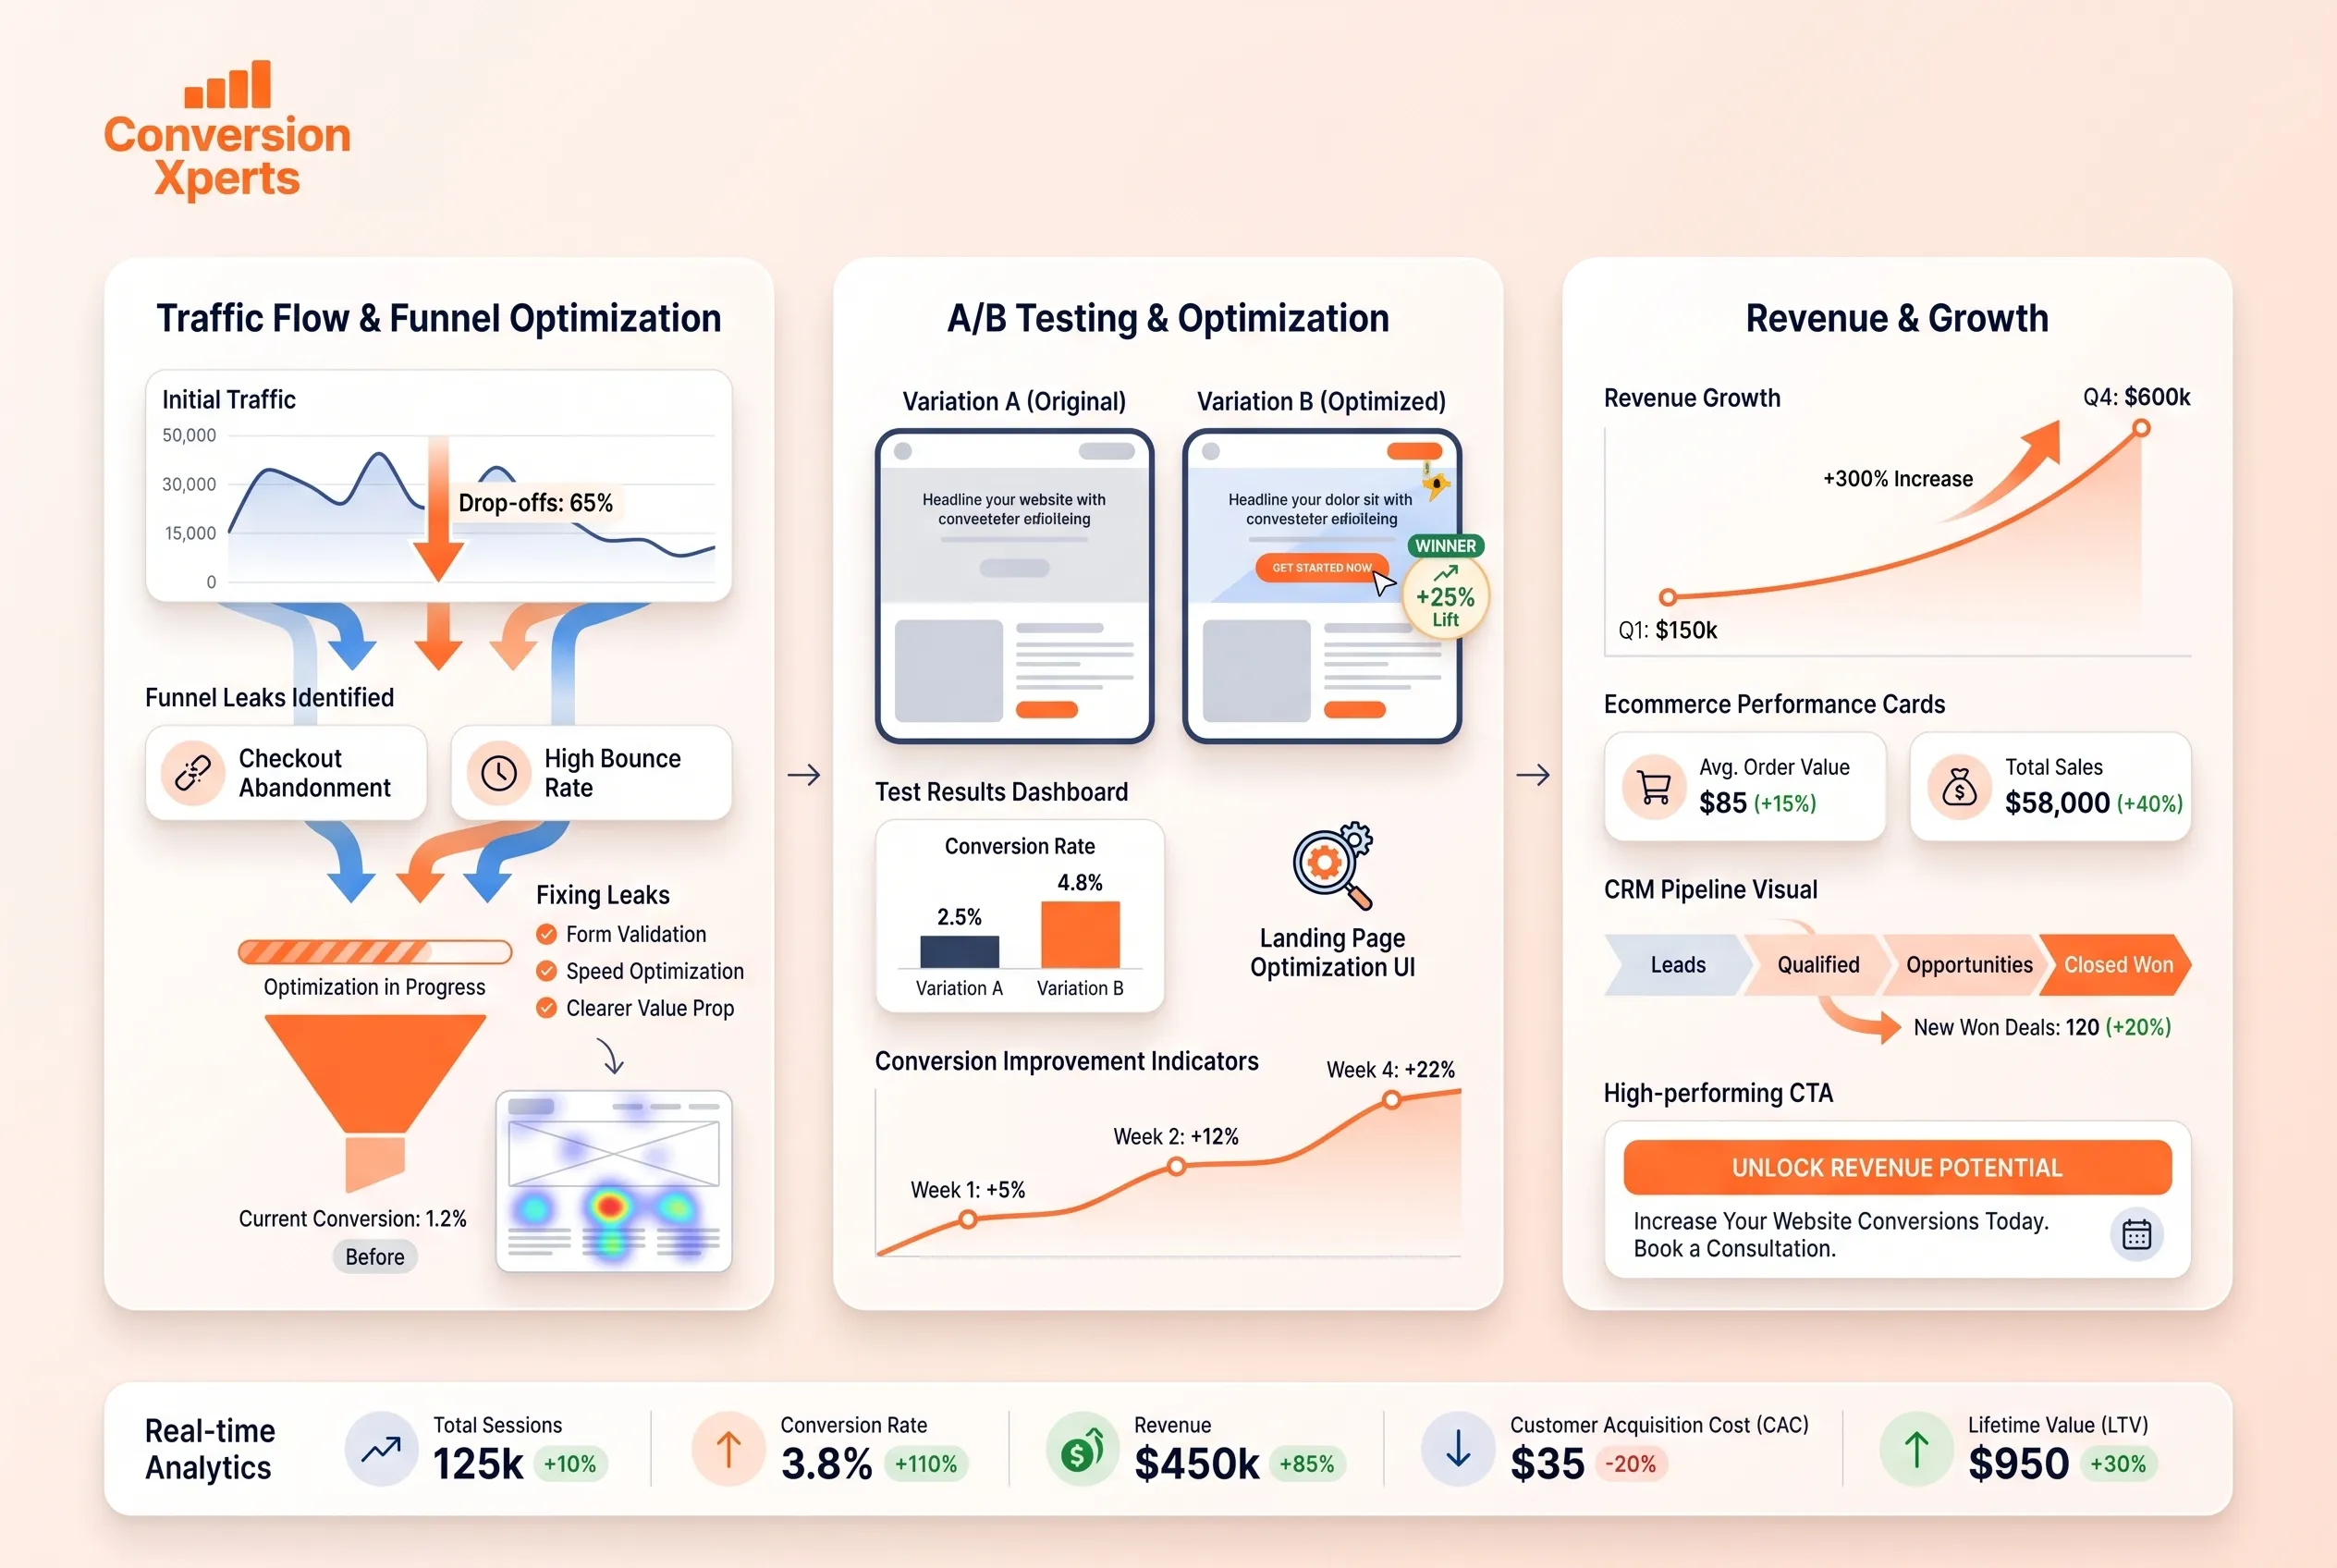
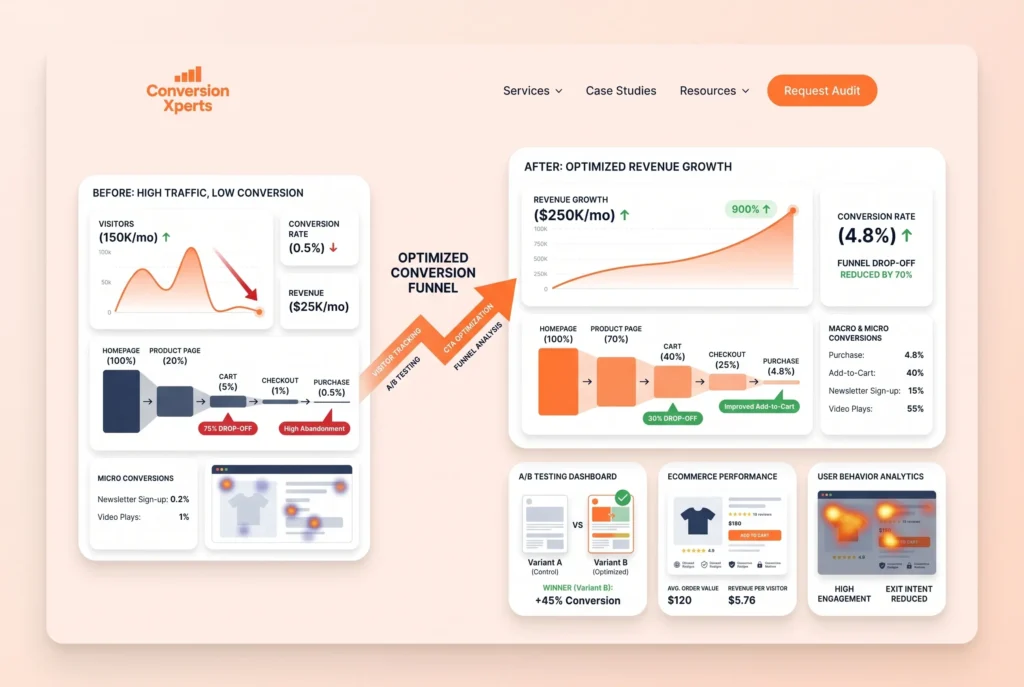
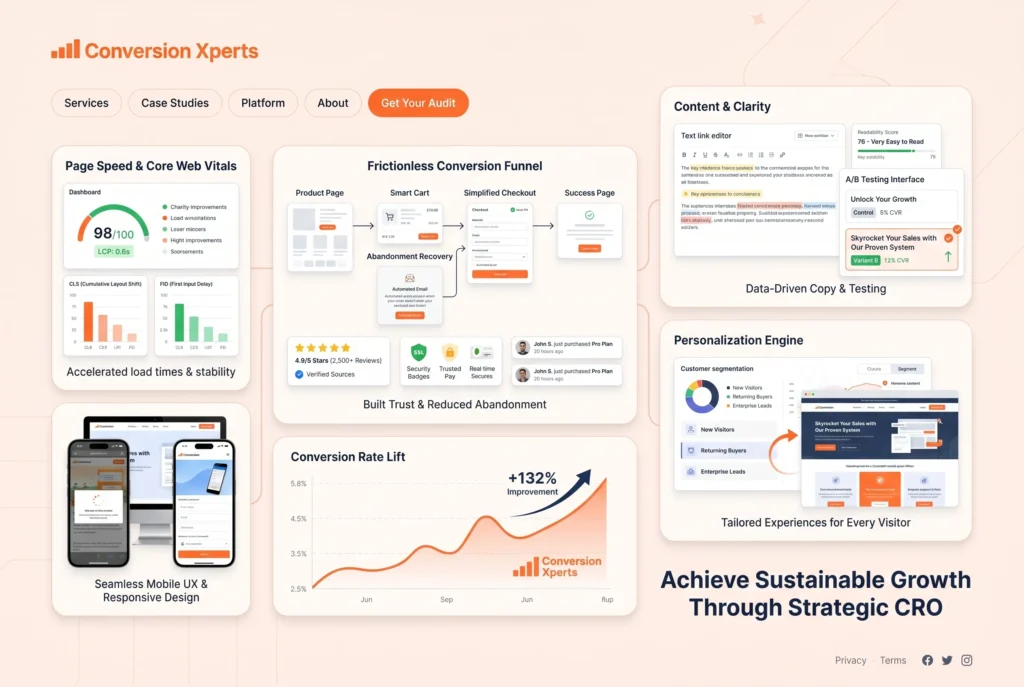
How ConversionXperts Helps You Beat the Average Conversion Rate
If your web conversion rate is sitting at or below the industry average, the gap between where you are and where you could be represents real, recoverable revenue. ConversionXperts exists to close that gap.
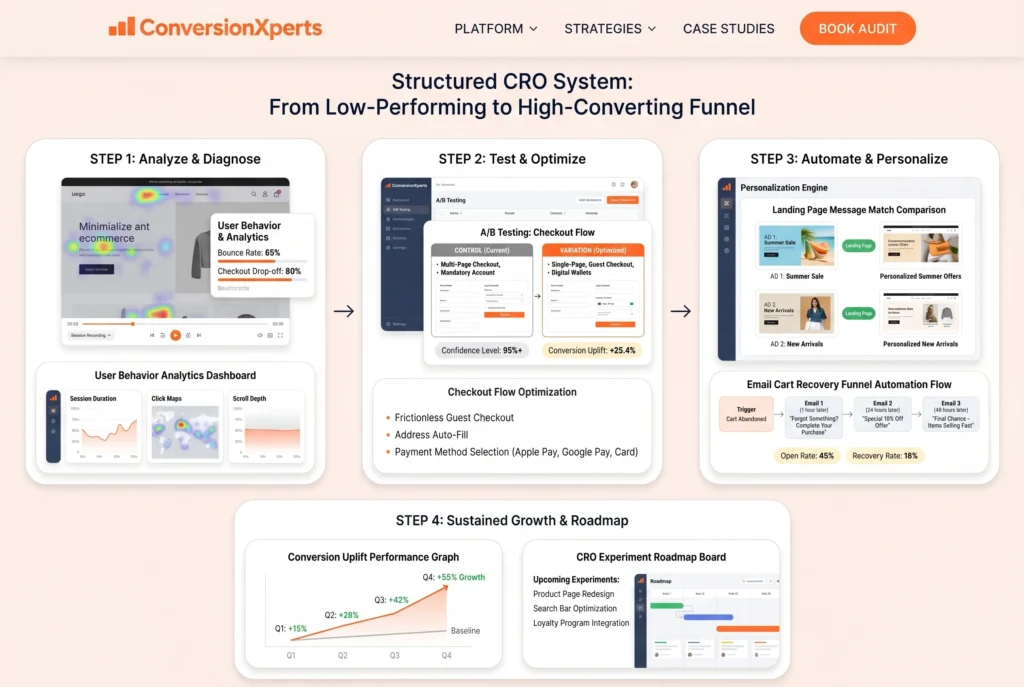
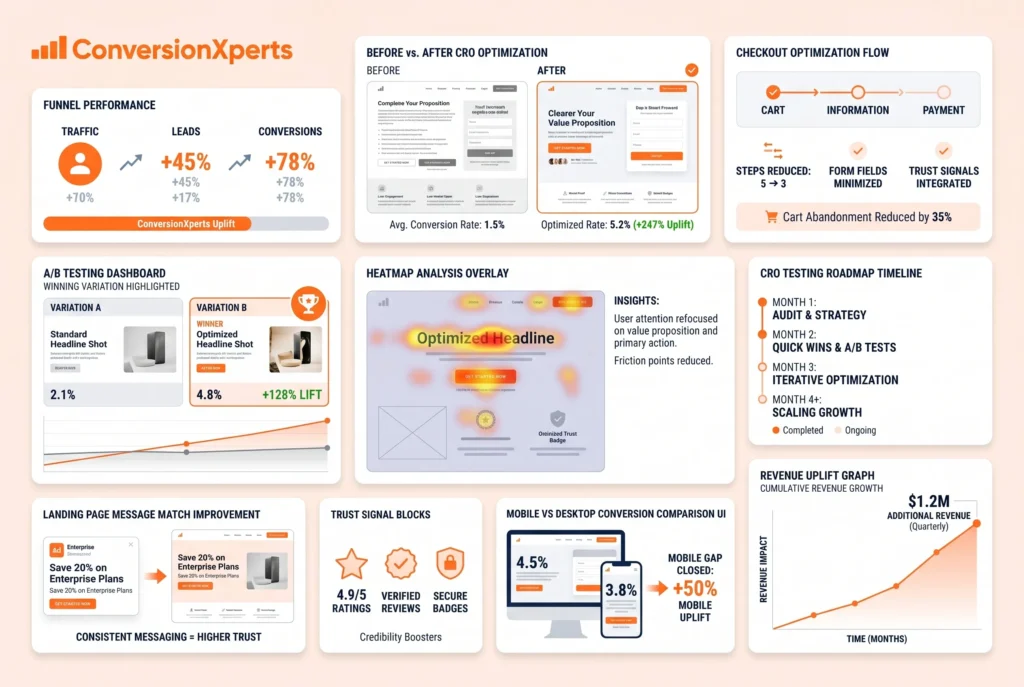
ConversionXperts is a dedicated conversion rate optimization agency that works with ecommerce businesses and lead generation websites to systematically improve their website conversion rate through data-driven testing, behavioral analysis, and UX design. Rather than offering generic marketing audits, their team runs the full CRO lifecycle: analytics review, funnel mapping, qualitative research, hypothesis formation, A/B and multivariate testing, and iterative implementation.
Their work typically spans the areas that move the needle most: checkout experience, product page optimization, landing page message match, trust signal architecture, and mobile UX. For businesses that have hit a traffic plateau or are finding that paid acquisition costs are climbing faster than revenue, CRO represents the highest-leverage investment available.
The ConversionXperts approach is built around one principle: every decision is tested before it is implemented at scale. This removes the guesswork that causes most internal CRO efforts to stall and ensures that optimization investments compound over time rather than delivering one-off results.
If you are serious about pushing past the typical ecommerce conversion rate and building a conversion program that creates a lasting competitive advantage, ConversionXperts offers the expertise and structured process to get there. Visit ConversionXperts.com to explore how their team approaches CRO for businesses at your stage of growth.