What Is the Typical Ecommerce Conversion Rate? The Ultimate 2026 Benchmarks Guide
What Is an Ecommerce Conversion Rate and How Is It Calculated
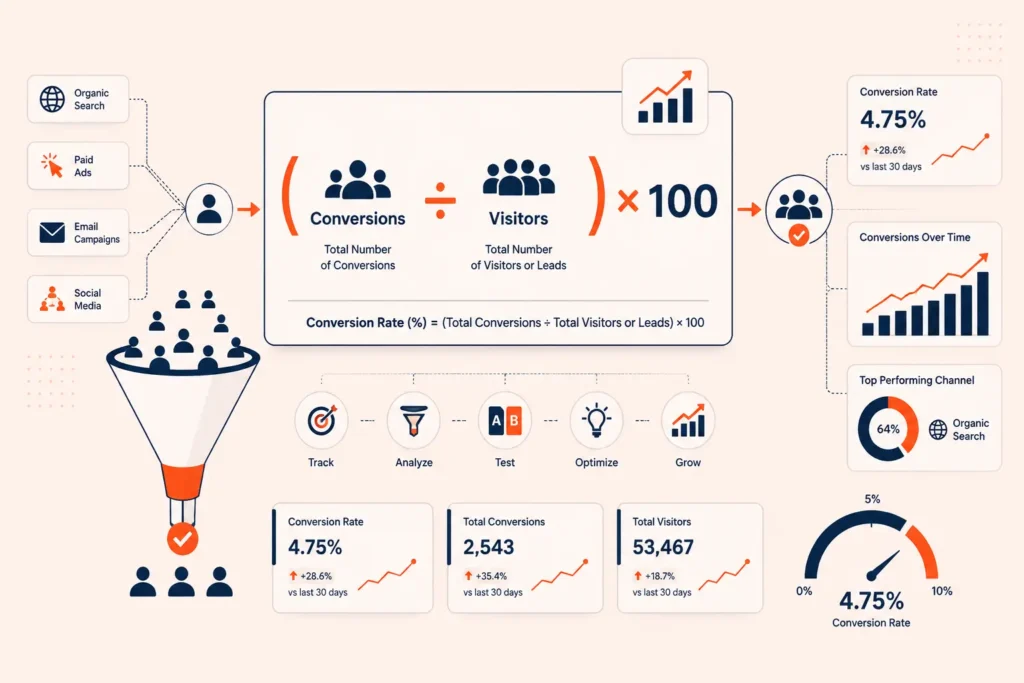
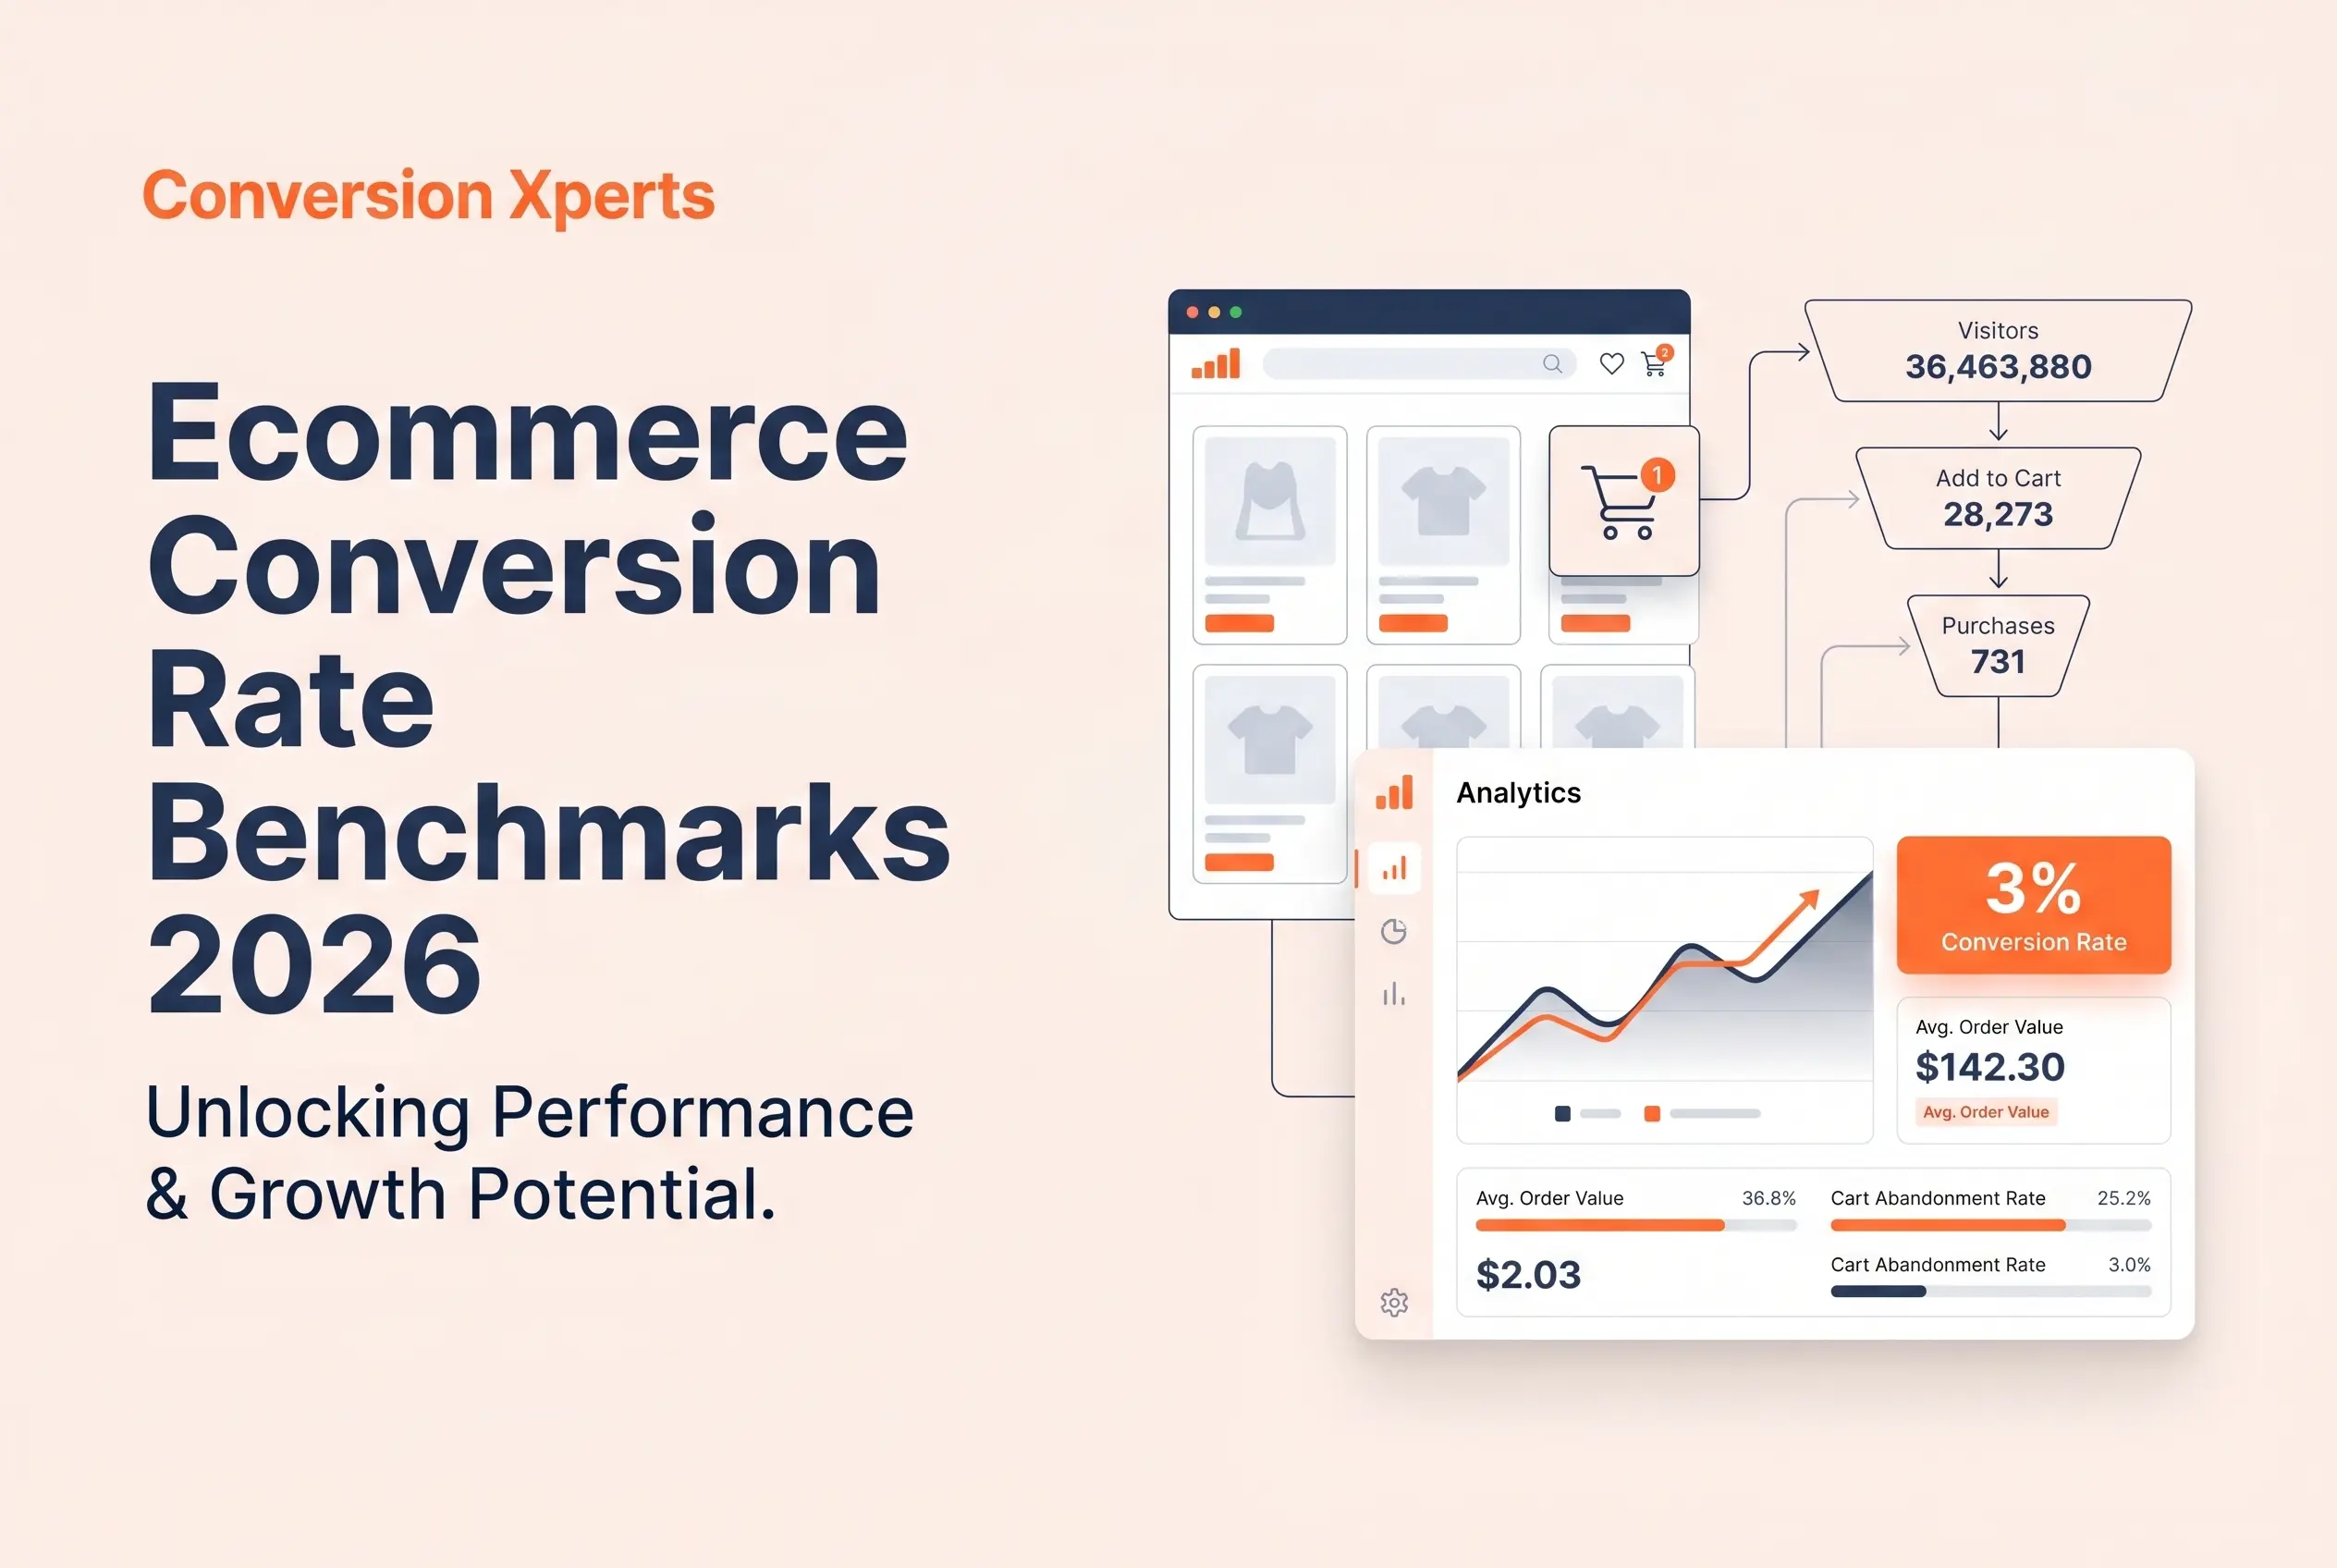
The ecommerce conversion rate is the percentage of website visitors who complete a desired action, most commonly a purchase, out of the total number of sessions or unique visitors in a given time period.
The formula is simple:
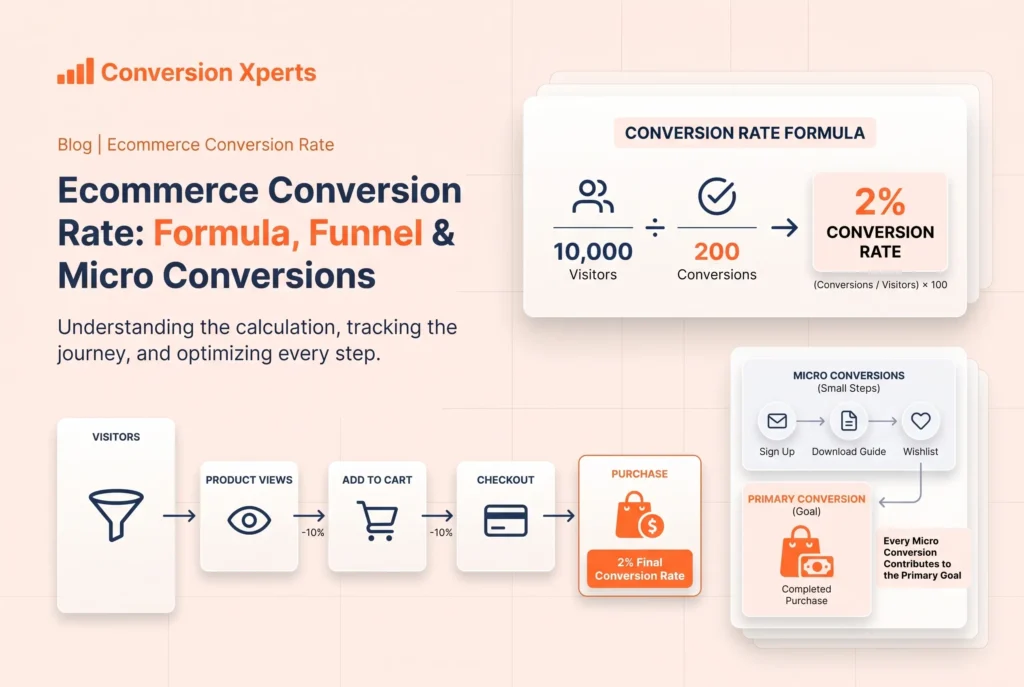
Conversion Rate = (Number of Conversions divided by Total Visitors) multiplied by 100
So if your store receives 10,000 visitors in a month and 200 of them make a purchase, your conversion rate is 2%.
That said, “conversion” does not always mean a sale. Depending on your goals, you might track micro-conversions such as email sign-ups, product page views, add-to-cart actions, or checkout initiations. These smaller signals of intent are just as important because they reveal where visitors are dropping off before they ever reach the buy button.
Why the Ecommerce Conversion Rate Is the Most Important KPI You Track
Your conversion rate is essentially a report card for the entire customer experience. A store with high traffic but a low conversion rate is losing money at scale. Every ad dollar you spend, every blog post you publish, every influencer you partner with, all of it becomes more or less profitable depending on how well your site converts.
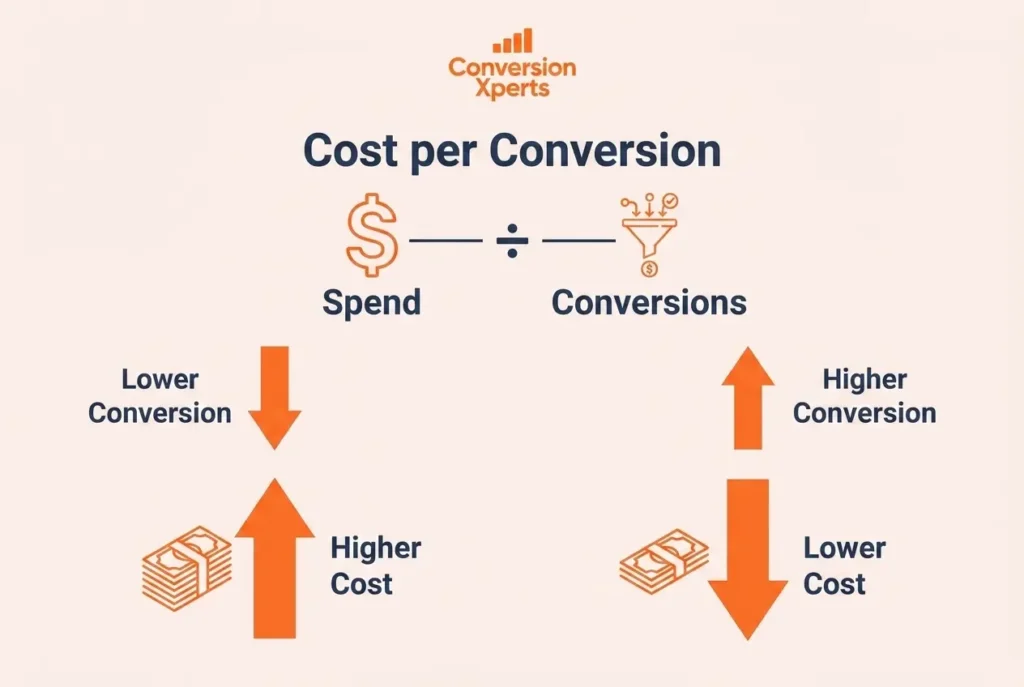
According to a 2025 analysis from Triple Whale based on over 33,000 brands, the mean cost per acquisition increased by 8.64% in 2025, making conversion efficiency more critical than ever. When acquiring customers costs more, converting the traffic you already have becomes the highest-return investment you can make.
Primary vs. Micro Conversions: Tracking the Full Funnel
Micro-conversions are the steps that signal purchase intent, such as adding a product to cart or signing up for a newsletter. These are leading indicators. For most stores, tracking only the final purchase gives you an incomplete picture. You need to know your add-to-cart rate (industry average around 7.52%), your checkout initiation rate, and your checkout completion rate separately, because the leak could be happening at any one of those stages.
What Is the Typical Ecommerce Conversion Rate in 2025
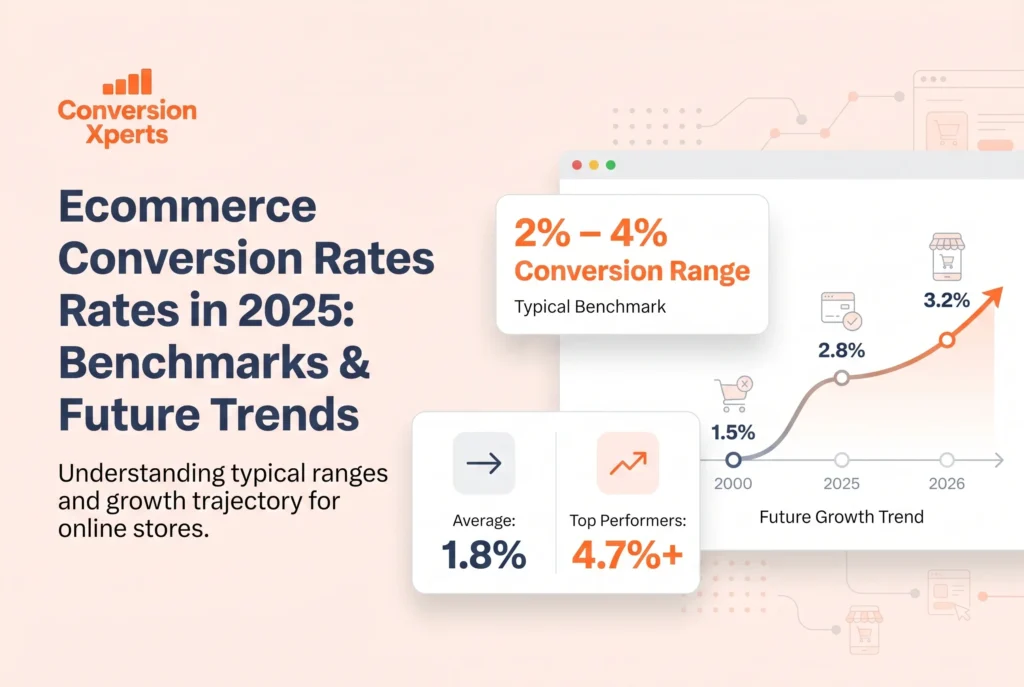
The typical ecommerce conversion rate in 2025 sits in a range rather than a single fixed number, and understanding this range is the first step to honest benchmarking.
The global ecommerce conversion rate of 2.5% tells you almost nothing useful. Segment by industry, device, and traffic source for useful benchmarks. With that caveat firmly in place, here is what the data actually shows.
According to IRP Commerce, the all-industry average ecommerce conversion rate is about 1.89%. Shopify’s research confirmed that average conversion rates for orders are often cited as between 2.5% and 3%. Meanwhile, global ecommerce conversion rates averaged 1.65% in 2024, with top performers achieving 4.7% or higher.
Why do these numbers vary so much between sources? Because different platforms measure different merchant sizes, industries, and geographies. Larger, more established brands with loyal customers naturally convert higher. Newer stores pulling cold traffic from paid ads convert much lower.
The Historical Evolution of Ecommerce Conversion Rates
Understanding where conversion rates came from helps you see where they are going.
From 2000 to 2010, static interfaces and limited trust led to conversion rates of 1.5% to 2.5%. From 2010 to 2020, improved UX and payment options boosted rates to 2.5% to 4%. From 2020 to 2024, pandemic-driven spikes stabilized at 3% to 4.2% post-COVID. In 2025, ongoing growth in personalization and mobile optimization maintains conversion rates between 2% and 4%.
The uptick in recent years reflects widespread adoption of personalization tools and better checkout experiences. However, increased competition and ad costs mean merchants need higher conversion rates just to maintain profitability.
What the Data Says About 2026 and Beyond
Ecommerce conversion rates are stabilizing in the 2.5% to 3% range for established stores in 2026. The trajectory is driven by AI-powered personalization and improved mobile experiences. Stores that fail to optimize for mobile and personalization will likely see their rates fall below this range as consumer expectations continue to rise.
Ecommerce Conversion Rate Benchmarks by Industry
Industry is the single biggest variable in ecommerce conversion benchmarking. Comparing your rate to an out-of-context average is like comparing a sports car to a truck on fuel efficiency. They serve different purposes and operate under different conditions.
Here is a comprehensive breakdown of ecommerce conversion rate benchmarks by industry in 2025:
| Industry | Average Conversion Rate |
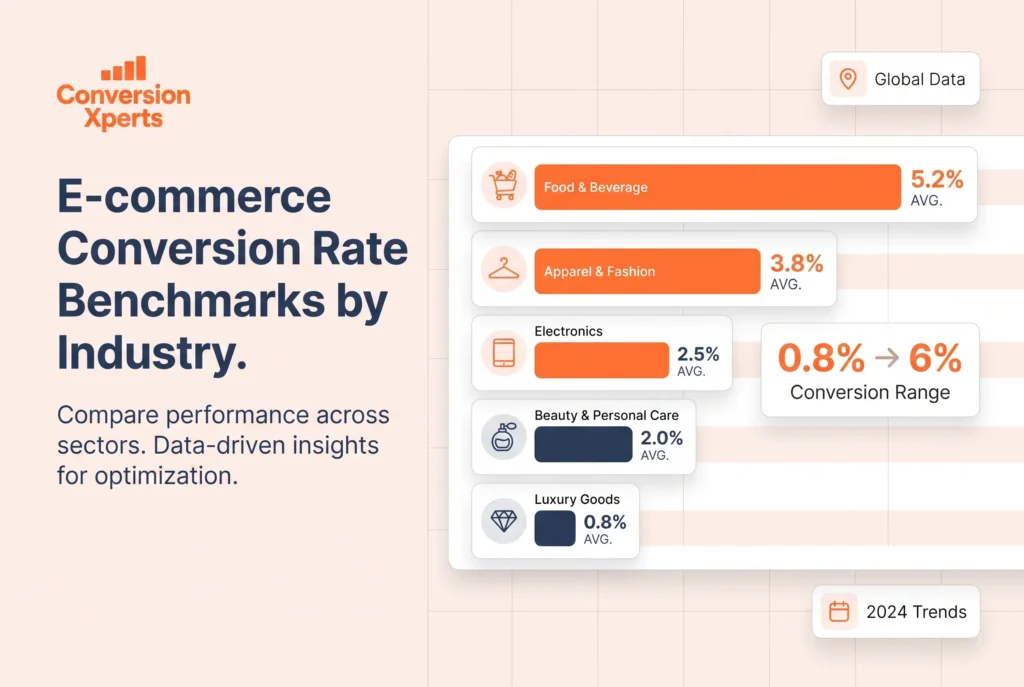
Food and Beverage | 4.5% to 6.0% |
Arts and Crafts | 4.5% to 5.1% |
Health and Beauty | 3.0% to 4.0% |
Pet Supplies | 2.5% to 3.5% |
Apparel and Fashion | 2.0% to 3.0% |
Home and Garden | 1.4% to 2.0% |
Electronics | 1.0% to 2.0% |
Luxury and Jewelry | 0.8% to 1.2% |
Baby and Child Products | 0.7% to 1.5% |
Sources: Triple Whale 2025 Ad Performance Report, IRP Commerce 2024, Convertibles Shopify Plus A/B Tests 2025.
Why Food and Beverage Leads the Pack
Food and Beverage can expect a conversion rate of around 4.9% to 6.22%. The reason is simple: these are consumable, habitual purchases. Customers already know what they want. The decision fatigue is low, the price points are familiar, and repeat purchase behavior is built in. Subscription meal kits, for instance, convert at even higher rates because of the urgency and personalization they layer on top.
Why Luxury and High Consideration Categories Convert Lower
Luxury goods naturally have longer decision cycles. A shopper buying a $4,000 watch is not going to convert on their first visit. They will research for weeks, compare, read reviews, and possibly visit a physical store before purchasing online. Certain product categories naturally have lower conversion rates due to high consumer consideration. Luxury goods have longer sales cycles because customers typically do more research before purchasing.
This is not a failure of your site. It is a function of the category. For luxury stores, the right metric to optimize is often time-to-conversion and return visitor purchase rate rather than first-visit conversion alone.
Ecommerce Conversion Rates by Region
Geography matters significantly. The Americas region stands out with a strong conversion rate of 3.14%, setting the benchmark for other regions in 2025. Meanwhile, Great Britain’s ecommerce sector has an average conversion rate of 3.4%, while the corresponding number for the EMEA region is 1.1%.
Mature markets with high consumer trust in online shopping, well-established payment infrastructure, and fast logistics networks consistently outperform emerging markets. This is critical context for any brand with a global audience.
Seasonal Spikes: When Conversion Rates Surge
Conversion rates are not static across the calendar year. During Black Friday and Cyber Monday 2023, ecommerce conversion rates surged to 6.4%, a significant increase compared to the usual range of 1% to 4% throughout the year.
Peak seasons are your highest-leverage conversion moments. A store sitting at 2% during ordinary months needs a specific BFCM conversion strategy to capture that seasonal spike, including urgency messaging, limited offers, faster checkout flows, and pre-loaded wish lists for returning customers.
Good Ecommerce Conversion Rate: What Top Performers Look Like
A good ecommerce conversion rate is not just about hitting a number. It is about consistently outperforming your own baseline and pushing toward the top quartile of your specific industry.
If your store’s conversion rate is above 3%, you are already among the very best-converting online stores. Stores hitting 3% to 4% are typically optimized on fundamentals. Above 4% often means strong brand, great UX, and savvy CRO work.
So what does a genuinely top-performing store look like in practice?
The Amazon Effect: What Best-in-Class Conversion Looks Like
Amazon boasts a 13% conversion rate, which is nearly 7 times the average industry standard. This is not magic. It is the result of decades of UX refinement, one-click purchasing, extensive social proof, Prime membership loyalty, and unmatched logistics. Most brands cannot replicate all of these, but they can reverse-engineer the core principles: remove friction, build trust, and make buying feel effortless.
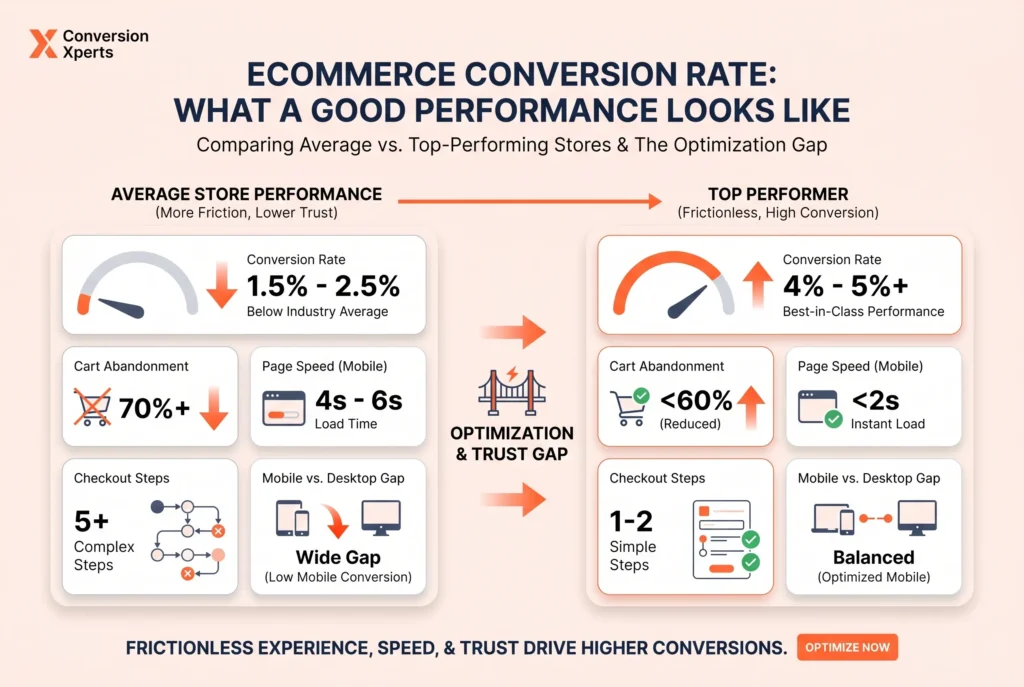
The Difference Between Average and Top Performing Stores
Here is a side-by-side comparison of how average stores and top-performing stores differ across key metrics:
| Metric | Average Store | Top Performer |
Conversion Rate | 1.9% to 2.5% | 4% to 6% |
Cart Abandonment Rate | 70% to 75% | Below 55% |
Mobile vs Desktop Gap | Mobile 50% lower | Near parity |
Page Load Time | 4 to 6 seconds | Under 2 seconds |
Checkout Steps | 5 or more | 2 to 3 |
Email Recovery Rate | 10% to 15% | 20% to 30% |
The gap between average and great is not a mystery. It is almost always explained by friction, trust, and speed.
Micro-Benchmarks You Should Also Track
A good ecommerce conversion rate is supported by healthy micro-benchmarks throughout the funnel. The average add-to-cart rate is about 7.52%, with average mobile conversion lagging at 1.8% versus desktop’s 3.9%. If your add-to-cart rate is strong but your checkout completion is weak, you have a checkout problem, not a product problem. These micro-benchmarks tell you exactly where to focus.
Key Factors That Influence Your Ecommerce Conversion Rate
Understanding what drives your conversion rate up or down is as important as knowing the number itself. These are not abstract variables. They are specific, actionable levers.
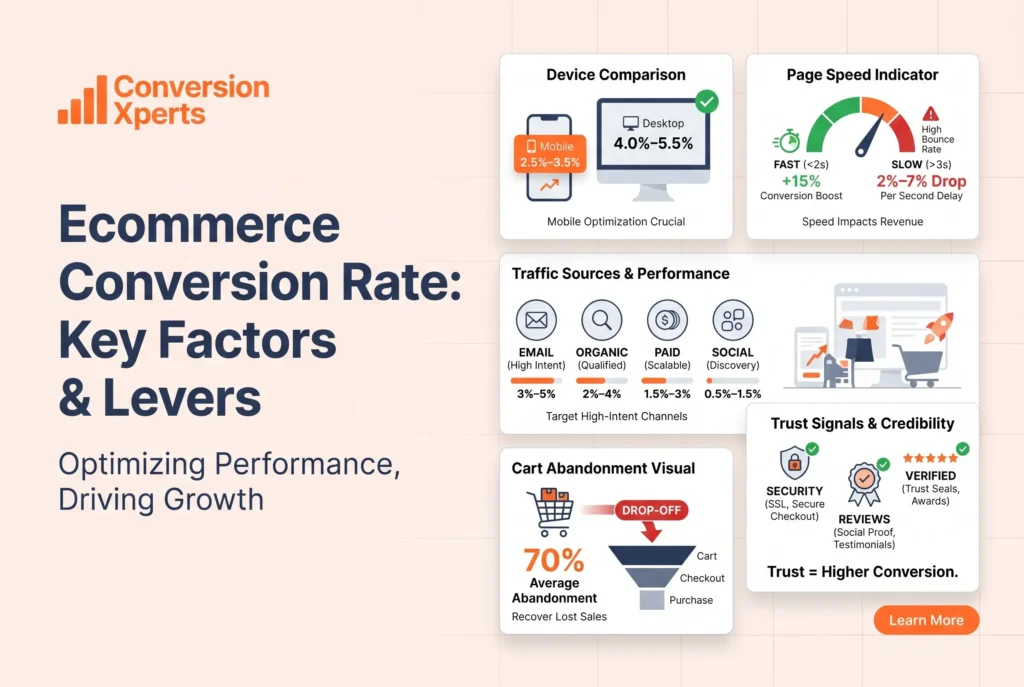
Device Type: The Mobile Gap Is Closing Fast
Mobile commerce has dominated traffic for years, but desktop has historically dominated conversions. That gap is finally narrowing. Desktop and mobile are converging toward approximately 2.8% each in 2025, driven by one-tap payment adoption including Shop Pay, Apple Pay, and Google Pay, as well as Shopify’s native mobile checkout improvements.
Desktop converts at roughly 1.7 times the rate of mobile. If mobile brings in 70% of your traffic but only accounts for 50% of your revenue, you have found a massive opportunity.
Optimizing your mobile checkout is one of the highest-return activities any ecommerce team can pursue in 2025. The brands closing the mobile conversion gap are winning market share quietly while competitors ignore it.
Page Speed: Every Second Costs You Sales
Speed is not a technical nice-to-have. It is a direct revenue driver. Research consistently shows that for every additional second of page load time, conversion rates drop by 2% to 7%. A store loading in 5 seconds converting at 2% could push closer to 3.5% simply by loading in under 2 seconds. That is a business-changing improvement with no change to your products, prices, or ads.
Traffic Source: Where Your Visitors Come From Changes Everything
Email converts highest at 4.0% to 5.3%. Organic search averages 2.7%. Organic search sees higher conversion rates of around 4% compared to paid ads at 2% to 3%.
Paid traffic converts lower because these visitors are less familiar with your brand. They arrived because of an ad, not because they were already searching for you specifically. Organic and email traffic carries built-in trust and intent, which is why content marketing and email list building are long-term conversion assets, not just brand-building exercises.
| Traffic Source | Typical Conversion Rate |
Email Marketing | 4.0% to 5.3% |
Organic Search (SEO) | 2.7% to 4.0% |
Direct Traffic | 2.5% to 3.5% |
Paid Search | 2.0% to 3.0% |
Social Media (Paid) | 1.0% to 2.5% |
Display Advertising | 0.5% to 1.0% |
Cart Abandonment: The Biggest Leak in Your Funnel
The average cart abandonment rate is 70.22%, though this varies by device and industry. Mobile has higher abandonment rates at 79% to 85% versus desktop’s 67% to 70%.
The primary reasons shoppers abandon carts are unexpected shipping costs, forced account creation, a complicated checkout process, and concerns about payment security. Addressing even two or three of these friction points can recover a meaningful portion of abandoned revenue. Abandoned cart emails achieve 41.8% open rates and 10.7% conversion rates, making a sequence of 2 to 3 recovery emails one of the highest-ROI tactics available.
Trust Signals and Social Proof
Shoppers cannot touch, feel, or try your products. Everything they use to decide whether to trust your store lives on your website. Reviews, verified badges, clear return policies, secure checkout indicators, and real customer photos all reduce the perceived risk of buying. Brands that integrate user-generated content see up to 6 times higher conversion rates according to 2025 research cited by Speed Commerce.
Proven Strategies to Improve Your Ecommerce Conversion Rate
Knowing your ecommerce conversion rate benchmarks is only useful if you act on them. These are not theoretical tactics. These are the specific moves that move the needle in 2026.
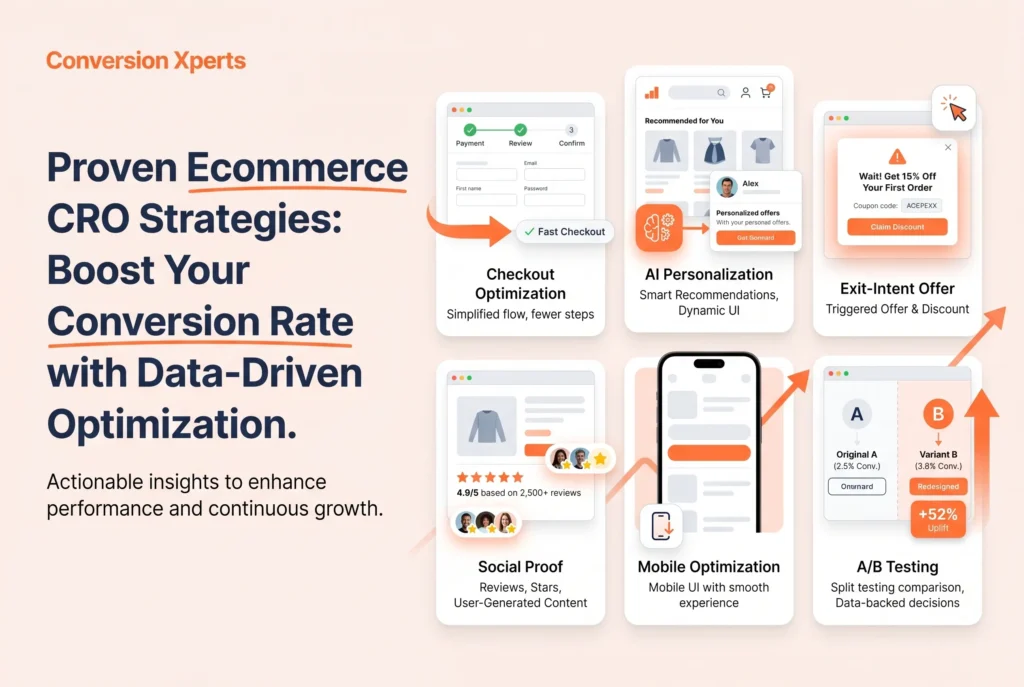
Strategy 1: Eliminate Checkout Friction Relentlessly
Every extra field, every forced sign-up, every unexpected cost at checkout kills conversions. The best-converting stores offer guest checkout, pre-filled forms for returning customers, and one-click payment options. Reducing checkout form fields, enabling all one-tap payment options, compressing images to reduce load time, and ensuring product images render correctly at smaller screen sizes consistently move the needle.
The goal is to make the path from product page to order confirmation feel effortless. If your checkout takes more than 3 steps, you are probably losing customers who would have bought.
Strategy 2: Invest in AI-Powered Personalization
Personalization is no longer a luxury feature reserved for enterprise brands. AI-driven personalization helps you deliver tailored experiences to visitors based on their browsing history or previous purchases. When a returning customer lands on your site and sees products recommended based on what they browsed last week, conversion rates climb because the effort of discovery is removed.
McKinsey research has consistently shown that personalization can lift revenue by 10% to 15% for retailers who implement it well. In 2025, AI personalization tools are more accessible than ever, including through native Shopify apps and third-party platforms.
Strategy 3: Use Exit-Intent Offers Strategically
When a visitor is about to leave without buying, an exit-intent popup offering free shipping, a discount, or a limited-time deal can recapture a meaningful percentage of that traffic. Done right, this is not annoying, it is helpful. Done wrong, it is intrusive. The key is to trigger it only once per session, keep the offer genuine, and make it easy to dismiss if they are not interested.
Strategy 4: Leverage Social Proof at Every Stage
Place reviews on product pages, not just at the bottom. Show star ratings in category listings. Feature real customer photos rather than only studio imagery. Display real-time purchase notifications. Each of these signals reduces the perceived risk of being the next buyer and makes conversion feel like a safer, more social act.
Strategy 5: Optimize Your Mobile Experience as a Standalone Priority
Your mobile site is not your desktop site made smaller. It needs its own UX thinking. While mobile dominates traffic at 73%, desktop maintains a higher conversion rate due to improved usability and user intent. Businesses must continue optimizing mobile experiences as mobile commerce is projected to reach $2.51 trillion in 2025.
Prioritize thumb-friendly navigation, fast-loading images, large clickable buttons, and streamlined checkout forms on mobile. If your mobile conversion rate is more than 1% below your desktop rate, mobile optimization should be your number one priority.
Strategy 6: A/B Test Continuously, Not Occasionally
Conversion rate optimization is not a one-time project. It is a continuous discipline. The brands that consistently convert above 4% are not lucky. They run systematic A/B tests on headlines, product images, button colors, pricing presentation, checkout copy, and delivery promise messaging. When running A/B tests, check results after a minimum of two weeks and a minimum sample size of 200 conversions per variant.
How ConversionXperts.com Helps Brands Break Through the Average Ecommerce Conversion Rate
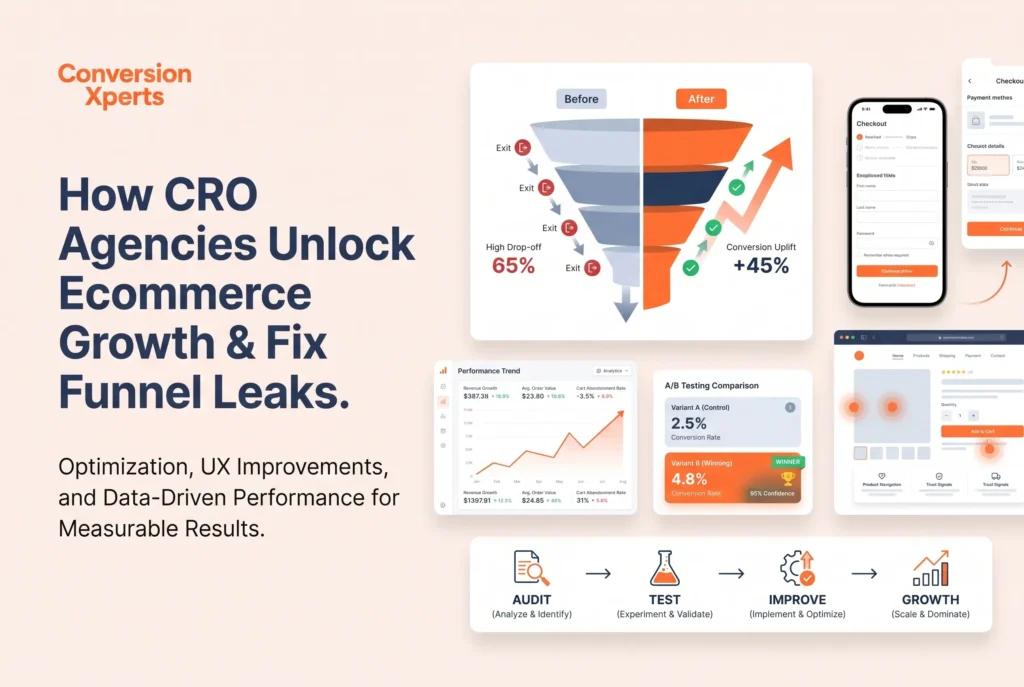
ConversionXperts.com is a global conversion rate optimization agency built specifically for ecommerce brands that are tired of watching traffic arrive and leave without buying. Unlike generic digital agencies that treat CRO as an afterthought, ConversionXperts operates as a dedicated partner in your revenue growth.
Their team combines deep ecommerce data analysis with behavioral psychology and real user testing to identify exactly where your funnel is leaking and why. They do not guess. They audit. They test. They measure.
ConversionXperts has worked with brands across fashion, electronics, health and wellness, and specialty retail to drive measurable improvements in conversion rate, average order value, and cart recovery. Their methodology covers the full conversion ecosystem including mobile UX audits, checkout redesigns, exit-intent strategy, personalization implementation, and A/B testing programs built on statistical significance.
What sets ConversionXperts apart is that their work is built for global performance. Whether your customers are in North America, Europe, or the Middle East, their team understands the regional behavioral nuances that affect how people shop and what makes them convert. They do not apply cookie-cutter solutions. They build custom strategies informed by your specific audience, category, and competitive context.
If your conversion rate is below industry benchmark, or if you simply know it should be higher, ConversionXperts.com is the partner that turns that gap into growth.