
Most businesses lose revenue not because they lack traffic, but because they do not understand what happens after a visitor lands on their page. You can spend thousands on paid ads, SEO, and social media campaigns to drive people to your website, and still watch them leave without taking action. The painful truth is that traffic without understanding is just noise. That is where ConversionXperts steps in with professional user behavior analysis services designed to transform visitor data into revenu
We work with businesses across the United States, United Kingdom, Canada, Australia, and beyond, helping them decode what their users genuinely want, where they get frustrated, and what pushes them toward conversion or away from it. Our user behavior analysis is not a one-size-fits-all report. It is a deep, personalized investigation into the psychology, movement, and intent of your real website visitors so you can make decisions backed by evidence, not assumptions.
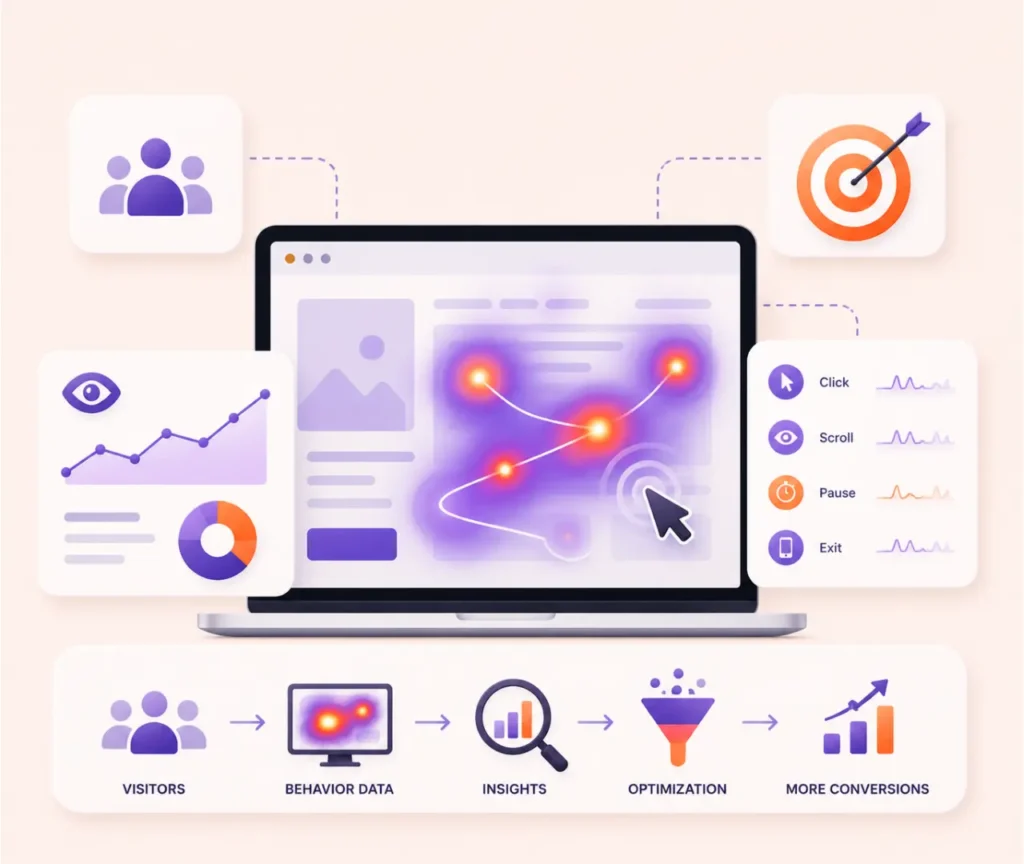
User behavior analysis is the process of collecting and interpreting data about how people interact with your website or digital product. Every scroll, click, pause, hover, tap, and exit tells a story. When you know how to read that story, you gain the power to design experiences that guide visitors naturally toward your conversion goals, whether that is a purchase, a form submission, a phone call, or a sign-up.
Traditional web analytics tools like Google Analytics show you what happened on your site in numerical form. They tell you how many people visited, how long they stayed, and which pages had high bounce rates. But they cannot tell you why someone left without buying. They cannot show you that your call to action button is getting ignored because it blends into the background, or that visitors are furiously clicking on an image that is not actually a link. They cannot reveal that your checkout form is confusing people on mobile devices and causing them to abandon mid-process.
User behavior analysis fills that critical gap. It answers the questions that numbers alone never can. When you understand not just what is happening but why it is happening, every optimization decision you make carries real weight. You stop testing random changes and start targeting friction with precision. The result is a measurable lift in conversion rate that compounds over time.
We have built our user behavior analysis service around a framework that combines quantitative data with qualitative insight. Numbers tell you where to look. Behavior tells you what to fix. Together they create an unstoppable optimization engine.
Our process begins before we look at a single heatmap or session recording. We sit down, virtually or in person, and understand your business goals, your target audience, and the conversion actions that matter most to your bottom line. A retail ecommerce store has different priorities than a B2B SaaS platform or a local service business in Dallas, Texas. A landing page designed to capture leads for a law firm in Chicago, Illinois works under different behavioral rules than a product page for a skincare brand selling across the United Kingdom. We build our analysis around your specific reality, not a generic template.
Once we understand your goals, we deploy a carefully chosen combination of behavioral analytics tools and research methods to capture a complete picture of how your users behave. This is where the real intelligence gathering happens.
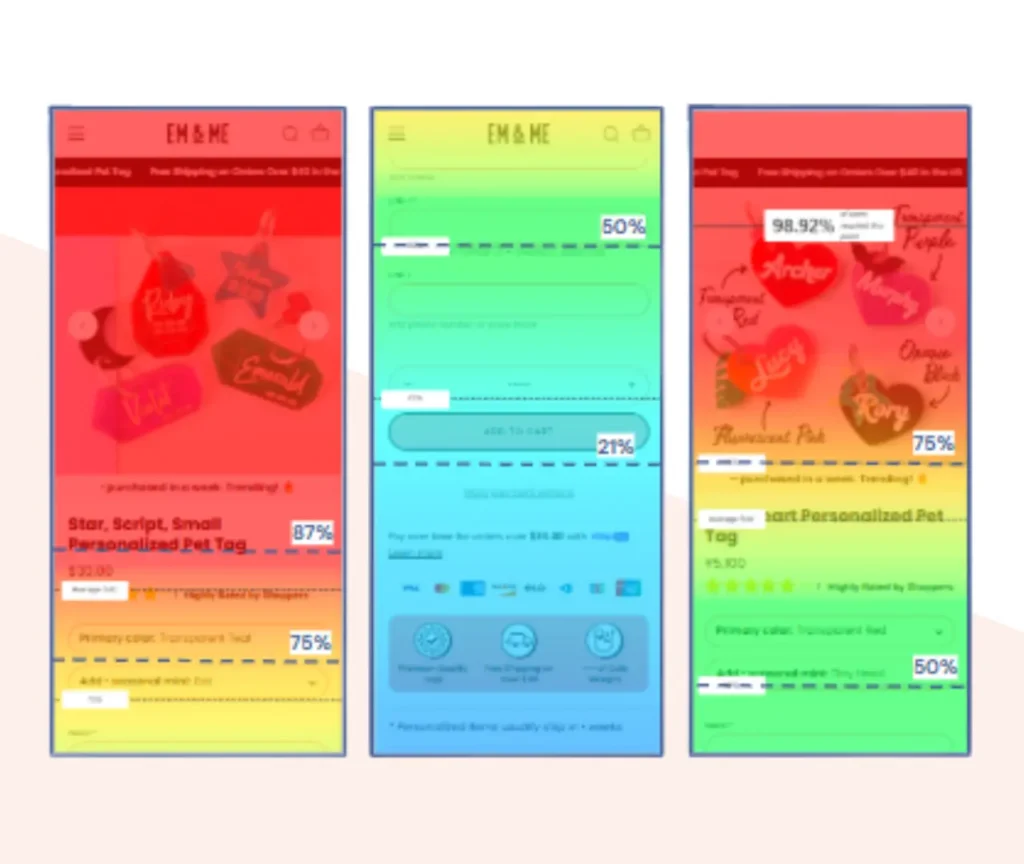
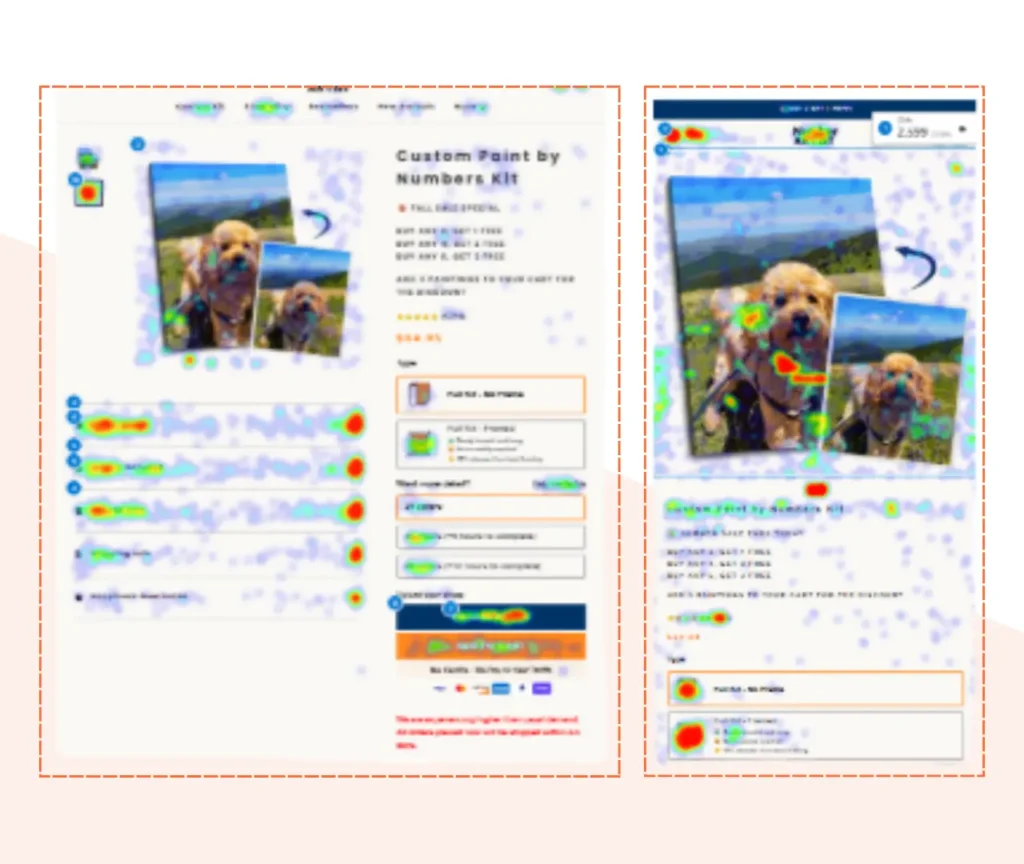
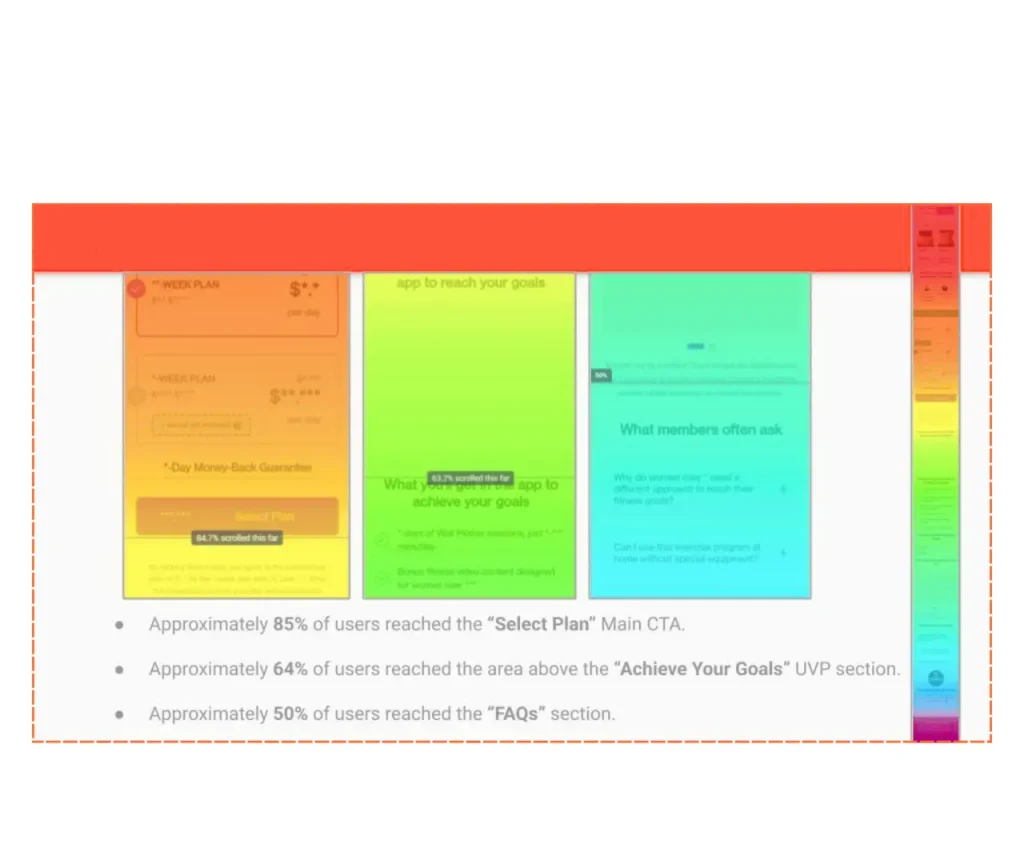
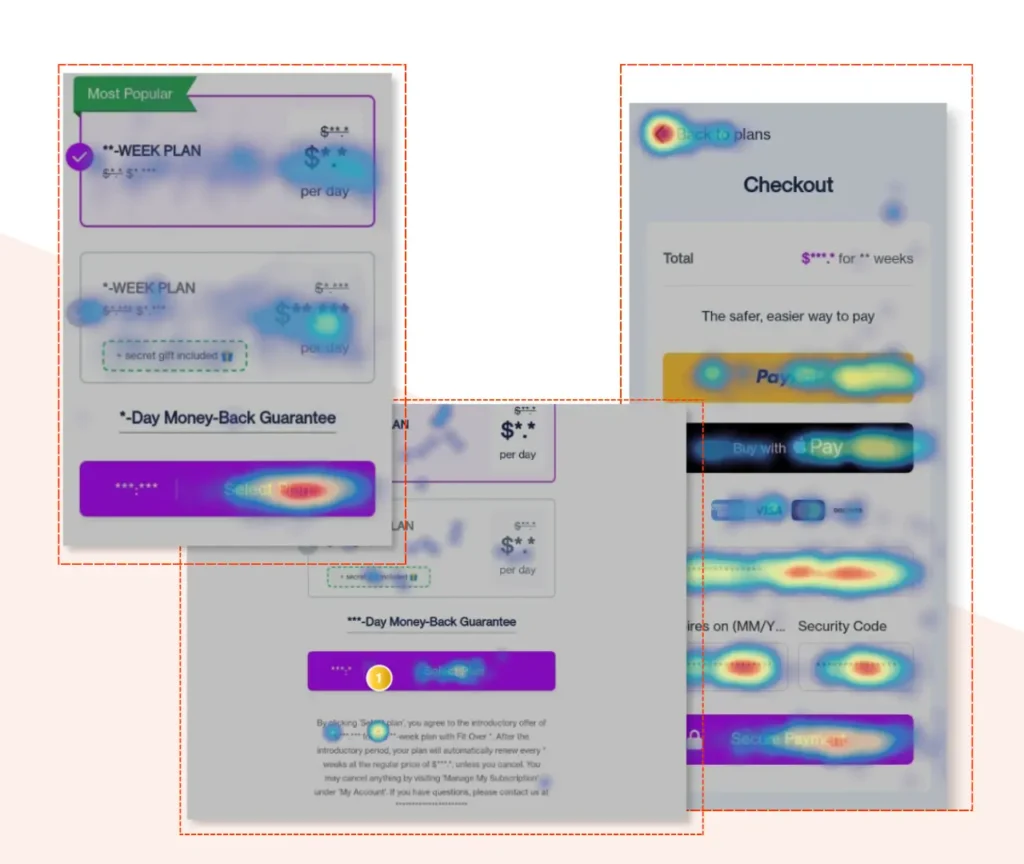
Heatmaps are among the most powerful tools in user behavior analysis because they translate invisible interactions into visible patterns. A click heatmap shows you exactly where visitors are tapping or clicking on your pages. You can see in an instant whether your primary call to action is drawing attention or being ignored in favor of something irrelevant. A scroll heatmap reveals how far down your page the average visitor travels before they stop reading and drift away. A move heatmap on desktop tracks where cursors hover and linger, which often correlates closely with where the eye is actually focused.
When ConversionXperts analyzes your heatmaps, we are not just looking at where people click most. We are identifying mismatches between design intent and actual user behavior. We identify elements that visitors think are clickable but are not, zones of the page that receive almost no engagement despite containing critical information, and patterns that reveal confusion or hesitation at key decision points.
For businesses with multiple landing pages, product pages, or blog articles, we run heatmap analysis across your highest traffic pages first and build out from there. Every page has its own behavioral fingerprint, and understanding that fingerprint tells you exactly where to focus your conversion rate optimization efforts.
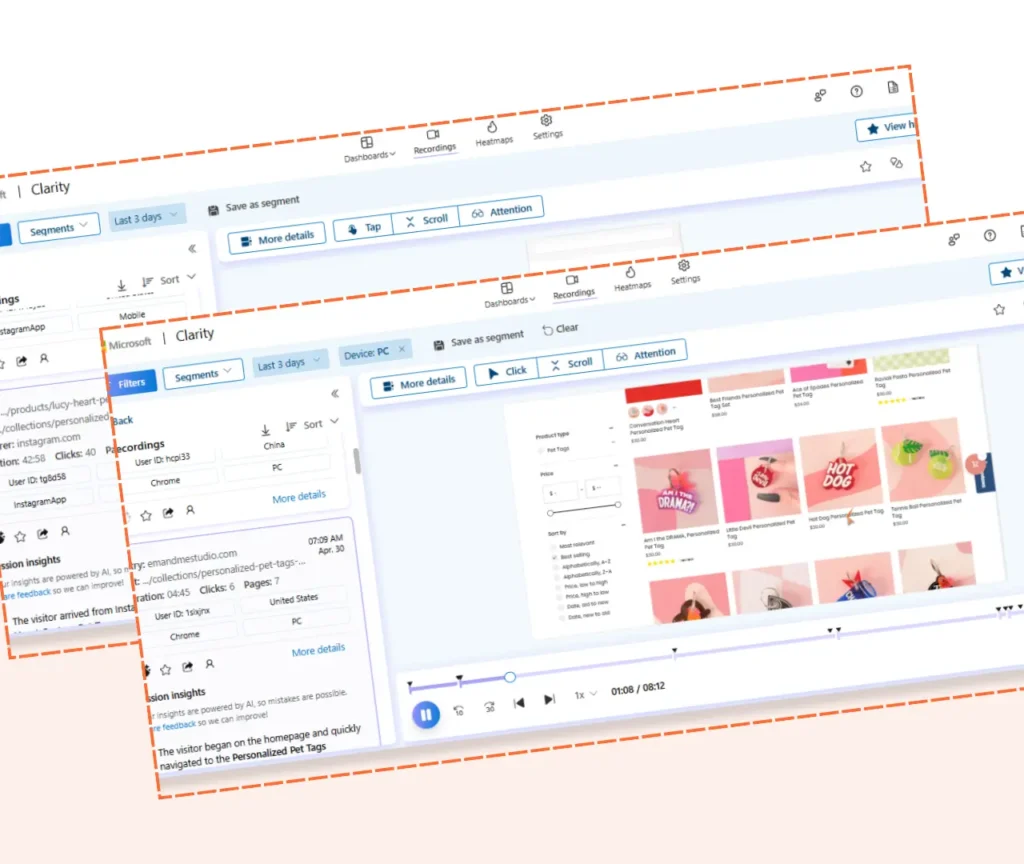
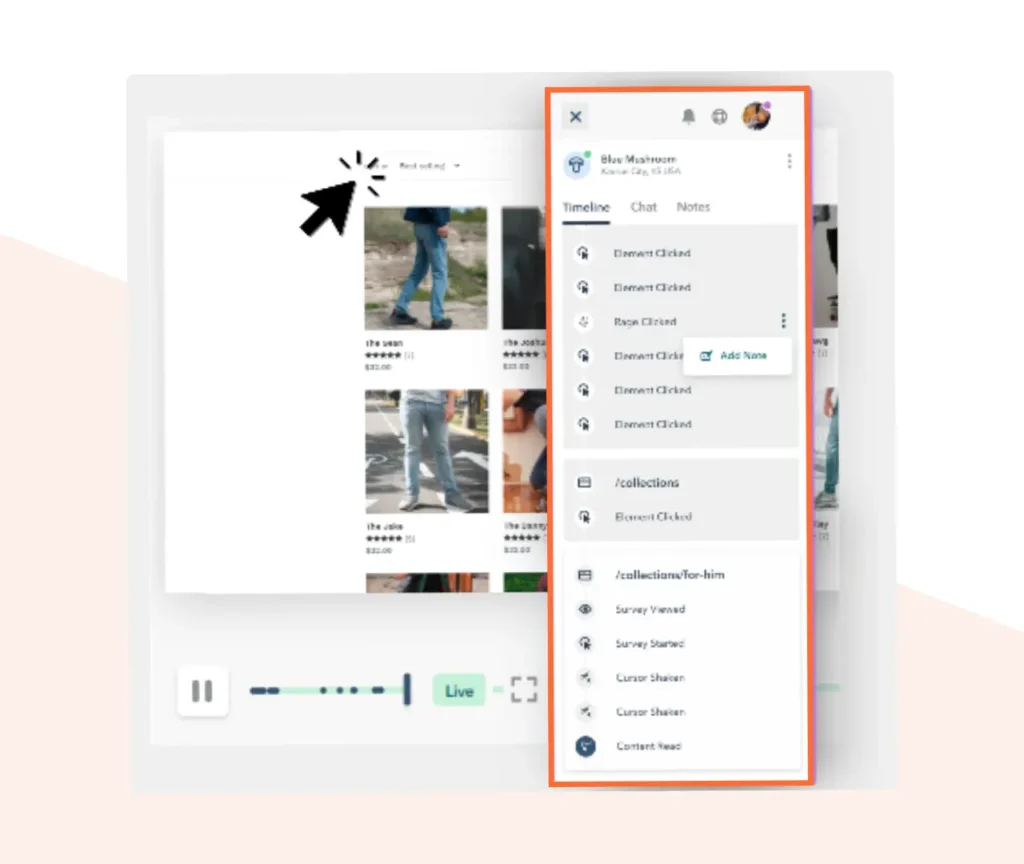
Session recordings are the closest thing to sitting beside a real customer as they browse your website. They capture every mouse movement, scroll, click, and form interaction in a video playback that lets you see your site exactly the way your visitors experience it.
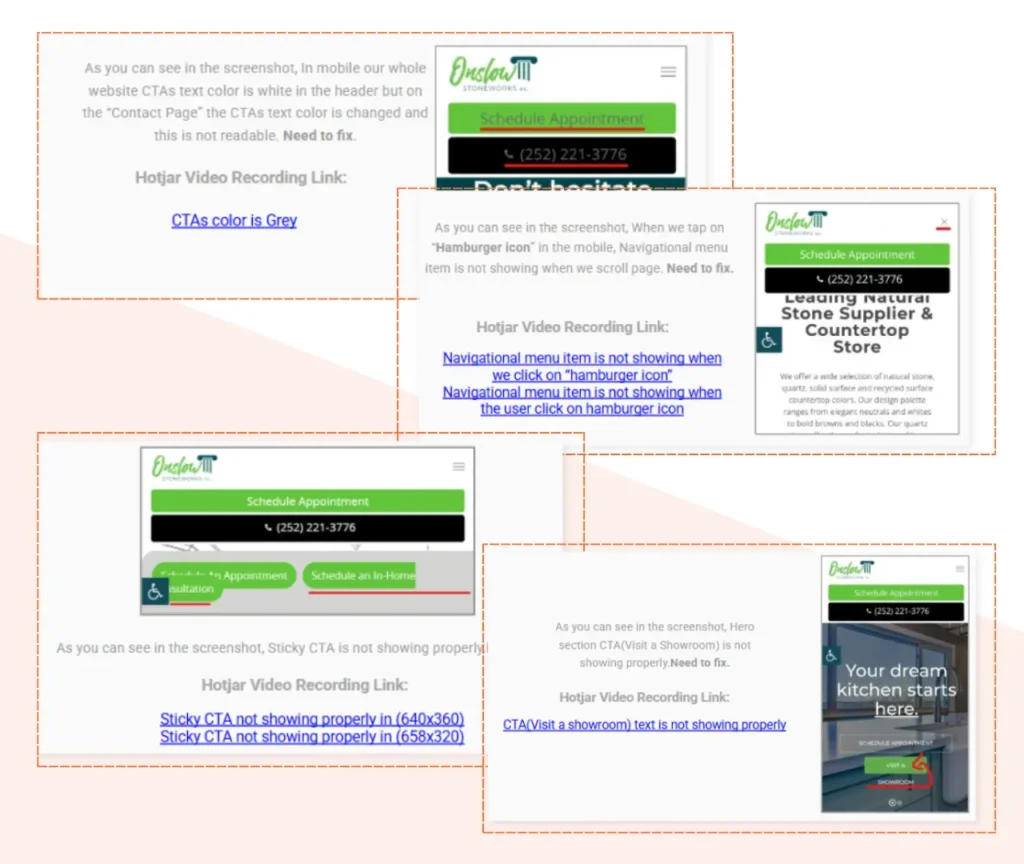
At ConversionXperts, we review session recordings with a trained eye for friction. We are watching for the moments where visitors hesitate before a form field, where they scroll back up to re-read something that confused them, where they start filling out a checkout form and then stop mid-way, and where they encounter a button that does not respond the way they expected. These moments of friction are conversion killers, and most businesses have no idea they exist because they are invisible in standard analytics dashboards.
Session recording analysis is especially powerful for identifying mobile experience failures. Mobile visitors behave very differently from desktop users, and a checkout flow that feels smooth on a laptop can be a maddening experience on a smartphone. Our team specifically segments session recordings by device type, traffic source, and user segment to surface problems that are disproportionately affecting your conversion rate in specific channels or geographies.
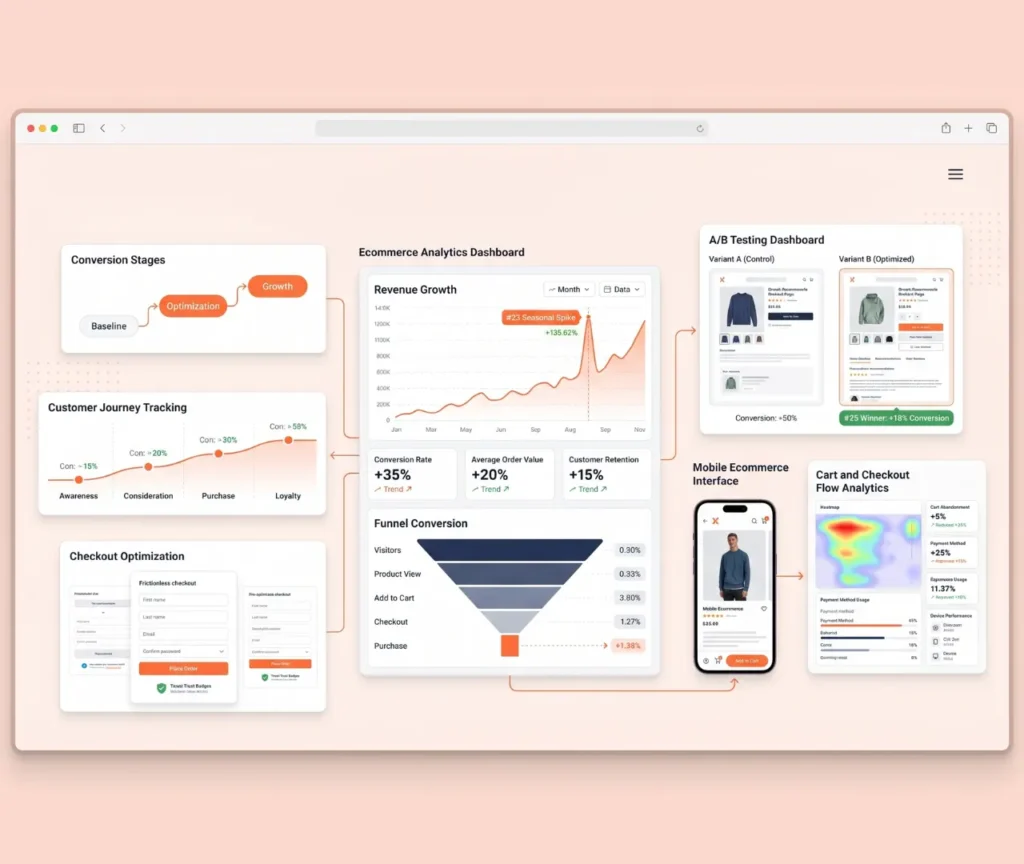
Every website has a conversion funnel, even if it has never been formally defined. A visitor arrives, they move through some sequence of pages and interactions, and at some point they either convert or they leave. Conversion funnel analysis maps out that journey in precise detail and reveals exactly where the drop-offs are happening.
The ConversionXperts team builds funnel maps specific to your most important conversion paths. For an ecommerce store, that typically includes the journey from a product listing page to the product detail page, from the product detail page to the cart, and from the cart through the checkout process. For a service business, the funnel might run from a landing page to a contact form, or from a blog post to a lead magnet download to an email sequence. For a SaaS platform, it might follow the path from pricing page to sign-up flow to first meaningful product action.
Once the funnel is defined, we analyze where visitors are exiting and cross-reference those exit points with behavioral data from heatmaps and session recordings. This combination is what separates surface-level funnel reporting from genuine diagnostic insight. We do not just tell you that 68 percent of visitors drop off at the payment page. We show you why, and we give you a specific, prioritized list of changes to test and implement.
Forms are often the final gate between a visitor and a conversion, and they are one of the most common places where businesses silently lose revenue. A lead generation form that takes too long to fill out, asks for information that feels invasive, or triggers a confusing validation error will kill conversions even when everything else on the page is working perfectly.
Our form analytics service tracks how visitors interact with every field in your forms. We see which fields cause the most hesitation, which fields people skip and come back to, which fields trigger rage clicks or repeated error messages, and at which point in the form most people give up and leave. This level of granularity is something standard analytics will never show you.
For businesses running campaigns in competitive markets like New York, Los Angeles, London, Sydney, or Toronto, even a small improvement in form completion rate can translate into significant revenue gains. Reducing form abandonment by 20 percent on a high-traffic lead generation page does not just help you. It gives you a structural advantage over every competitor who has never looked at their form behavior data.
Behavioral data shows you what visitors do. Voice of customer research tells you why they do it, in their own words. When you combine on-site surveys, exit intent polls, and post-conversion feedback with behavioral analytics, you gain an impossibly rich understanding of your visitors' motivations, objections, and unmet needs.
ConversionXperts integrates voice of customer tools directly into your website so you can capture qualitative data at exactly the right moments in the visitor journey. We help you design survey questions that uncover real friction rather than just collecting generic satisfaction scores. We analyze open-ended responses to identify patterns in the language your visitors use to describe their problems and desires, and we feed those insights back into your messaging, page copy, and conversion architecture.
This is the kind of research that most agencies skip because it takes skill to do properly. But the businesses that take voice of customer seriously consistently outperform those that rely on behavioral data alone, because they understand not just the mechanics of how visitors move through their site but the emotional and rational logic that drives those movements.
One of the most common mistakes businesses make is optimizing individual pages in isolation without understanding how those pages connect to the broader user journey. A product page that performs well on its own metrics might actually be disrupting the natural flow of visitors who arrive from a specific channel or search query. A landing page that looks great in A/B testing might be cannibalizing conversions from another part of the funnel.
User journey mapping brings the full picture into focus. ConversionXperts builds detailed maps of the actual paths visitors take through your website, not the paths you intended them to take but the real, messy, non-linear routes they actually follow. We identify which entry points lead to the highest conversion rates, which content clusters keep visitors engaged and moving forward, and which paths lead to dead ends or premature exits.
This macro-level view of user behavior is essential context for any conversion rate optimization work. Without it, you are optimizing pieces of a puzzle without knowing what the finished picture is supposed to look like.
Every element of user behavior analysis described above exists for one fundamental reason: to increase your conversion rate by removing friction and aligning your website experience with what your visitors actually need.
When you know exactly where visitors are dropping off in your funnel, you can fix those specific points rather than guessing. When you can see that your mobile checkout is generating rage clicks because a tap target is too small, you can fix it in hours. When voice of customer research reveals that visitors are leaving because they do not understand your pricing model, you can restructure that page to address their specific concern. When session recordings show you that visitors are not seeing your primary value proposition because they never scroll far enough to reach it, you can move it above the fold and watch your conversion rate climb.
These are not hypothetical outcomes. They are the kinds of improvements ConversionXperts helps clients achieve every month. Businesses that invest in professional user behavior analysis consistently see meaningful lifts in conversion rate, reduction in cost per acquisition, and improvement in return on ad spend, because they are making changes that are grounded in real evidence rather than intuition or industry best practices borrowed from a different type of business.
Our user behavior analysis services are built for businesses that are serious about growth and are ready to let data lead the way.
Ecommerce brands carrying significant traffic from organic search, paid social, or PPC advertising benefit enormously from behavioral analysis because even small improvements in add-to-cart rate or checkout completion translate directly into substantial revenue gains. A brand doing five hundred thousand dollars in monthly revenue that improves its checkout conversion rate by just ten percent adds fifty thousand dollars to its top line without spending an additional dollar on acquisition.
B2B companies and SaaS platforms with longer, more complex sales cycles benefit because user behavior analysis reveals the specific content, messaging, and page sequences that move prospects through the consideration process most efficiently. Shortening a conversion path from five touchpoints to three without losing lead quality is the kind of insight that only behavioral research can surface.
Local service businesses operating in competitive markets across cities like Houston, Miami, Atlanta, Manchester, Melbourne, and Vancouver benefit because even small improvements in lead form conversion rate can have an outsized effect on monthly revenue when average customer value is high. A personal injury law firm, a cosmetic dental practice, or a high-end home renovation company does not need to double its traffic. It needs the traffic it already has to convert at a higher rate.
Digital agencies and in-house marketing teams benefit because our behavioral analysis gives them the research foundation they need to justify design decisions, build more compelling testing hypotheses, and demonstrate measurable impact to stakeholders and clients.
We do not hand you a heatmap screenshot and a list of observations. We deliver a structured behavioral research report that connects every insight to a specific business impact, prioritizes recommendations based on their likely effect on conversion rate, and gives your team a clear roadmap for implementation. Every finding is tied back to your goals. Every recommendation is grounded in evidence.
We also bring a genuine curiosity to every engagement. Our analysts do not review your session recordings looking for confirmation of a pre-existing hypothesis. They approach the data with fresh eyes, and they are often surprised by what they find, because user behavior frequently defies assumption. That openness to being wrong, to being surprised by the data, is what produces the most genuinely useful insights.
Our team has experience working across industries including ecommerce, SaaS, finance, healthcare, legal services, education, real estate, travel, and professional services. We understand the specific regulatory sensitivities, audience expectations, and competitive dynamics that shape user behavior in these sectors, and that context shapes the way we interpret data and frame recommendations.
We begin every engagement with a discovery phase where we learn about your business, your traffic sources, your current conversion performance, and the specific questions you most want answered. This conversation shapes everything that follows.
Next we conduct a technical setup review to ensure that tracking is implemented correctly and that the behavioral data we collect will be accurate and meaningful. Garbage data produces garbage insights, so this step is never skipped.
Then we deploy behavioral tracking tools across your key pages and allow them to collect sufficient data to produce statistically meaningful patterns. The duration of this collection phase depends on your traffic volume, but we work efficiently to minimize delays.
With data in hand, our analysts begin the review process. They work through heatmaps, session recordings, funnel reports, and form analytics systematically, making notes, flagging anomalies, and building a picture of the friction landscape across your site.
Where voice of customer research is included, we design and launch on-site surveys during the collection phase and analyze responses alongside behavioral data to produce a multi-dimensional view of the user experience.
Finally we compile our findings into a prioritized behavioral analysis report with clear, actionable recommendations tied to specific conversion outcomes. We walk your team through this report in a dedicated strategy session to ensure every insight is understood and every recommendation is actionable.
Many clients choose to engage ConversionXperts on an ongoing basis after their initial analysis because continuous behavioral monitoring and iterative optimization consistently outperforms one-time audits. User behavior evolves as your audience grows, your traffic mix changes, and your industry landscape shifts. Staying ahead of that evolution is how the most successful businesses maintain their conversion advantage over time.
Hotjar is one of the most trusted behavioral analytics platforms in the world, used by over 1.1 million websites. It provides heatmaps, session recordings, and surveys to reveal how users interact with your site.
Microsoft Clarity is a free, enterprise-grade user behavior analytics platform developed by Microsoft. It offers unlimited heatmaps and session recordings with no traffic limits.
Crazy Egg is a visual analytics and conversion optimization platform that captures how real users interact with your website. Its heatmaps, scrollmaps, and A/B testing tools pinpoint exactly where visitors engage or drop off.
Mouseflow is used to record and analyze real user behavior on websites. It provides session recordings, heatmaps, and funnel analysis to identify friction points in the user journey.
FullStory positions itself as a digital experience intelligence platform. Through its proprietary Fullcapture autocapture engine, it records every user interaction to surface frustration signals and conversion opportunities.
Session recording is the process of capturing real user interactions on your website — mouse movements, clicks, and scrolls. Watching actual sessions reveals usability issues and hesitation points that analytics alone cannot show.
We combine advanced tools, data-driven insights, and human-centered analysis to provide actionable recommendations that boost conversions. Our approach ensures that every observation leads to measurable improvements in performance.
Whether you are exploring heatmaps, scroll maps, session recordings, or click tracking, we guide you through setup, analysis, and implementation for maximum impact.
The timeline depends on your traffic volume and the scope of pages we are analyzing. For most established websites with healthy traffic, an initial behavioral analysis takes between three and six weeks from setup to final report delivery. Lower-traffic sites may require a longer collection period to gather meaningful behavioral patterns.
In most cases we install lightweight tracking scripts that do not affect your site’s performance or user experience. Our team handles implementation or works alongside your development team to ensure clean, accurate setup.
Yes, ConversionXperts uses behavioral analytics tools and data collection practices that comply with current data privacy regulations. We configure tracking in ways that protect user privacy while still capturing the behavioral signals needed for meaningful analysis.
User behavior analysis is the research phase that informs and improves A/B testing. Rather than testing random changes, behavioral research gives you high-confidence hypotheses about what to test and why. This dramatically improves the success rate of your experiments and reduces the time and traffic needed to reach statistical significance. Many of our clients pursue both services together for maximum impact.
ConversionXperts works with clients globally. We have particular experience with businesses based in or targeting audiences in the United States including New York, Los Angeles, Chicago, Houston, Phoenix, Philadelphia, San Antonio, and San Diego. We also serve clients in the United Kingdom including London, Manchester, Birmingham, and Edinburgh, as well as businesses in Canada, Australia, New Zealand, the UAE, and across Europe. Our methodology and analysis are adapted for the audience context and regional behavioral norms of each market.
Results vary depending on the baseline conversion rate, the volume of friction points identified, and the scope of changes implemented. However, businesses that act on our behavioral research consistently see meaningful improvements in conversion rate. Some clients see double-digit percentage lifts within the first ninety days. Others achieve steady incremental gains that compound over six to twelve months. We never guarantee specific numbers because conversion rate is influenced by many factors, but we guarantee that every recommendation we make is grounded in real behavioral evidence rather than guesswork.