


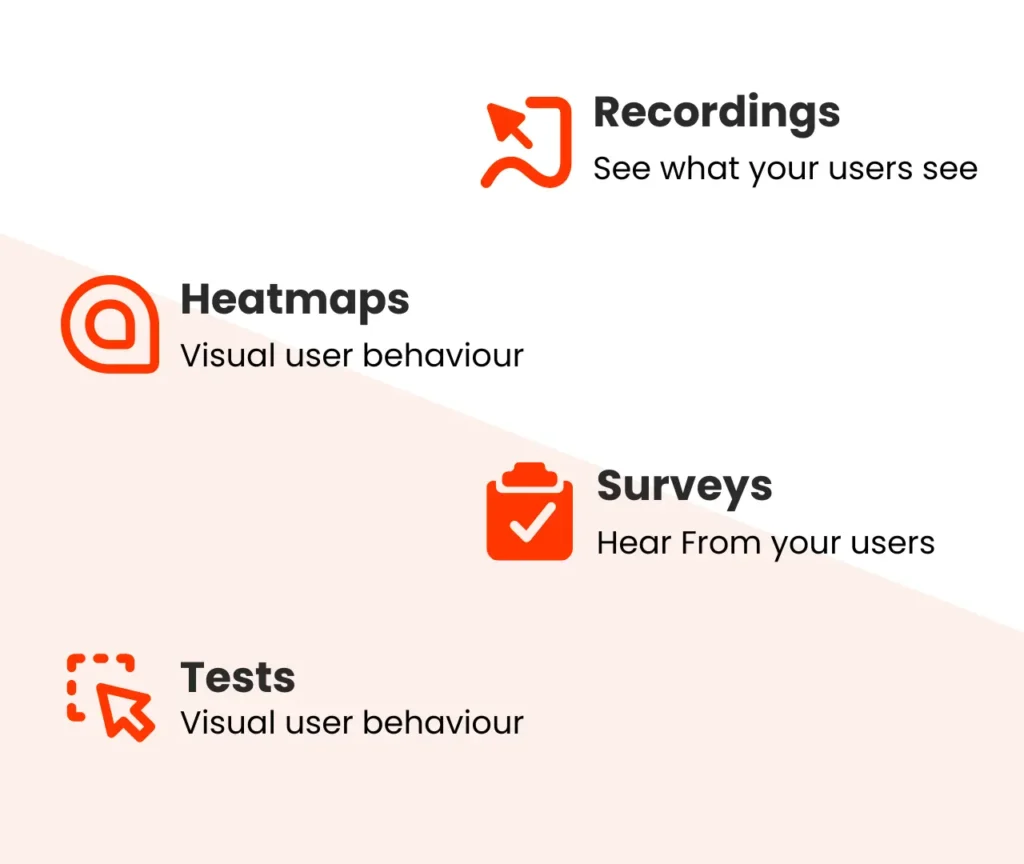
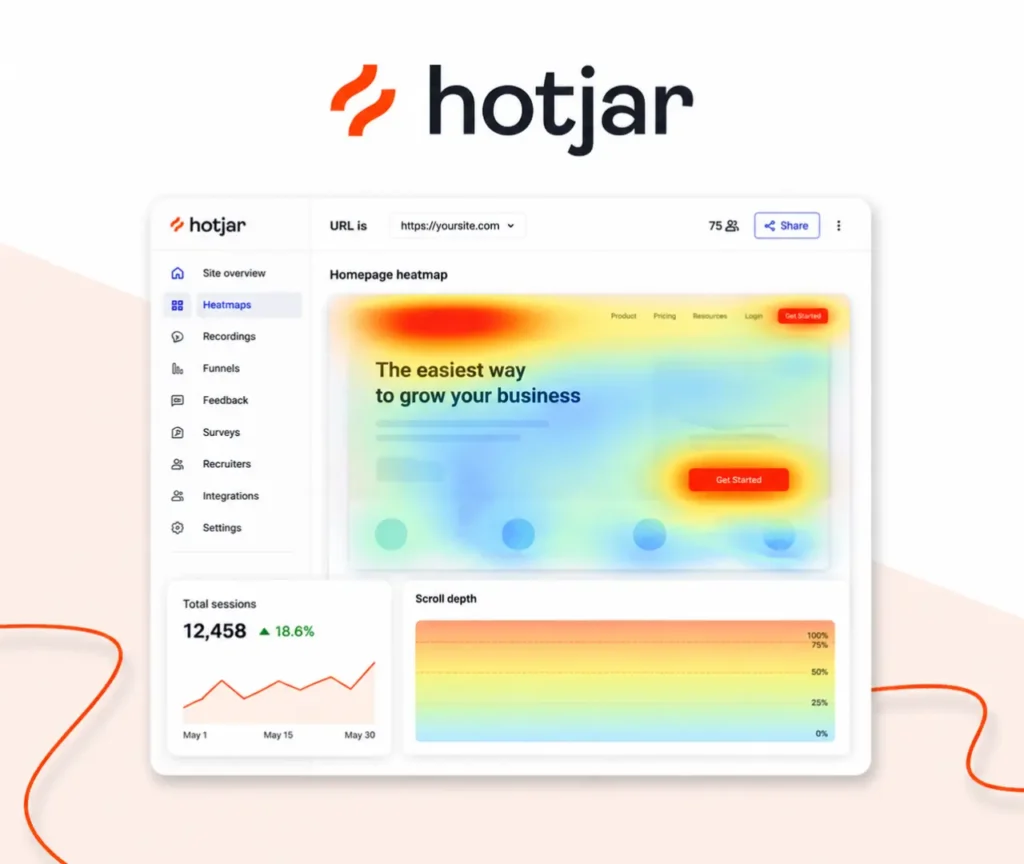
They serve different purposes. Google Analytics gives you the high level quantitative numbers (traffic, bounce rate), while Hotjar gives you the qualitative “why” (session recordings, heatmaps). You need both to have a complete picture of your website performance.
When implemented correctly by a professional agency, the impact on load speed is negligible. Hotjar uses an asynchronous script that loads separately from your content, ensuring that your user experience remains fast and fluid.
You don’t need to watch every single one. Our experts use filters to find the most “high value” recordings—users who spent a long time on the site but didn’t convert, or users who exhibited “rage clicking” behavior. Typically, watching 20-30 well-filtered recordings reveals 80% of the major friction points.
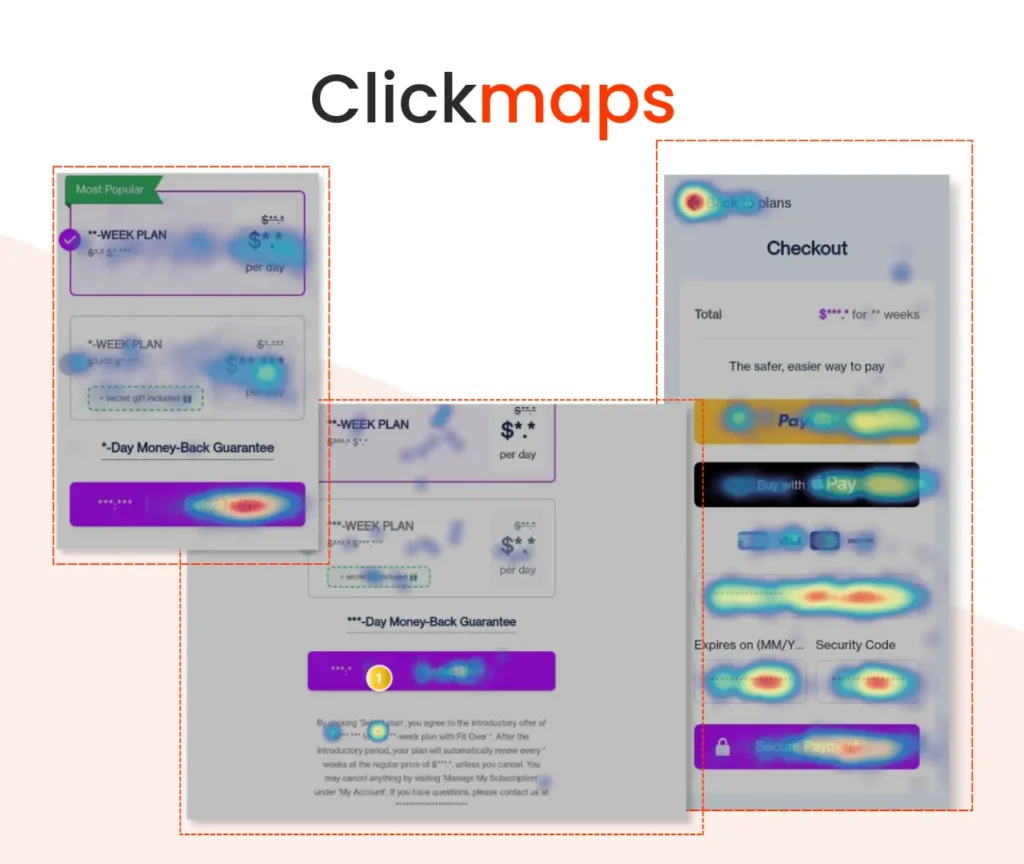
Yes. Hotjar is built with privacy in mind. It automatically suppresses sensitive information like credit card numbers and passwords from recordings, ensuring that you can analyze behavior without compromising user privacy or violating data protection laws.
Optimization is a continuous process. While a deep dive audit is recommended every quarter, we monitor behavioral trends weekly to spot new bugs or shifts in consumer behavior as you launch new products or marketing campaigns.