SaaS Marketing Benchmarks 2026: What Top Brands Actually Hit
What Are SaaS Marketing Benchmarks and Why Do They Matter in 2026
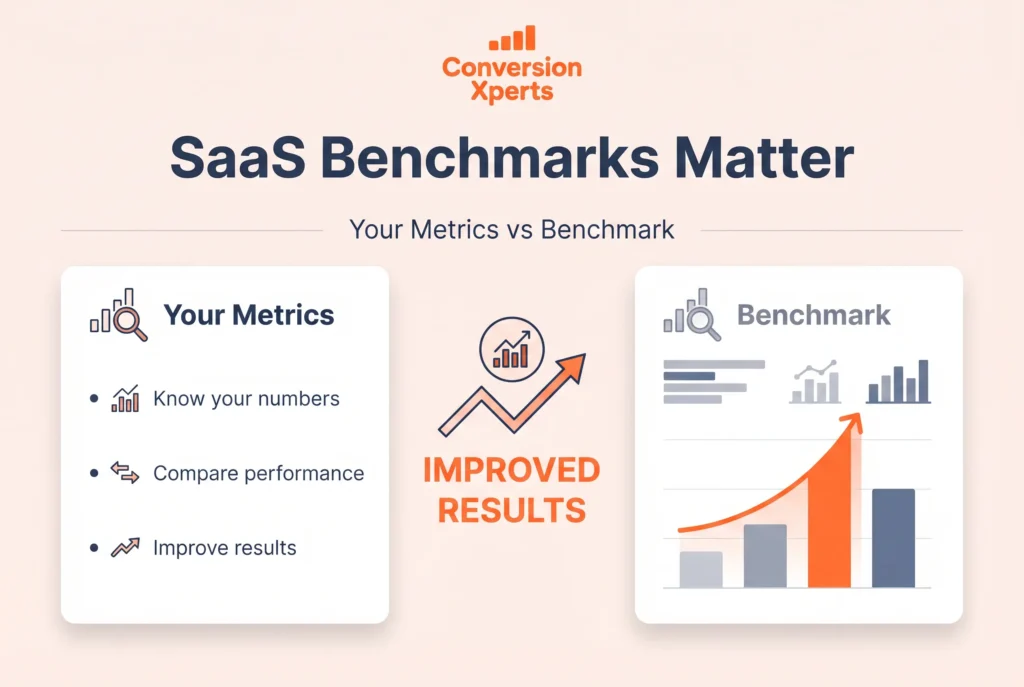
SaaS marketing benchmarks are measurable standards that show how software companies perform across key marketing and revenue metrics, from website traffic to closed deals. They give you a reference point to judge your own performance against the industry.
Without benchmarks, you are flying blind. You might celebrate a 2% visitor-to-lead conversion rate, not knowing that your top competitor is converting at 12%. You might assume your customer acquisition cost is acceptable when it is actually twice the industry median.
In 2026, benchmarks matter more than ever because the SaaS landscape has shifted hard. Customer acquisition costs are climbing, conversion rates are fluctuating, and retention has become the primary growth engine for scaling companies. The companies winning right now are the ones who know their numbers, compare them honestly, and optimize relentlessly.
This is especially true for SaaS businesses in emerging markets like Pakistan, where marketing budgets are tighter and every conversion point carries more weight. Understanding where global benchmarks sit gives you a strategic edge you simply cannot get anywhere else.
SaaS Funnel Benchmarks: From Visitor to Closed Deal
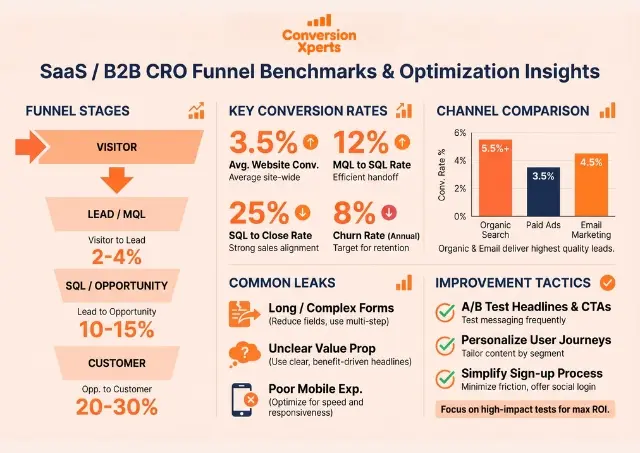
The SaaS funnel has distinct stages, and each one has its own benchmark range. Most companies focus only on the top of the funnel and ignore the leaks in the middle. That is a costly mistake.
Visitor to Lead Conversion Rate
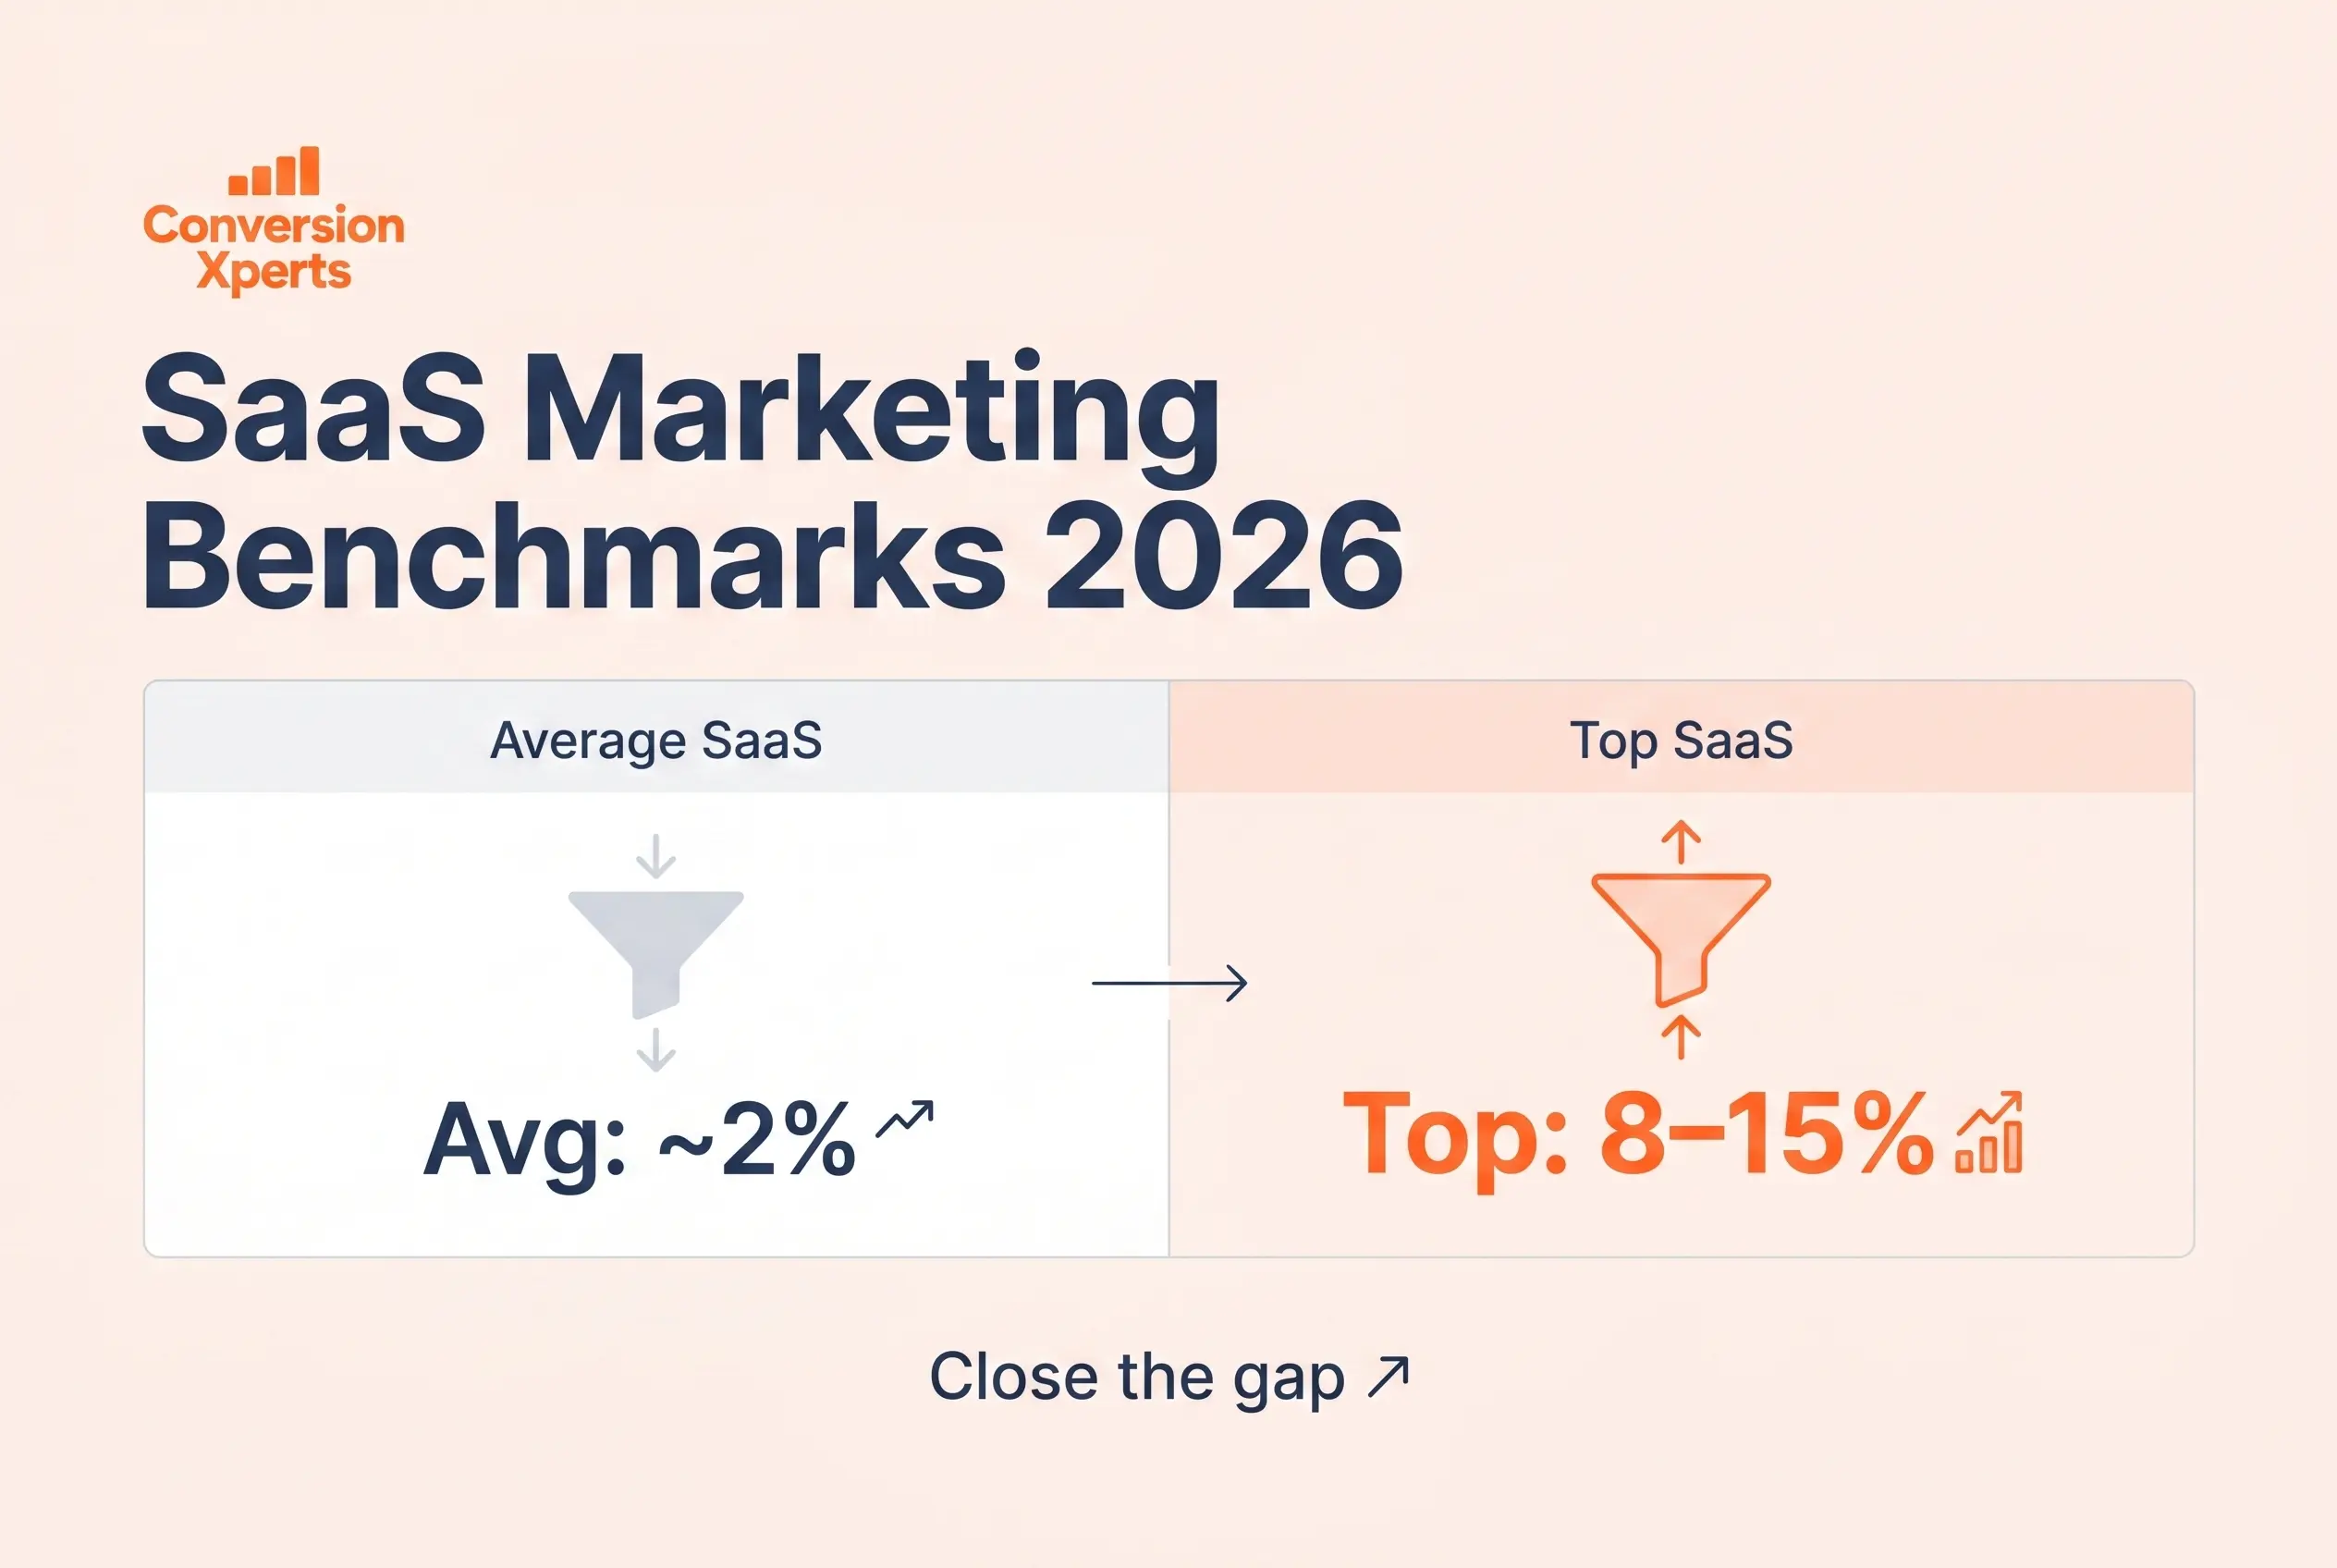
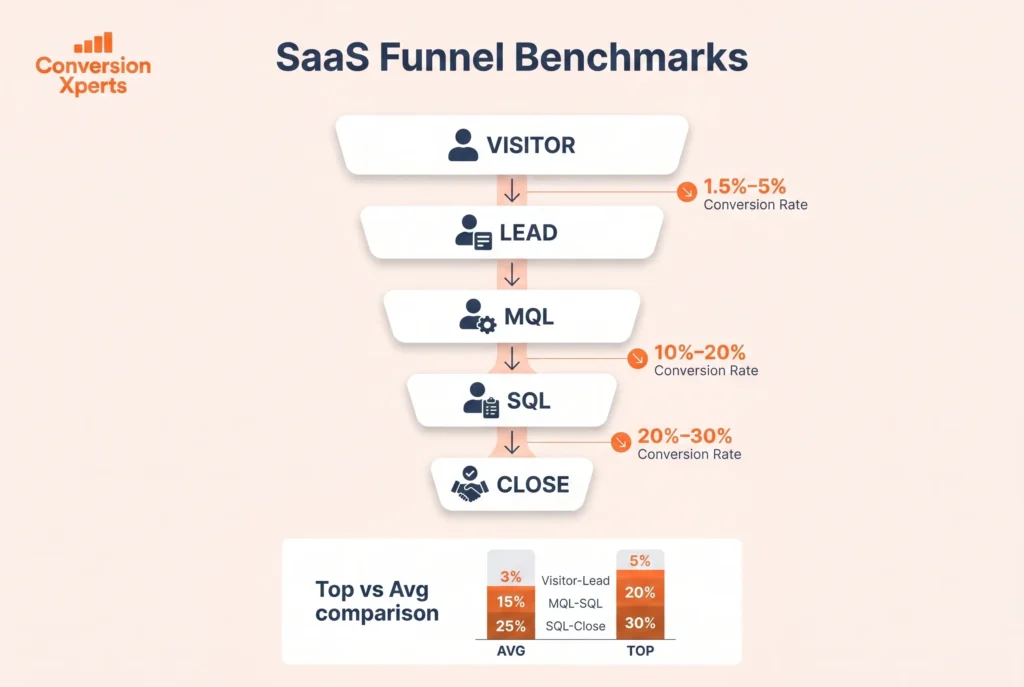
The average B2B SaaS visitor-to-lead conversion rate sits between 2% and 5% in 2026. The top 10% of companies reach 8% to 15%. The gap between average and elite performers at this stage is explained by three things: how well your landing page matches visitor intent, how many form fields you ask them to fill in, and how strong your social proof is.
Single-CTA landing pages convert at 13.5% compared to 10.5% for multi-CTA pages, and custom-designed landing pages reach 11.6% versus just 3.8% for templates. If your homepage is your only landing page, that is the first problem to fix.
MQL to SQL Conversion Rate
The MQL to SQL stage is where most SaaS funnels quietly collapse. A healthy MQL-to-SQL conversion rate in 2026 sits between 25% and 40%, with top performers reaching the upper end of that range. If you are below 15%, it is a signal that your lead scoring is off, your marketing and sales teams are using different definitions, or you are attracting the wrong audience entirely.
High-performing teams consistently convert 10% to 30% of MQLs into SQLs, and AI-driven lead scoring can improve qualification speed by 20% to 30%. That is a competitive advantage that is accessible to SaaS companies of any size in 2026.
SQL to Close Rate
SQL-to-close conversion averages 20% to 25% across B2B SaaS, with top performers exceeding 30%. The companies clearing 30% are typically those with tighter qualification criteria, deeper personalization in their sales outreach, and a product that reaches its core value faster.
The Full Funnel Math
Let us put this together with a simple example. Start with 1,000 leads entering your funnel. Around 390 become MQLs, 148 become SQLs, 62 become opportunities, and roughly 23 close. That is a 2.3% lead-to-close rate, which sounds terrible until you realize each deal is worth $30,000 or more in ARR.
This is exactly why you cannot look at any single stage in isolation. Every percentage point improvement compounds across the entire funnel.
| Funnel Stage | Average Performer | Top 10% Performer |
Visitor to Lead | 1.5% to 2.5% | 8% to 15% |
Lead to MQL | 35% to 45% | 50% to 60% |
MQL to SQL | 25% to 32% | 38% to 40% |
SQL to Close | 20% to 25% | 30%+ |
Demo to Opportunity | 60% to 80% | 90%+ |
SaaS Conversion Rate Benchmarks by Channel and Trial Type
SaaS conversion optimization is not just about fixing your website. It is about understanding which channels produce the best leads and which trial models drive the most paying customers.
Free Trial and Freemium Conversion Rates
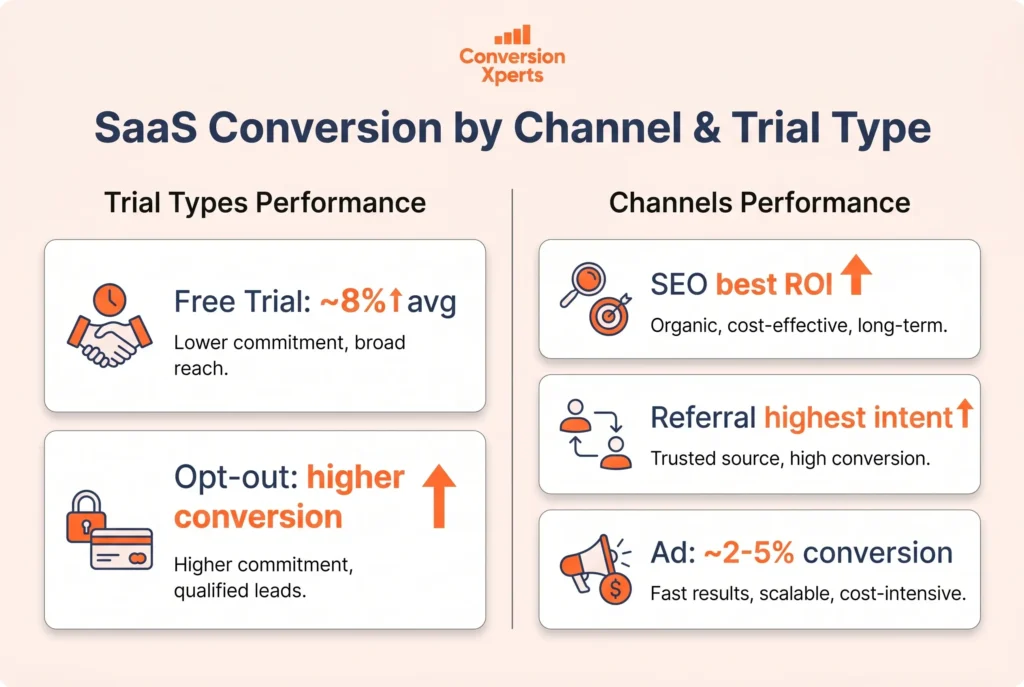
The median free-to-paid conversion rate for SaaS companies stands at 8% as of early 2026, though this figure varies significantly depending on the trial structure.
Trial structure is one of the highest-leverage decisions you can make in SaaS marketing. Opt-in trials requiring no credit card show an average conversion rate of 18.2%, while opt-out trials requiring a credit card upfront convert at 48.8%. Trial duration also plays a major role: seven-day trials achieve the highest conversion rate at 40.4%, while trials lasting more than 60 days see a drop to 30.6%.
This tells you something important. Friction in the right place, asking for a credit card upfront, actually increases conversion. Friction in the wrong place, a 90-day trial with no urgency, kills it.
Conversion Rates by Marketing Channel
Not all traffic is created equal. Here is how the major SaaS marketing channels compare on visitor-to-lead conversion:
| Channel | Average Conversion Rate | Notes |
SEO / Organic | 2.1% | Highest quality, lowest CAC |
Paid Search (PPC) | 0.7% to 1.5% | Fast but expensive |
Referral | 3.5%+ | High intent, high close rate |
Webinar | 17.8% MQL to SQL | Best for mid-funnel |
Website Direct | 31.3% lead-to-SQL | Strongest buying intent |
SEO and content marketing deliver a 702% ROI with dramatically lower CAC compared to paid acquisition, making them the best long-term channel investment for SaaS companies.
Industry-Specific SaaS Conversion Rates
Your benchmark target should account for your vertical. CRM platforms boast a 9.7% visitor-to-trial conversion rate, one of the highest in SaaS, and convert trials to paid customers at around 31.4%. EdTech, on the other hand, struggles with freemium-to-paid rates of just 2.6%.
HR Tech reaches 3% to 6% visitor-to-lead conversion because buyers often arrive with strong demo intent, while cybersecurity averages 1% to 2% due to longer risk-heavy evaluations.
Customer Acquisition Cost, LTV, and Payback Period Benchmarks
Understanding your SaaS funnel benchmarks without looking at unit economics is like knowing your speed without knowing your destination. CAC, LTV, and payback period are the numbers that determine whether your SaaS business is actually sustainable.
Customer Acquisition Cost Benchmarks
Median customer acquisition cost has hit $2.00 to acquire $1.00 of new annual recurring revenue, a 14% increase from 2023, with the worst-performing companies spending $2.82 per dollar of ARR. That means for every dollar of new ARR, most SaaS companies spend two dollars just to get the customer in the door.
This is a clear signal that SaaS marketing efficiency matters more in 2026 than growth at all costs.
LTV to CAC Ratio
A healthy LTV to CAC ratio for SaaS is 3:1 or higher. This means the lifetime value of a customer should be at least three times what you spend to acquire them. Elite companies push this to 5:1 or above.
LTV and CAC vary significantly depending on the type of SaaS company, its pricing model, target market, and customer journey. A $500 per month product sold to SMBs will have a very different LTV than a $5,000 per month enterprise platform, even if the churn rates are similar.
Payback Period Benchmarks
The payback period tells you how long it takes to recover the cost of acquiring a customer. For early-stage SaaS companies, 12 months or less is considered healthy. For growth-stage companies targeting enterprise, 18 to 24 months can be acceptable if NRR is strong.
SaaS companies with $5,000 to $15,000 ACV typically invest $10,000 to $30,000 per month in Google Ads alone, and the median cost per SQL for B2B SaaS paid search sits at $800 to $2,500. Understanding your payback period helps you decide how aggressively you can reinvest.
SaaS Churn, Retention, and Net Revenue Retention Benchmarks
Retention is the quiet engine of SaaS growth. You can win the top of the funnel every month and still shrink if your churn is out of control.
Monthly and Annual Churn Rate Benchmarks
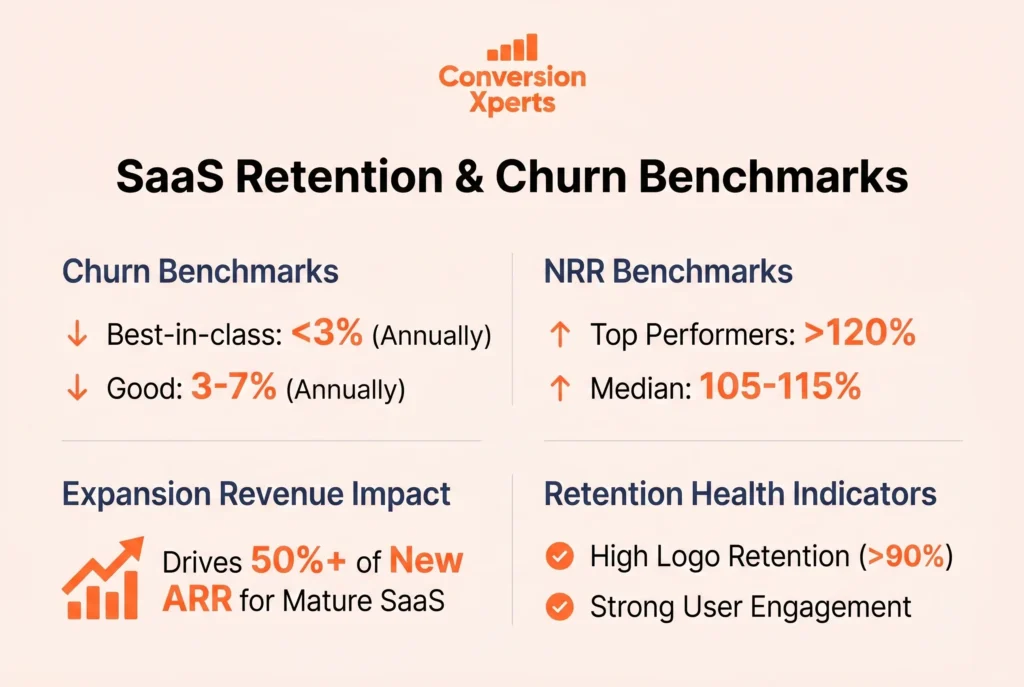
The typical churn rate for SaaS companies is often reported to be around 5%, but to maintain a healthy and sustainable business, you should aim for a churn rate under 3%.
For enterprise SaaS with annual contracts, churn below 5% annually is considered healthy. For SMB-focused SaaS with monthly billing, anything above 3% monthly is a serious warning sign because it compounds fast. At 3% monthly churn, you are losing nearly one-third of your customer base every year.
Net Revenue Retention (NRR)
Net Revenue Retention is one of the most important SaaS marketing benchmarks in 2026. It measures how much revenue you retain and expand from your existing customer base, accounting for upgrades, downgrades, and cancellations.
Median NRR sits at 106%, with top performers exceeding 120% and growing 2.5 times faster than low-NRR companies. An NRR above 100% means your existing customers are paying you more over time, even without adding a single new account.
Expansion ARR now represents 40% of total new ARR for most SaaS companies, with companies over $50 million in ARR seeing this exceed 50%. This is the real growth flywheel.
However, 75% of software companies reported declining retention rates in 2024, making retention optimization a critical and often neglected priority.
| Retention Metric | Healthy Range | Elite Range |
Monthly Churn | Below 2% | Below 1% |
Annual Churn | Below 5% | Below 3% |
Net Revenue Retention | 100% to 110% | 120%+ |
Expansion ARR Share | 30% to 40% | 50%+ |
SaaS Marketing Spend Benchmarks by Company Stage
How much should you actually be spending on SaaS marketing? The answer changes dramatically based on where you are in your growth journey.
Early Stage: Seed to Series A
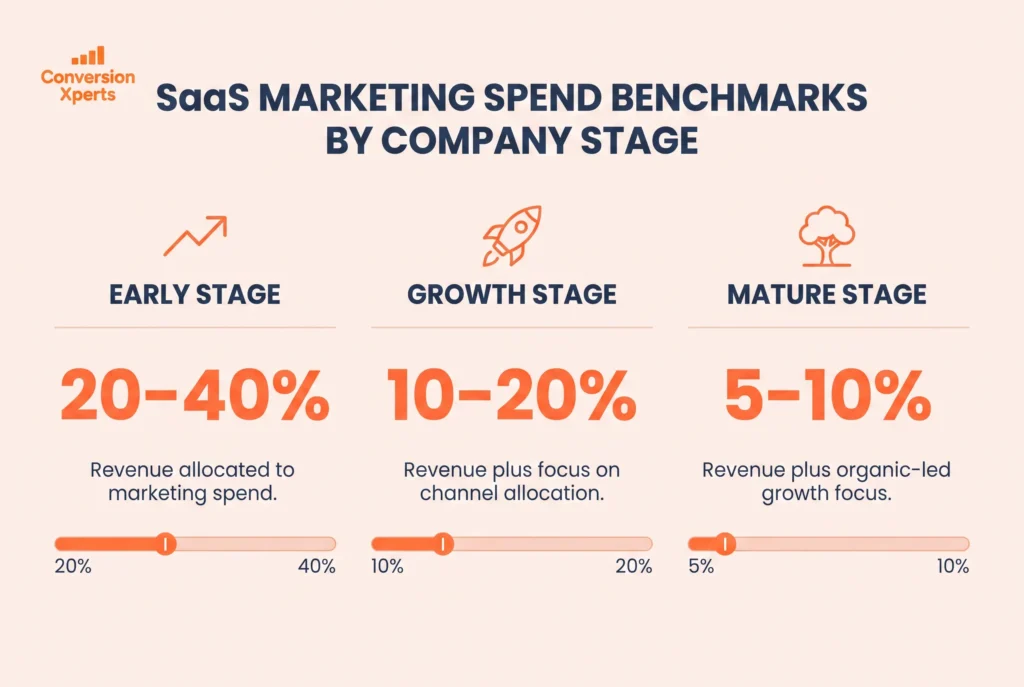
Early-stage companies often spend 20% to 40% of revenue on marketing. At this stage, you are buying market knowledge as much as you are buying customers. You are testing which channels work, which messages land, and which audience segments convert best.
For Pakistani SaaS founders and startups operating on lean budgets, this does not mean spending at global rates. It means allocating proportionally and focusing on channels with measurable return, particularly content, email, and community partnerships.
Growth Stage: Series A to Series C
Growing-stage companies typically invest 10% to 20% of revenue in marketing. By this point, you should have clear data on your best-performing channels and be pouring resources into what works.
The benchmark for total marketing spend is 8% to 18% of target ARR, with paid acquisition typically representing 30% to 50% of the total marketing budget.
Mature Stage: Post-Series C and Beyond
Mature companies tend to spend 5% to 10% of revenue on marketing because their brand is established, organic channels are producing, and customer expansion covers more of their growth target.
How to Use These Benchmarks to Drive SaaS Conversion Optimization
Knowing benchmarks is one thing. Closing the gap between your current performance and top-quartile performance is another. This is where SaaS conversion optimization becomes your most valuable investment.
Start With a Funnel Audit
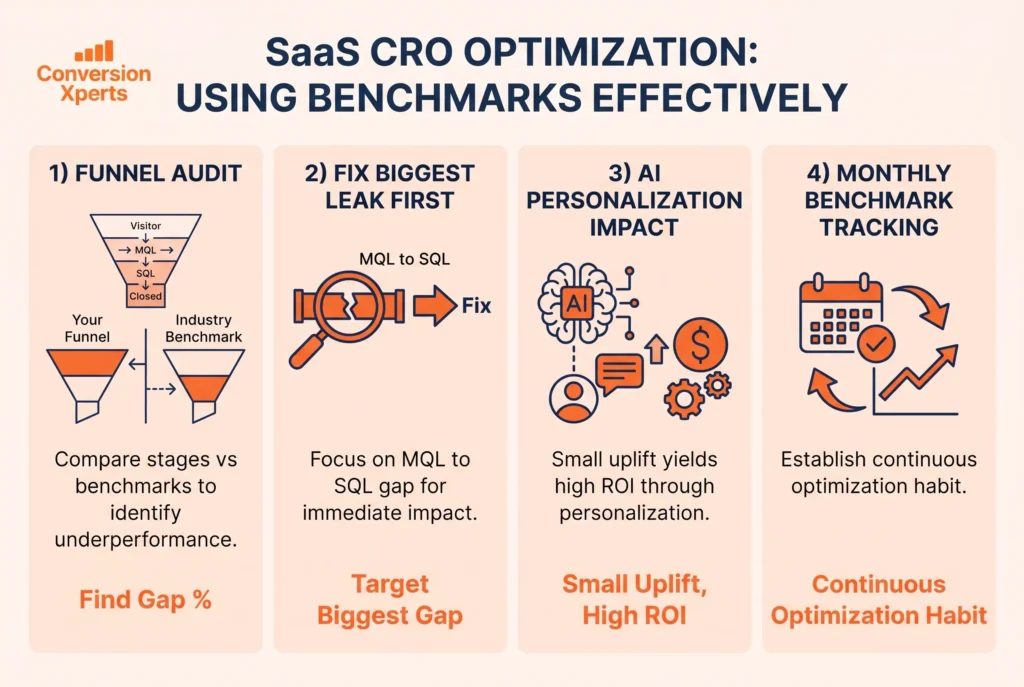
Before you optimize anything, you need to know exactly where your funnel is underperforming. Pull your data from GA4, your CRM, and your ad platforms. Compare each stage against the benchmarks in this guide. The initial benchmarking setup usually takes one to two weeks, and ongoing monthly analysis then tracks competitive position and highlights new conversion opportunities.
Prioritize Your Biggest Leaks First
The MQL-to-SQL stage represents the biggest bottleneck for most SaaS funnels at a 13% conversion rate for companies not actively optimizing it. A five-point improvement here can lift revenue by 18%. That is an enormous return for a focused optimization effort.
Do not try to fix everything at once. Find your single biggest leak and close it first.
Use AI-Powered Personalization
Recent 2025 to 2026 data shows roughly a 10% uplift in conversions when teams use AI-driven personalization across content, outreach, and in-app experiences. This includes dynamic landing pages that adapt to visitor intent, personalized email sequences based on behavior, and in-app messaging triggered by specific actions.
Work With Specialists Who Know SaaS
Most SaaS founders try to handle conversion optimization in-house or work with generalist agencies that do not understand the nuances of SaaS funnels. The result is wasted budget and slow iteration.
At ConversionXperts.com, we specialize specifically in SaaS conversion optimization for growing software companies. Whether you are struggling with a 1% visitor-to-lead rate, a collapsing trial-to-paid funnel, or a CAC that is eating your runway, we help you diagnose the exact problem and fix it with a data-driven, stage-by-stage approach. Our clients span global SaaS companies, including teams based in Pakistan, and we understand how to adapt global best practices to local market realities. If you are serious about hitting top-quartile benchmarks, we are the team that can get you there.
Run Monthly Benchmark Reviews
Teams that understand their funnel stages from awareness through closed-won, plus LTV to CAC ratios, gain context for accurate comparisons, and consistent benchmark reviews, heuristic audits, and revenue-based measurement create a durable foundation for conversion gains. Make benchmark review a monthly team ritual, not a quarterly project.