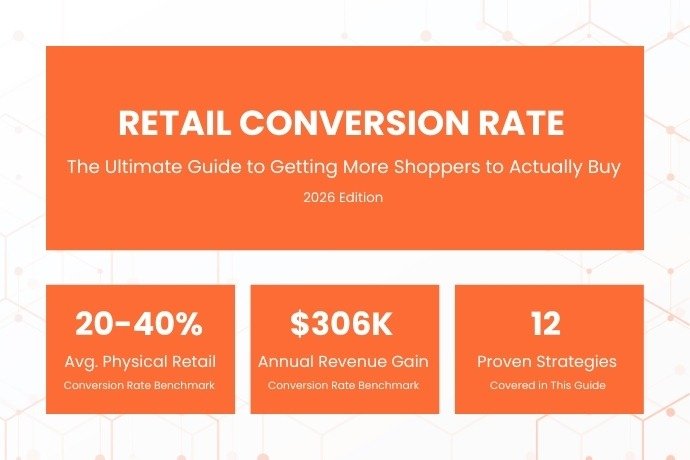
The Retail Conversion Rate Guide 2026
-
By: Henry
- Feb 27
- Comments (0)
What Is Retail Conversion Rate and Why Does It Matter?
Definition
Retail conversion rate is the percentage of people who walk into your store and actually complete a purchase. It is the most fundamental measure of how effectively your physical store turns foot traffic into paying customers.
Most store owners spend the majority of their energy on foot traffic. They run promotions to drive people in, invest in window displays, and track their daily visitor counts obsessively. But here is what that approach misses completely. Foot traffic without conversion is just expensive window shopping. You can have a queue out the door every Saturday and still be losing money if only a fraction of those people are actually buying.
When you increase your conversion rate you make more money from the exact same number of visitors. No extra marketing spend. No bigger store. No new location. Just a better job serving the people already showing up.
Real Numbers Example
A store with 300 daily visitors at 20% conversion makes 60 sales. Move that rate to 25% and you make 75 sales from the exact same traffic. At a $60 average transaction that is $900 more per day — nearly $330,000 extra per year from the same store, the same location, and the same marketing budget.
Conversion Rate vs. Close Rate: Know the Difference
Your conversion rate is a store level number. It measures every visitor who makes a purchase including those who bought without any staff interaction at all. Your close rate is an individual level number measuring the percentage of staff to customer conversations that end in a sale. You need both to properly diagnose where your conversion losses are coming from.
The Retail Conversion Rate Formula
The Formula
Retail Conversion Rate = (Number of Transactions divided by Number of Visitors) multiplied by 100. Example: 88 transactions from 400 visitors = 88 / 400 x 100 = 22%
That number by itself does not tell you much. But when you track it consistently by day, by shift, by week, and by month it becomes one of the most powerful diagnostic tools in retail. A 90 day trend tells you far more than any single Saturday.
Critical Mistake to Avoid
Do not look at your overall conversion rate in isolation. Break it down by hour, by day of week, and by store. An overall rate of 24% might be hiding a Thursday afternoon rate of 38% and a Saturday afternoon rate of 14%. Those two numbers require completely different responses.
What Counts as a Visitor and Why It Matters
A visitor should mean a genuine potential customer who entered your store. In practice most stores count visitors using a door sensor that clicks every time the beam is broken. But staff walking in and out, delivery drivers, the plumber fixing your bathroom — all of these can inflate your visitor count and make your conversion rate look worse than it really is.
- Use a separate staff entrance if possible
- Set a minimum dwell time threshold so anyone exiting within 10 seconds is excluded
- Calibrate your counter regularly against a manual count to check for drift
Average Retail Conversion Rate Benchmarks by Store Type In 2026
The average retail conversion rate in the United States ranges from 20 to 40 percent across most physical store categories. But this number changes dramatically depending on what kind of store you operate. Many articles online quote benchmarks of 2 to 4 percent — those are ecommerce website figures, not physical retail. A brick and mortar store at 2 percent would be on the verge of collapse.
| Store Type | Typical Range | Top Quartile | Key Driver |
| Grocery & Supermarket | 60 to 70% | 75%+ | Shoppers arrive with a list and clear intent |
| Pharmacy & Drug Store | 50 to 60% | 65%+ | Destination shopping, often urgent |
| Beauty & Cosmetics | 30 to 45% | 50%+ | Testers and in-store demos drive decisions |
| Sporting Goods | 25 to 40% | 45%+ | Knowledgeable staff and seasonal demand |
| Apparel & Fashion | 20 to 30% | 35%+ | Fitting room access is the biggest variable |
| Home Goods & Furniture | 20 to 35% | 40%+ | Considered purchases take multiple visits |
| Electronics | 15 to 25% | 30%+ | Research heavy; real showrooming pressure |
| Luxury & Jewelry | 5 to 15% | 20%+ | Low volume; high ticket value compensates |
Sources: RetailNext Retail Performance Pulse 2025, Sensormatic Solutions Shopper Traffic Report 2025
The Weekday vs. Weekend Gap Nobody Talks About
Critical Mistake to Avoid
Do not look at your overall conversion rate in isolation. Break it down by hour, by day of week, and by store. An overall rate of 24% might be hiding a Thursday afternoon rate of 38% and a Saturday afternoon rate of 14%. Those two numbers require completely different responses.
The Real Reasons Shoppers Leave Without Buying
Before you can fix your retail conversion rate you need to understand what is actually suppressing it. Most store owners guess at this and guess wrong, pointing to external factors when the real problems are internal and completely fixable.
1. Nobody Acknowledged Them
A 2025 study by Retail Systems Research found that 68 percent of shoppers who left without buying mentioned that no one greeted them or acknowledged their presence as a contributing factor. This is entirely a training and accountability issue. It costs nothing to fix and results show up within days.
2. The Store Was Too Confusing
Retail researcher Paco Underhill found that confusion is one of the shortest paths to walking out without buying. Cluttered displays, unclear signage, and illogical product groupings all create cognitive friction. Walk your own store as a first time visitor and ask honestly: would you know where to go within 10 seconds of entering?
3. Checkout Was Too Painful
According to Zebra Technologies’ 2025 Global Shopper Study, 37 percent of US shoppers have abandoned a purchase specifically because the checkout line was too long. That is more than one in three potential buyers lost at the final moment.
4. Price Did Not Match Perceived Value
A product at $95 with no context, no story, and nobody around to articulate the value converts at a much lower rate than the same product with clear merchandising that tells its story. The issue is rarely the price itself — it is the absence of justification.
5. They Were Planning to Buy Online Later
In electronics, sporting goods, and home goods a real percentage of visitors are showroomers using your store to touch and try products they intend to buy online at a lower price. A clear in-store strategy — price matching, exclusive inventory, superior service — converts significantly more of them.
The Real Reasons Shoppers Leave Without Buying
Every strategy below has been tested in real stores with real results. Work through them in order , the first few are the fastest and cheapest to implement.
Change How Your Staff Say Hello
Replace ‘Can I help you?’ with observation based greetings. ‘Those trainers came in yesterday and the red ones are already sold out’ opens a real conversation. RedSeed documented 3 to 5 percentage point conversion gains from this single change alone.
Result: 3 to 5 point conversion increase within 30 days at no cost
Align Your Staffing Schedule to Your Traffic Data
Pull 90 days of people counter data. Identify your five highest traffic windows of the week. Lay your actual staffing schedule alongside those windows. Fix the mismatch. It is a scheduling change and it costs nothing to implement.
Result: $180,000 annual gain for a 12-store chain from scheduling alone
Make Checkout the Fastest Part of the Visit
Enable tap to pay — the NRF 2025 data shows contactless payment reduces checkout time by 40%. Add mobile POS so staff can ring up customers on the floor. Separate returns processing from your main register to prevent queue buildup.
Result: 40% reduction in average checkout time
Use Your Displays to Tell a Story
Move from products on shelves to stories on shelves. A fully styled bedroom display sells more than individual duvets on hooks. Group products in threes. Place high margin items at eye level. Use signage to answer price objections proactively before any staff interaction.
Result: Consistently higher basket size and conversion in lifestyle display formats
Make Your Return Policy Impossible to Miss
Display your return policy on price tags for items over $50, at the checkout counter, and train staff to mention it proactively. A 2024 Narvar study found 96% of customers would shop with a retailer again if the return experience was simple.
Result: Removes final mental barrier between browsing and buying
Fill Stock Gaps With an Endless Aisle Approach
Equip staff with tablets to check nearby stock, arrange transfers, or place ship-from-warehouse orders on the spot. BCG’s 2025 omnichannel report found this recovers 20 to 30 percent of sales that would otherwise be lost to out-of-stock situations.
Result: 20 to 30% recovery of would-be lost sales
Run In-Store Events on Your Slowest Days
EventTrack 2025 research found 91% of consumers felt more positively about a brand after participating in an in-store event. Product demos, workshops, and meet-the-maker events consistently drive 15 to 25% conversion spikes on event days.
Result: 15 to 25% conversion rate increase on event days
Schedule the Right People for the Right Day
Put your most consultative staff on the floor during weekday quiet periods for longer conversations. On weekends schedule your highest energy, fastest qualifying staff because they will manage more volume with less time per customer.
Result: Optimizes every staff member’s natural strengths for the day’s shopping behavior
Train the Natural Next Step Upsell
Replace ‘Would you like anything else?’ with ‘With that coffee machine most customers also grab the descaling kit — it is $14 and extends the life of the machine significantly. Want me to grab one?’ Build 3 to 5 standard bundle pairings for your top sellers.
Result: Higher units per transaction without any additional foot traffic
Collect Real Time Feedback at the Exit
A single tablet question near the exit — ‘Did you find everything you were looking for today?’ — generates actionable data within days. Tools like TruRating collect this feedback at the payment terminal for much higher response rates.
Result: Uncovers hidden product gaps, display issues, and staffing blind spots
Design Your Floor Plan as a Conversion Path
Place basket stations throughout the store not just at the entrance — customers with a basket buy more and stay longer. Avoid placing high margin products in the decompression zone (the first 5 to 10 feet inside the entrance) where shoppers are still adjusting.
Result: Higher basket sizes and longer dwell times from customers who pick up a basket
Test One Thing at a Time and Measure Everything
Change one variable at a time — a greeting script, a display, a sign, a checkout process. Run it for two weeks. Compare conversion before and after. Keep the winner. Revert the loser. Document everything. This iterative approach is how a 22% rate becomes 35% over 18 months.
Result: Compounding conversion improvement through systematic experimentation
The Best Tools to Track Conversion Rates in Your Store
You cannot manage what you do not measure. Here are the best tools to track conversion rates in your store in 2026, organized by budget and store size.
| Tool | Best For | Cost Level | Key Strength |
| Dor | Small independents | From $39/month | Simple thermal sensor; works with Square and Shopify |
| Limetrics | Budget independents | Low to medium | Video based counting; no hardware install needed |
| Density | Any size store | Medium to high | Industry leading accuracy; real time data output |
| RetailNext | Mid to large stores | High | Video AI platform; analytics beyond just counting |
| Sensormatic | Enterprise chains | High | Integrates with ShopperTrak industry benchmarks |
POS Systems With Built In Conversion Tracking
- Lightspeed Retail : integrates with most major people counters; generates daily conversion rate dashboard automatically
- Shopify POS : excellent if you also operate online; unifies in-store and online conversion data into one view
- Square for Retail : accessible for smaller stores; connects smoothly with Dor and Density
- Revel Systems : enterprise grade with detailed analytics dashboard for multi-location operators
Free Starting Point for Any Store
Not ready to invest in hardware? Buy a $5 tally counter. Assign one staff member per shift to click it for every customer who enters. Divide the count into your POS transaction total and multiply by 100. Do this for 30 days. You will have a real baseline — and a real baseline is infinitely more useful than no data at all.
Three Real World Case Studies With Hard Numbers
A women’s apparel boutique in Austin, Texas was converting at 19% against a 25% industry average. The owner ran a focused half-day workshop on replacing ‘Can I help you?’ with observation based, product specific opening lines. Within 45 days conversion moved to 25.3%. At an average transaction value of $87 with 400 daily visitors, this single change added $2,200 in additional weekly revenue.
A regional sporting goods chain with 12 US locations found Saturday afternoon conversion (1 to 5 PM, peak traffic) ran 4 to 5 points below weekday rates. Analysis revealed most weekend staff started at 9 AM and left by 2 PM — leaving the busiest hours with the thinnest floor coverage. After redistributing shifts to the 1 to 5 PM window, conversion improved from 26% to 30.4% within 60 days.
A home goods retailer with 8 Midwest locations was experiencing visible checkout abandonment during holiday trading. Staff could watch customers put items down and leave the queue. After implementing mobile POS capability across all locations and adding a second fixed register during peak hours, the queue issue was eliminated within two weeks of rollout.
FAQ: People Also Ask About Retail Conversion
These are the questions real store owners and managers search for most. Each answer is written in plain English with the most important information first.
Q: What is a good retail conversion rate in 2026?
For most US specialty retailers 25 to 40 percent is considered solid. Grocery and convenience stores convert at 60 to 70 percent. Luxury retailers typically target 10 to 15 percent because high average transaction values compensate for lower volume. Always benchmark against your own store category not retail as a whole.
Q: What does conversion rate mean in retail?
It means the percentage of people who walk into your store and complete a purchase. If 100 people enter and 24 buy something your conversion rate is 24 percent. It is the most direct measure of how effectively your store turns foot traffic into actual revenue.
Q: What is the retail conversion rate formula?
Number of Transactions divided by Number of Visitors multiplied by 100. If your store recorded 96 transactions from 400 visitors your conversion rate is 24 percent. You need a people counter for the visitor number and a POS system for the transaction count.
Q: How do I improve conversion rate in retail stores?
Start with your staff greeting because research shows it has the fastest and most significant impact of any single change. Replace ‘Can I help you?’ with a specific observation based comment about a product. Then address checkout speed, staffing alignment with peak traffic hours, and your store layout.
Q: How to increase store conversion without increasing advertising spend?
Focus entirely on the in-store experience of visitors you already have. Change the greeting script, align staffing to peak traffic windows, speed up checkout through mobile POS and contactless payment, and display your return policy prominently. Every one of these changes is either free or very low cost.
Q: What tools can I use to track conversion rates in my store?
You need a people counter and a connected POS system. For people counting: Dor from around $39 per month for small stores, Density for mid-size accuracy, RetailNext and Sensormatic for enterprise. For POS: Lightspeed, Shopify POS, and Square for Retail all offer automatic conversion rate reporting.
Q: What is the difference between conversion rate and close rate in retail?
Conversion rate covers every visitor who completes a purchase. Close rate measures specifically the percentage of staff to customer conversations that end in a sale. Conversion rate shows overall store health. Close rate shows individual staff performance. You need both.
Q: Why are weekday conversion rates usually higher than weekend rates?
Weekday shoppers tend to arrive with a specific purchase intention. Weekend shoppers more often browse without a fixed plan. This means your most skilled and proactive staff should be scheduled during your highest weekend traffic windows rather than your quietest weekday shifts.
Conclusion: Three Things to Do Before You Open Tomorrow
Your retail conversion rate is not just a performance metric. It is a mirror held directly up to every aspect of your store experience. Fix the experience and the number improves. Leave it as it is and every dollar you spend on marketing leaks straight out the door with your unconverted visitors.
01 Commit to Measuring It
If you are not tracking your retail conversion rate every day everything else is guesswork. Get a people counter ordered today or start a manual tally tomorrow morning. You need a real baseline before you can improve anything.
02 Change the Greeting Tonight
At your next team briefing tell your staff clearly that ‘Can I help you?’ is retired. Show them two or three observation based alternatives that work for your store. Practice them for five minutes. The next day you will already be converting better.
03 Look at Your Schedule Alongside Your Traffic Data
Pull up both right now. Find your five highest traffic hours of the week. Check who is on the floor during those windows. Fix the mismatch before next week’s roster is locked in.
The Revenue Opportunity Sitting in Front of You Right Now
The difference between a 22% and a 28% retail conversion rate in a store with 500 daily visitors and an $85 average transaction value is $25,500 per month. That is $306,000 per year from the exact same store, the same location, and the same marketing budget. You already have the traffic. You already have the team. You just need to use both more deliberately than you have been.
Sources and References
RetailNext Retail Performance Pulse 2025 — retailnext.net
Sensormatic Solutions Shopper Traffic Report 2025 — sensormatic.com
Zebra Technologies Global Shopper Study 2025
Narvar Consumer Returns Study 2024
Boston Consulting Group Omnichannel Retail Report 2025
EventTrack Event Marketing Research 2025
Retail Systems Research Conversion Study 2025
National Retail Federation Shopper Data 2025 — nrf.com